
Contact Center Transformation Market Size and Share
Market Overview
| Study Period | 2020 - 2031 |
|---|---|
| Market Size (2026) | USD 53.03 Billion |
| Market Size (2031) | USD 98.27 Billion |
| Growth Rate (2026 - 2031) | 13.13 % |
| Fastest Growing Market | Asia Pacific |
| Largest Market | North America |
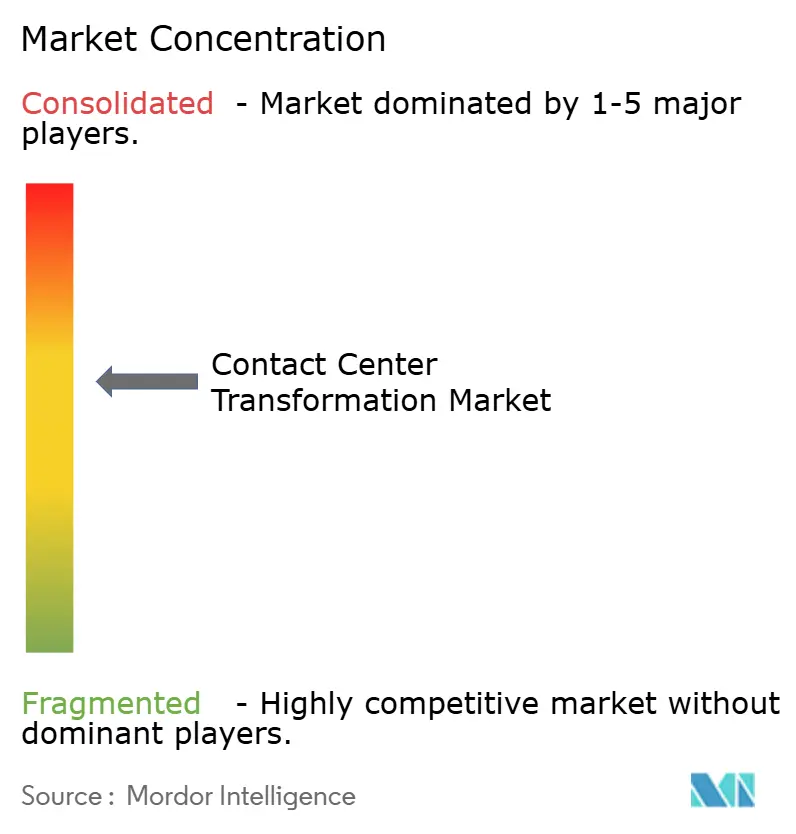
| Market Concentration | Medium |
Major Players *Disclaimer: Major Players sorted in no particular order Image © Mordor Intelligence. Reuse requires attribution under CC BY 4.0. | |
Contact Center Transformation Market Analysis by Mordor Intelligence
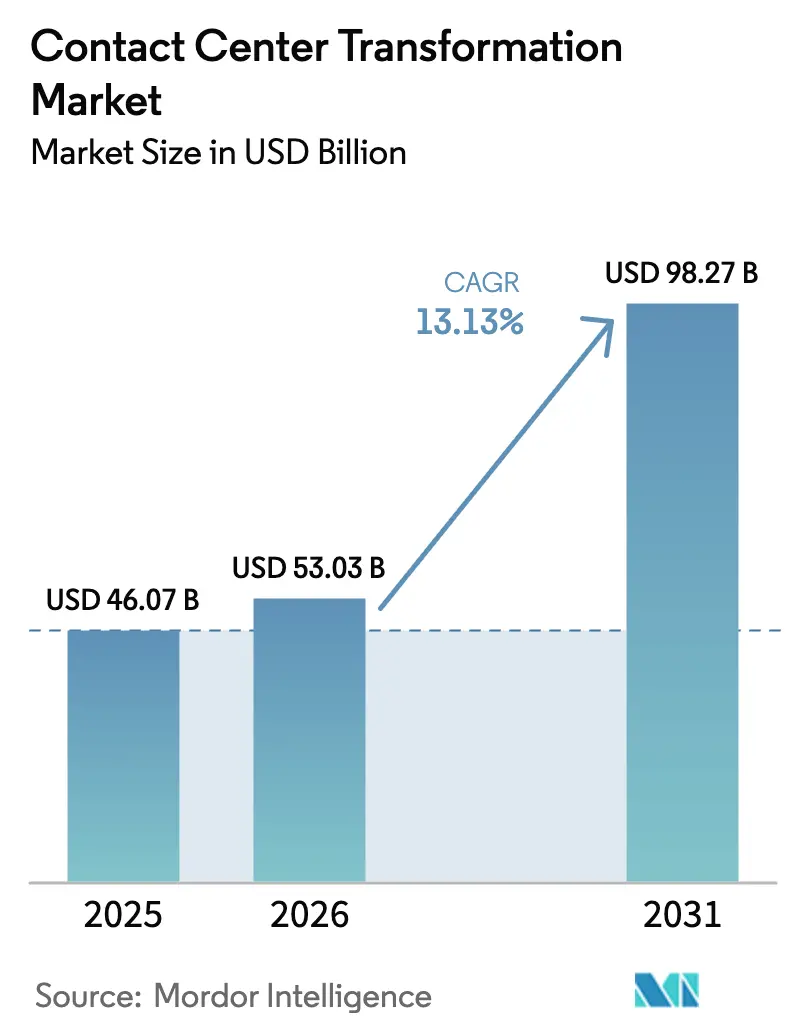
The Contact Center Transformation Market size is expected to grow from USD 46.07 billion in 2025 to USD 53.03 billion in 2026 and is forecast to reach USD 98.27 billion by 2031 at 13.13% CAGR over 2026-2031.
Real-time analytics, artificial intelligence, and omnichannel orchestration are replacing legacy private branch exchange systems, enabling faster issue resolution and richer customer insights. Demand intensifies as subscription-based cloud deployments convert fixed costs to operating expenses, while automation trims labour, which still represents 60% to 70% of operating outlays. Financial-services providers are early adopters because fraud detection, voice biometrics, and audit-grade recording are now table stakes, and telehealth growth positions healthcare as the next large wave of adopters. Competitive pressure is increasing as hyperscale cloud providers bundle compute, storage, and machine learning with contact center software, offering aggressive unit pricing and rapid feature velocity. Regionally, privacy regulations and data-localization rules are shaping vendor roadmaps, forcing multi-tenant platforms to deliver country-specific instances without compromising latency or uptime.
Key Report Takeaways
- By end-user industry, banking, financial services, and insurance held 27.59% of the contact center transformation market share in 2025, whereas healthcare is expanding at a 13.96% CAGR through 2031.
- By deployment, on-premises architectures commanded 61.58% of the contact center transformation market size in 2025, yet hosted solutions are advancing at 13.68% CAGR.
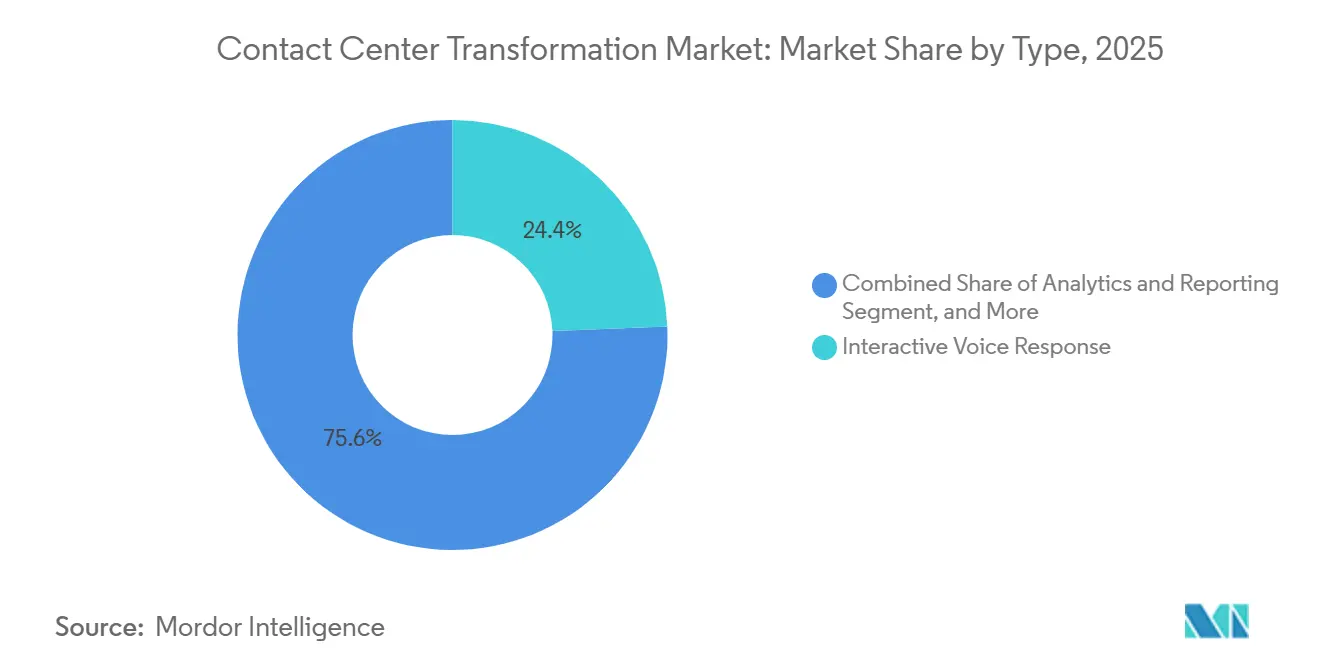
- By type, interactive voice response held 24.37% share in 2025, while analytics and reporting platforms are pacing the field at a 14.83% CAGR through 2031.
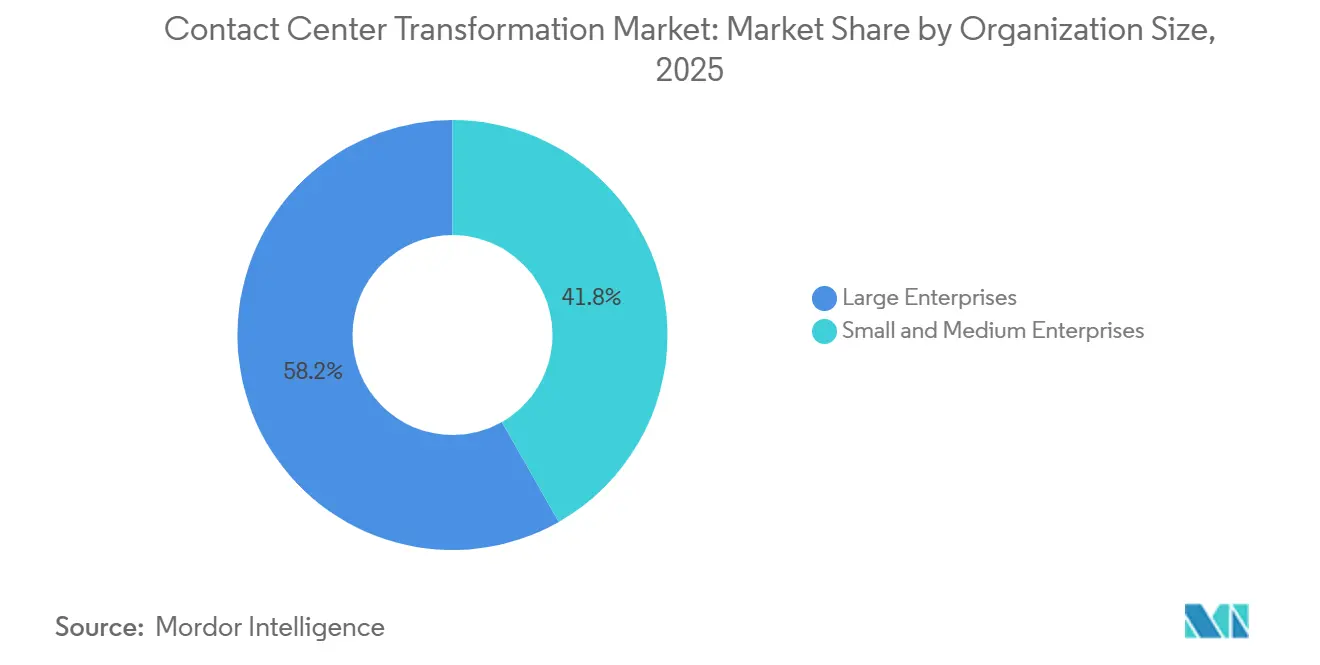
- By organization size, large enterprises led with 58.23% of global revenue in 2025, but small and medium enterprises are scaling at a 14.12% CAGR because subscription pricing cuts total cost of ownership 30% to 40%.
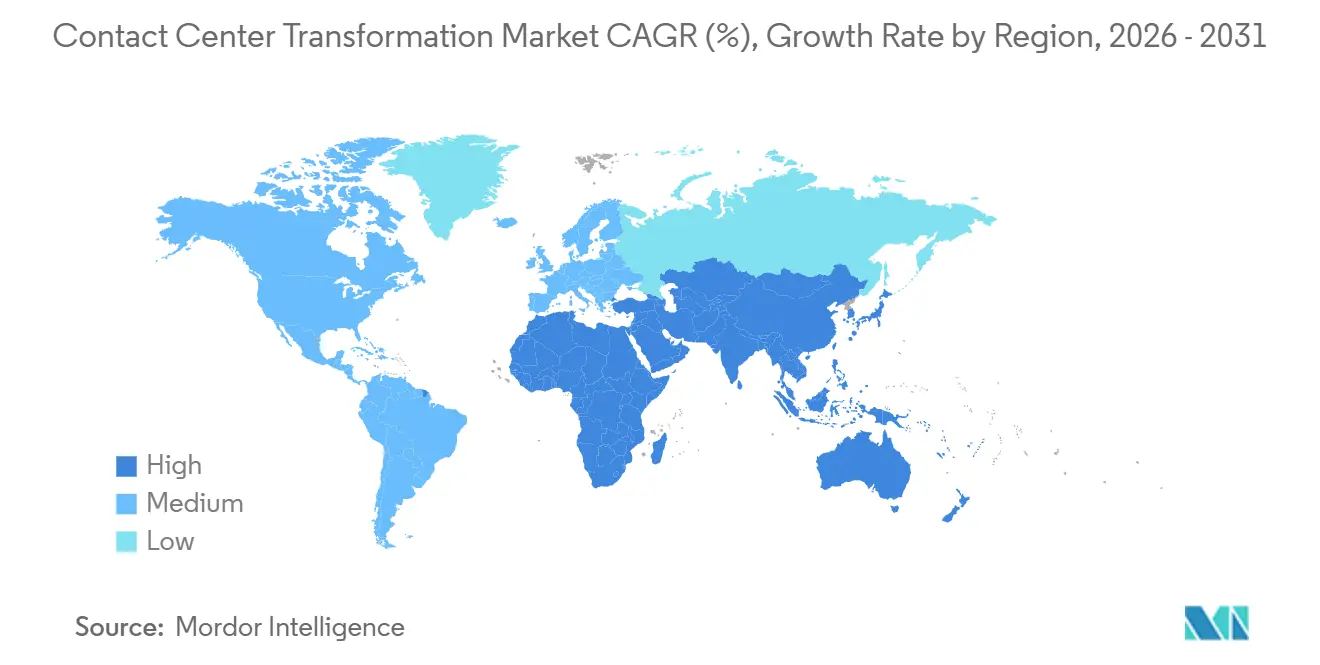
- By geography, North America captured 36.49% revenue in 2025, but Asia Pacific records the fastest regional CAGR at 14.55% to 2031.
Note: Market size and forecast figures in this report are generated using Mordor Intelligence’s proprietary estimation framework, updated with the latest available data and insights as of January 2026.
Market Trends and Insights
Drivers Impact Analysis of Contact Center Transformation Market*
| Driver | (~) % Impact on CAGR Forecast | Geographic Relevance | Impact Timeline |
|---|---|---|---|
| Rising Demand For Omnichannel Customer Engagement | +2.10% | Global, with concentration in North America and Europe | Medium term (2-4 years) |
| Shift Toward Subscription-Based Cloud Contact Centers | +2.40% | Global, led by North America and Asia Pacific | Short term (≤ 2 years) |
| Cost Reduction Imperative Through Automation | +2.80% | Global, particularly strong in Asia Pacific and Latin America | Short term (≤ 2 years) |
| Compliance Pressures In Regulated Industries | +1.60% | North America, Europe, with emerging impact in Asia Pacific | Long term (≥ 4 years) |
| Growing Use Of Real-Time Speech Analytics | +1.40% | North America and Europe, expanding to Asia Pacific | Medium term (2-4 years) |
| Customer-Owned Data Lake Integration Needs | +1.20% | North America and Europe, early adoption in Asia Pacific | Long term (≥ 4 years) |
| Source: Mordor Intelligence | |||
Rising Demand for Omnichannel Customer Engagement
Customers shift fluidly between voice, email, chat, social media, and messaging, and they expect context to travel with them. Three-quarters of service journeys now involve more than one touchpoint, yet fewer than one-third of enterprises maintain unified profiles, which elevates churn and repeat contact rates. Retailers, e-commerce platforms, and subscription media brands therefore invest in channel-agnostic routing engines that map sentiment, customer value, and agent skill in real time to cut average handle time by one-fifth. Cloud platforms embed unified desktops, so agents immediately see prior conversation threads, improving first-contact resolution and net promoter scores. The impact is most pronounced in consumer-facing industries where brand perception hinges on friction-free interactions.[1]
Shift Toward Subscription-Based Cloud Contact Centers
Chief financial officers favour operating-expense models that remove hardware refresh cycles and shrink deployment from months to weeks. Large-scale migrations show total cost of ownership reductions north of one-third over five-year horizons because upkeep, patching, and capacity planning shift to the vendor. Annual recurring revenue for leading providers is rising more than 40% on new cloud subscriptions, underscoring demand elasticity when upfront capital barriers fall. Hosted licenses also let enterprises launch greenfield operations in emerging markets by spinning up agent seats in hours instead of procuring rack space. Adoption is particularly swift among Asian small and medium enterprises that lack the resources for on-premises builds yet still need enterprise-grade uptime and compliance.
Cost Reduction Imperative Through Automation
Voice and chatbots now close roughly 70% of tier-one tickets, freeing human agents for complex problem-solving. Large enterprises report labour savings of up to one-quarter, with payback periods under 18 months when virtual assistants, predictive dialers, and robotic process automation handle repetitive tasks. Workforce management algorithms forecast interaction peaks and adjust staffing, trimming idle time 15% to 20%. Automating after-call documentation alone recovers thousands of productive hours annually in business-process-outsourcing hubs facing double-digit wage inflation. The capex-to-labour substitution effect is strongest in India, the Philippines, and Latin America where attrition tops 40% and wage pressures squeeze operator margins.
Compliance Pressures in Regulated Industries
Financial institutions must encrypt payment data end to end, health systems must log every access to protected health information, and European banks must deploy voice biometrics that authenticate callers within seconds. These mandates require modern call recording, audit trails, and AI-driven redaction that legacy PBX gear cannot supply. Vendors able to certify against the Payment Card Industry Data Security Standard, the Health Insurance Portability and Accountability Act, and regional data residency laws secure premium contract values, sometimes 50% higher than unregulated verticals. Diverging statutes mean global organizations now architect region-specific cloud instances, a complexity that favours platforms with granular policy engines and elastic multi-region footprints.
Restraints Impact Analysis of Contact Center Transformation Market*
| Restraint | (~) % Impact on CAGR Forecast | Geographic Relevance | Impact Timeline |
|---|---|---|---|
| Integration Complexities With Legacy PBX | -1.80% | Global, particularly acute in Europe and mature North American enterprises | Medium term (2-4 years) |
| Data-Privacy And Sovereignty Concerns | -1.50% | Europe, China, India, with spillover to multinational deployments | Long term (≥ 4 years) |
| Agent Skill Gaps For AI-Augmented Workflows | -0.90% | Global, most pronounced in Asia Pacific and Latin America BPO hubs | Medium term (2-4 years) |
| Uncertain ROI For Edge-Deployed Contact Centers | -0.70% | North America and Europe, limited adoption in other regions | Long term (≥ 4 years) |
| Source: Mordor Intelligence | |||
Integration Complexities with Legacy PBX
Enterprises often operate 10-year-old switching infrastructure custom-wired to billing, order management, and customer-relationship-management systems. Undocumented call flows, home-grown IVR scripts, and mixed vendor hardware extend migrations up to 18 months, raising consulting bills beyond annual run-rate spend for mid-market firms. Professional-services engagements average several million United States dollars, and overruns are common when data conversion or compliance gaps surface late in the project. European organizations face additional hurdles because multi-vendor estates complicate retention of call recordings for statutory periods, stretching timelines and undermining internal business cases.
Data-Privacy and Sovereignty Concerns
The European Union’s General Data Protection Regulation levied EUR 1.6 billion in fines during 2024, stoking board-level anxiety about cross-border data flows. China’s Cybersecurity Law blocks outbound transfers unless operators obtain government approval, and India is debating localization that would raise infrastructure costs by one-quarter. Multinationals must therefore deploy country-specific cloud footprints, fracturing global agent pools, reducing scale efficiencies, and inflating compliance audits. The resulting operational drag slows cloud conversion rates for risk-averse enterprises that cannot reconcile cost-savings targets with jurisdictional rules.
*Our forecasts treat driver/restraint impacts as directional, not additive. The impact forecasts reflect baseline growth, mix effects, and variable interactions.
Contact Center Transformation Market Segment Analysis
By Type:
Analytics Platforms Outpace Legacy IVRAnalytics and reporting tools, expanding at a 14.83% CAGR, are eclipsing legacy IVR’s 24.37% 2025 share as executives demand sentiment tracking and predictive churn alerts rooted in natural-language processing. This slice of the contact center transformation market size is fuelled by attach rates that now exceed three-quarters of net-new platform sales, reflecting recognition that voice and text interactions are strategic data assets. Intelligent call routing and workforce optimization modules ride the same trend, leveraging machine learning to pair customers with agents based on skill, language, and lifetime value, trimming average handle time by up to 20%.
Dialers, CTI connectors, and service engagements hold steady but slower growth, constrained by tightening rules on unsolicited calls and by cloud platforms embedding middleware natively. Yet services revenue remains important because enterprises outsource complex migrations and continuous optimization. The pivot toward analytics signals that competitive advantage now lies in converting call recordings and chat logs into actionable insight, rather than merely handling volume.

By Deployment:
Hosted Solutions Gain Despite On-Premises DominanceOn-premises systems held 61.58% of the contact center transformation market share in 2025, but hosted deployments are advancing at 13.68% CAGR as organizations chase elastic capacity, automatic upgrades, and subscription pricing that converts capex to opex. Financial institutions and hospitals increasingly prefer hybrid configurations, keeping authentication or payment modules in-house while placing agent desktops, workforce management, and analytics in the vendor cloud. Hyperscalers intensify the shift by offering bundled contact center software alongside compute and storage at discounts that legacy vendors struggle to match.
Hosted deployments also speed geographic expansion, letting enterprises spin up thousands of seats across continents in weeks rather than procuring local data-center space. Latency-sensitive use cases, such as emergency dispatch or trading floors, and jurisdictions with patchy internet still favour on-premises or edge nodes. Consequently, the deployment mix will likely stabilize in a barbell shape, with greenfield and mid-market adopters defaulting to cloud while specialized workloads cling to dedicated hardware.
By Organization Size:
SMEs Embrace Cloud-First StrategiesLarge enterprises captured 58.23% of 2025 revenue, leveraging scale for volume discounts and integrated hybrid estates that span on-premises, private, and public clouds. They average thousands of agent seats across multiple countries and demand customized security, language support, and open APIs, lengthening sales cycles but yielding high contract values.
Small and medium enterprises, however, are the fastest risers, posting a 14.12% CAGR through 2031 as subscription tiers drop entry costs. Cloud-first platforms deliver pre-configured templates that activate in eight weeks, letting startups and mid-tier firms launch high-quality service with minimal IT staff. This dynamic is visible across Asia Pacific, where digital-native e-commerce and fintech companies scale from zero to hundreds of agents without touching a data center. Price sensitivity remains a constraint, so vendors rely on usage-based billing and automated onboarding to prevent churn.
By End-User Industry:
Healthcare Adoption Accelerates Post-PandemicBanking, financial services, and insurance held 27.59% share in 2025, sustained by regulatory mandates for secure call recording, fraud detection, and voice authentication. Contract values here continue to exceed average deal sizes because compliance add-ons, redundancy zones, and encryption are compulsory.
Healthcare, expanding at 13.96% CAGR, is converting contact centers into telehealth and patient-engagement hubs that integrate electronic health records, appointment scheduling, and secure messaging. Hospitals report administrative cost savings north of 30% when agents and clinicians share unified desktops, and full audit trails ensure Health Insurance Portability and Accountability Act compliance. Media, retail, and telecommunications firms follow, emphasizing omnichannel orchestration that ties billing, subscription management, and in-store experiences to contact center workflows. Government and utilities adopt more slowly but provide multiyear contracts once platforms pass procurement and cybersecurity reviews.
Geography Analysis
APAC Contact Center Transformation Market
Asia Pacific delivers the fastest growth trajectory at 14.55% CAGR because India’s business-process-outsourcing ecosystem employs 1.4 million agents and domestic enterprises now shift to cloud platforms to remain competitive. China’s data-residency mandates drive local infrastructure buildouts, benefitting indigenous vendors while raising entry costs for multinationals that must invest in local zones to comply. Southeast Asia’s e-commerce boom drives 24-hour service demand, and domestic small and medium enterprises gravitate toward pay-as-you-go models that minimize upfront costs.
North America Contact Center Transformation Market
North America remains the largest regional contributor at 36.49% revenue share in 2025, buoyed by early cloud adoption, sophisticated analytics use cases, and a mature ecosystem of system integrators and vendors. Privacy-shield successor agreements facilitate cross-border data flows, enabling consolidated operations that exploit labour arbitrage. United States enterprises lead adoption of AI-driven sentiment analysis and workforce automation to contain rising wage pressures and elevate customer-experience metrics.[2]
Europe Contact Center Transformation Market
Europe follows, propelled by demand from financial services, retail, and government agencies. Strict General Data Protection Regulation enforcement stretches procurement cycles and adds professional-services cost, yet it simultaneously accelerates platform refresh as older systems cannot satisfy consent logging or data-erasure mandates. Southern European outsourcing hubs in Portugal and Greece attract foreign investment because multilingual talent pools lower cost per seat while staying inside the regulatory perimeter.
MEA and South America Contact Center Transformation Market
South America registers moderate expansion, with Brazil accounting for three-fifths of regional deployments. Currency volatility and political uncertainty temper long-range capex, so enterprises favour cloud subscription contracts that can scale down if economic conditions tighten. The Middle East and Africa remain nascent, though Saudi Arabia and the United Arab Emirates invest heavily under economic-diversification programs, funding government and telecom projects that require Arabic-language support and onshore hosting. South Africa leads African adoption but poor connectivity in rural zones sustains on-premises demand that tolerates intermittent bandwidth.
Regulatory Landscape
Data protection, sector compliance, and telecom consumer-protection rules materially shape contact center transformation roadmaps, particularly for cloud deployments, recording, and AI-enabled analytics. GDPR enforcement remains a core constraint on cross-border interaction data handling, with reported EU fines totaling EUR 1.6 billion during 2024. This reinforces requirements for consent logging, retention controls, redaction, and erasure workflows across omnichannel transcripts and call recordings.
In the United States, the Federal Communications Commission advanced onshoring and disclosure-related policy activity through a Notice of Proposed Rulemaking in CG Docket No. 26-52 (published in the Federal Register in April 2026). The proposal targets covered telecom service providers (telecommunications, CMRS, interconnected VoIP, cable television, and DBS) and focuses on customer disclosure of call center location and routing/transfer options to U.S.-based representatives. In parallel, ITU-T recommendations on telecom intelligent customer service systems, including F.748.67 and F.748.71 (approved December 2025) and M.3389 (approved March 2025), provide common requirements that influence how vendors operationalize AI governance, model generalization, and customer experience management in contact center deployments.
Competitive Landscape
The top 10 vendors command roughly 55% of global revenue, making the contact center transformation market moderately concentrated. Genesys, NICE, and Avaya leverage decades-long customer bases, extensive integrations, and compliance certifications to defend share. Cloud-native rivals, Five9, Talkdesk, and RingCentral differentiate through consumption pricing, rapid feature releases, and AI modules that reduce time to value. Amazon Web Services and Microsoft Azure disrupt margins by bundling contact center software with broader cloud consumption agreements, offering discounts of 30% to 40% for consolidated workloads.
Vertical specialization is emerging as a new frontier. Vendors that embed electronic health record connectors, voice biometrics certified for banking, or language packs optimized for regional dialects gain traction in regulated or underserved niches. Smaller players focus on real-time analytics, workforce optimization, or conversational AI, often entering technology-transfer partnerships or positioning for acquisition. Incumbents reinforce portfolios through intellectual-property filings, such as Cisco’s predictive routing algorithms that consider nearly 50 variables per interaction, signalling an arms race in applied data science rather than core telephony.
Competitive intensity is expected to escalate through 2031 as artificial intelligence commoditizes baseline features. Differentiation will hinge on regulatory depth, ecosystem breadth, and total cost of ownership rather than call-handling capacity alone. Vendors that balance global footprint with localized compliance, transparent pricing, and vertical accelerators will outpace peers that rely solely on legacy maintenance contracts.[3]
Contact Center Transformation Industry Leaders
-
RingCentral Inc.
-
NICE Systems Inc.
-
8x8 Inc.
-
Genesys Telecommunications Laboratories Inc.
-
Five9 Inc.
- *Disclaimer: Major Players sorted in no particular order
Contact Center Transformation Market Companies Covered in this Report
- RingCentral Inc.
- NICE Ltd.
- 8x8 Inc.
- Genesys Telecommunications Laboratories Inc.
- Five9 Inc.
- Avaya Inc.
- Enghouse Interactive Inc.
- Vocalcom SA
- Mitel Networks Corp.
- Altitude Software
- Aspect Software Inc.
- Cisco Systems Inc. (Webex Contact Center)
- Amazon Web Services Inc. (Amazon Connect)
- Talkdesk Inc.
- Zendesk Inc.
- Twilio Inc.
- Vonage Holdings Corp.
- Content Guru Ltd.
- Huawei Technologies Co. Ltd.
- BT Group plc
Market Opportunities and Future Outlook
A near-term whitespace is emerging around telecom-led, AI-native contact center programs that link interaction handling to back-office execution and customer data platforms. That shift is driving demand for packaged integration, governance, and measurement frameworks, rather than standalone routing or IVR upgrades. TM Forum and Huawei published IG1465 AI4Contact-Center and the Contact Center Intelligence Maturity Model (CCIMM) at DTW 2026 (June 2026), giving enterprises and service providers a shared maturity and KPI structure that supports vendor selection, multi-year transformation sequencing, and benchmarking across operations.
Operator and large-enterprise migrations also point to opportunity areas in cloud modernization services, sovereign or localized deployments, and embedded AI agent layers. DXC Technology completed a cloud migration for Telenor Sweden in May 2026, supporting more than 500 concurrent specialists and roughly 300,000 calls per month, which aligns with enterprise-scale needs for performance, reliability, and operating-model change. In Asia Pacific, SK Telecom outlined an AI-native approach at MWC 2026 (March 2026), including an integrated AI agent for its contact center and deployment of more than 2,000 AI agents across functions. KDDI also began a phased move of approximately 9,000 contact center seats to Genesys Cloud, indicating procurement and platform design requirements shaped by data residency, latency control, and orchestration across channels and enterprise systems.
Recent Industry Developments in Contact Center Transformation Market
- June 2026: NICE launched its Workforce Empowerment Suite to manage and govern hybrid operations across human agents and AI agents. The release expands workforce optimization from scheduling and quality into AI-era governance and productivity tooling, supporting enterprises that are scaling automation while retaining compliance-grade controls.
- September 2025: RingCentral acquired CommunityWFM to add cloud-based, AI-first workforce management capabilities into its RingCX portfolio. The deal strengthens RingCentral's position in workforce performance optimization, a key spend area as labor still represents a majority of contact center operating costs.
- October 2024: Amazon Web Services introduced Amazon Connect Forecasting, providing volume and staffing prediction capabilities for contact centers. The feature deepens the native analytics and optimization toolset inside hyperscaler contact center stacks, increasing competitive pressure on standalone workforce and forecasting products.
Contact Center Transformation Market Report Scope and Research Methodology
Market Definition and Coverage
This market captures spending by enterprises to modernize contact center operations through software and related services that enable omnichannel engagement, automation, analytics, and improved agent productivity across on-premise and hosted deployments.
Scope exclusions: It excludes pure third-party contact center outsourcing revenues where the buyer is mainly paying for agents and delivery labor, not transformation software and implementation.
Segments Covered in This Report
- By Type
- Intelligent Call Routing
- Workforce Performance Optimization
- Dialers
- Interactive Voice Response
- Computer Telephony Integration
- Analytics and Reporting
- Consulting and Managed Services
- By Deployment
- On-Premise
- Hosted
- By Organization Size
- Small and Medium Enterprises
- Large Enterprises
- By End-User Industry
- Banking, Financial Services and Insurance
- IT and Telecom
- Media and Entertainment
- Retail and Consumer
- Healthcare
- Other End-User Industries
- By Geography
- North America
- United States
- Canada
- Mexico
- South America
- Brazil
- Argentina
- Rest of South America
- Europe
- United Kingdom
- Germany
- France
- Italy
- Spain
- Russia
- Rest of Europe
- Asia Pacific
- China
- Japan
- India
- South Korea
- Southeast Asia
- Rest of Asia Pacific
- Middle East
- Saudi Arabia
- United Arab Emirates
- Turkey
- Rest of Middle East
- Africa
- South Africa
- Nigeria
- Rest of Africa
- North America
Data Sources, Market Sizing, and Validation
Desk Research
Desk work starts by mapping the demand pool and the main supply categories that typically show up in contact center transformation programs. We review public indicators that explain adoption, such as cloud migration trends and digital customer service usage, and then align them with what solution providers report in filings and product notes.
For grounding, we lean on open sources such as ITU ICT statistics, OECD digital economy indicators, World Bank macro data for spend capacity, and US Census business patterns for establishment and employment context, along with NIST publications and peer-reviewed papers on speech and customer service automation. These are supplemented with company annual reports, earnings call transcripts, investor decks, reputable press, and selective paid subscriptions for company financials and news intelligence, plus patent lookups when product positioning needs clarification. The sources listed here are illustrative, and many other public and paid references were also used to collect data, validate assumptions, and resolve definition questions.
Primary Interviews and Surveys
Primary work is used to pressure-test what the desk inputs imply, especially around what buyers replace or add during a transformation cycle and how budgets are split across software, integration, and ongoing services. We speak with solution leaders, system integrators, managed service specialists, and enterprise users across the Americas, EMEA, and APAC, so the model reflects differences in cloud readiness, channel mix, and contract structures.
Distribution of primary research fieldwork respondents
| Company type | Respondent position | Region |
|---|---|---|
| Top tier: 25% | CXOs: 17% | APAC: 48% |
| Mid tier: 58% | Functional/Unit leaders: 40% | EMEA: 29% |
| Smaller Players: 17% | Managers: 43% | Americas: 23% |
Market-Sizing & Forecasting
Sizing starts with a top-down build where we reconstruct addressable spending by connecting enterprise CX and IT modernization priorities with contact center specific adoption signals, and then translate that into solution and services demand. This is supported by selective bottom-up approximations, such as sampled vendor revenue exposure to contact center stacks and channel checks on typical program sizes, which we use to correct totals when the top line looks overstated or too narrow.
Key inputs include cloud versus on-premise mix in contact centers, the pace of omnichannel rollout (voice, chat, and digital channels), AI and automation penetration in routing and self-service, agent seat and supervisor ratios that influence license and services needs, and implementation and managed services intensity by vertical. Where direct revenue splits are not disclosed, gaps are handled through proxy allocations from product descriptions, customer case references, and interview based ranges, then applied consistently across regions.
For forecasting, we use scenario analysis supported by multivariate regression checks, where drivers like cloud migration pace, customer interaction digitization, and enterprise tech spend cycles are varied and then reviewed with primary experts to pick a realistic base case for the final curve.
Data Validation & Update Cycle
Validation is done through repeated checks across the model. We compare outputs with independent signals like deployment mix shifts, reported software and services growth patterns, and buyer budgeting narratives captured in interviews. If a region or vertical shows a jump that cannot be explained by the selected drivers, we revisit the underlying assumptions and, when needed, trigger follow-up calls for clarification.
Before sign-off, the model is reviewed in multiple steps by an analyst and a second reviewer to confirm scope consistency, math integrity, and currency conversion timing. Reports are refreshed annually, and interim updates are made when material events change adoption or pricing. A final pre-delivery refresh is performed so clients receive the latest updated view.
Mordor Intelligence's Contact Center Transformation Market Size Versus Other Published Estimates
Published market sizes for contact center transformation often vary because firms do not count the same spend items, and they also handle hosted deployments, services intensity, and currency timing differently. Differences also show up when one estimate uses a conservative adoption curve for AI and omnichannel, while another assumes faster replacement of legacy systems.
Outsourcing heavy views can look larger if agent labor is blended into the total, while software focused views can look smaller when implementation and ongoing support are treated as optional add-ons. Pure third-party contact center outsourcing revenues sit outside Mordor Intelligence's scope here, and that single exclusion can move the headline size when sources mix operational delivery with technology transformation.
Benchmark comparison
| Source | Market Size | Gaps in Research Methodology |
|---|---|---|
| Mordor Intelligence | USD 46.07 B (2025) | |
| Trade Journal A | USD 26.11 B (2024) | Often reflects a narrower definition centered on technology upgrades and may undercount multi-year services, migration work, and ongoing optimization tied to hosted contact center deployments. |
| Regional Consultancy B | USD 40.00 B (2024) | Commonly blends broader contact center change programs, which can mix adjacent spend items and use different currency timing or adoption speed assumptions for AI enabled workflows. |
The spread in the table is mainly explained by what is counted as transformation spend and how services and hosting are treated within that spend. By keeping inclusions tied to identifiable software and related services demand signals, and then cross-checking them with interview backed adoption and budget patterns, the estimate stays traceable and repeatable even when public data is uneven.
Key Questions Answered in the Report
How large is the contact center transformation market in 2026?
The market size is USD 53.03 billion in 2026, with a projected rise to USD 98.27 billion by 2031.
What is the expected CAGR through 2031?
The forecast CAGR is 13.13%.
Which region is growing fastest?
Asia Pacific leads with a 14.55% CAGR driven by BPO scale-up and data-localization mandates.
Which deployment model is gaining ground?
Hosted cloud solutions are advancing at a 13.68% CAGR as enterprises favor subscription pricing and rapid rollout.
Why is healthcare a high-growth vertical?
Telehealth expansion and stringent data-security requirements push healthcare to a 13.96% CAGR, integrating electronic health records with contact center workflows.
What drives platform selection among large enterprises?
Compliance depth, global data-center footprint, and embedded analytics heavily influence vendor choice for multi-country rollouts.