
Contact Center Outsourcing Market Size and Share
Market Overview
| Study Period | 2020 - 2031 |
|---|---|
| Market Size (2026) | USD 125.73 Billion |
| Market Size (2031) | USD 189.49 Billion |
| Growth Rate (2026 - 2031) | 8.55% CAGR |
| Fastest Growing Market | Asia Pacific |
| Largest Market | North America |
| Market Concentration | Low |
Major Players *Disclaimer: Major Players sorted in no particular order Image © Mordor Intelligence. Reuse requires attribution under CC BY 4.0. | |
Contact Center Outsourcing Market Analysis by Mordor Intelligence
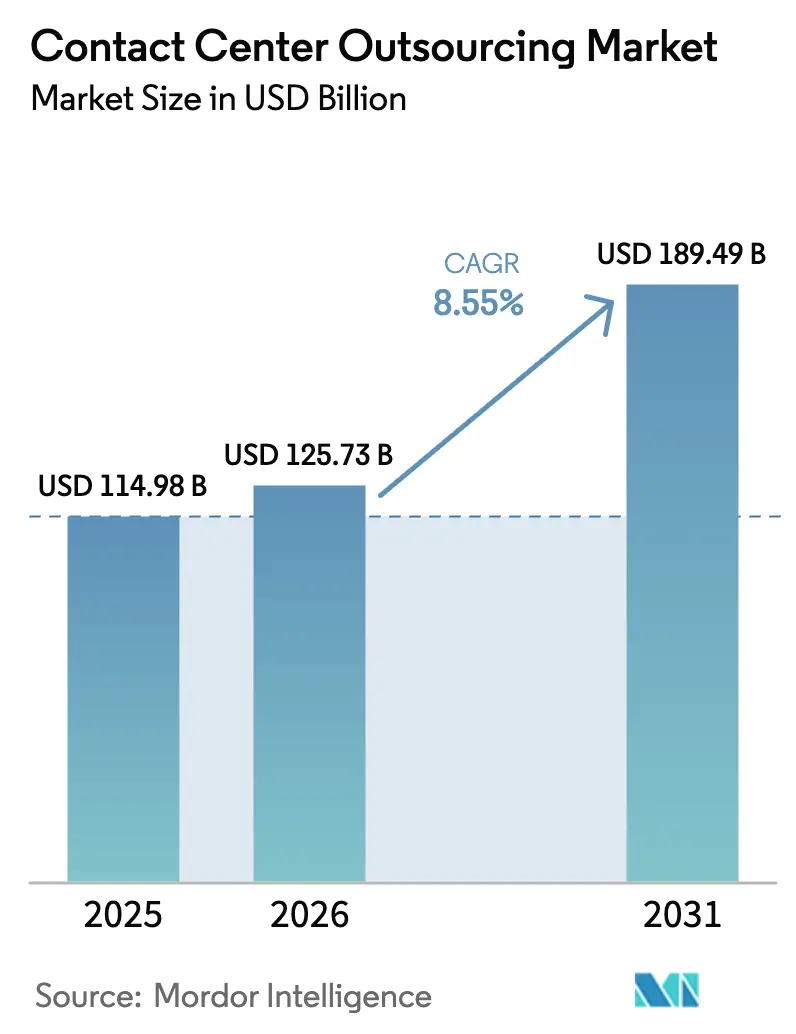
The Contact Center Outsourcing Market size is expected to grow from USD 114.98 billion in 2025 to USD 125.73 billion in 2026 and is forecast to reach USD 189.49 billion by 2031 at 8.55% CAGR over 2026-2031.
Shifting enterprise priorities now favour rapid deployment of cloud-native platforms, generative-AI copilots, and omnichannel orchestration over pure wage-arbitrage models. Vendor selection criteria increasingly center on AI maturity, data-residency compliance, and the ability to spin up multi-language operations on short notice. Buyers also view nearshore capacity in Mexico, Colombia, Poland, and Egypt as a hedge against geopolitical and currency risk, while flexible work-from-home frameworks help providers broaden talent pools and contain real-estate costs. Competitive differentiation rests on bundling proprietary AI layers with CCaaS stacks, offering outcome-based pricing, and demonstrating measurable improvements in customer-experience metrics. Heightened regulatory scrutiny around privacy, cyber resilience, and AI governance adds complexity but also creates opportunities for vendors that turn compliance into a value proposition.
Key Report Takeaways
By service type, voice support led with 44.01% of the contact center outsourcing market share in 2025. Social-media and messaging workloads are forecast to expand at an 8.99% CAGR to 2031.
By end-user industry, BFSI commanded 21.34% revenue share of the contact center outsourcing market size in 2025. Healthcare and life sciences are advancing at an 8.71% CAGR through 2031.
By delivery model, offshore centers retained 56.71% share in 2025, while virtual and remote centers are growing at a 9.04% CAGR to 2031. AI-driven architectures are projected to post the fastest 9.22% CAGR between 2026 and 2031.
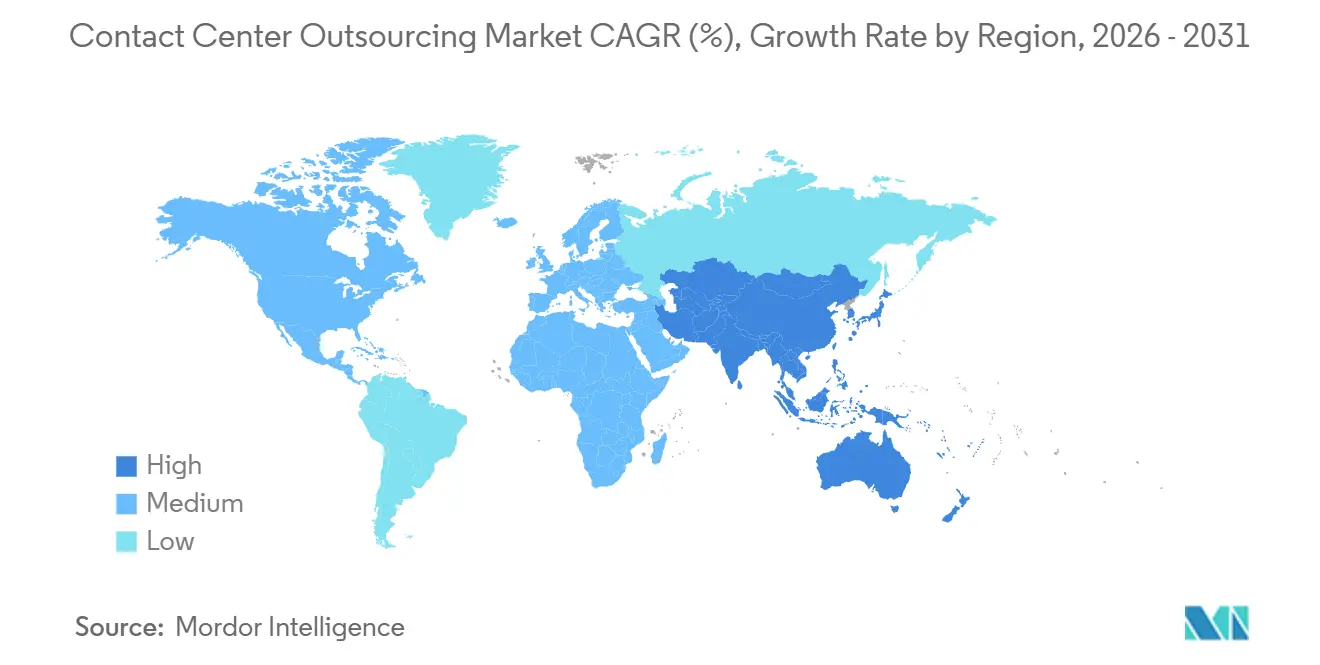
By geography, North America held 37.42% in 2025, whereas Asia Pacific is poised for a 9.12% CAGR through 2031.
Note: Market size and forecast figures in this report are generated using Mordor Intelligence’s proprietary estimation framework, updated with the latest available data and insights as of January 2026.
Global Contact Center Outsourcing Market Trends and Insights
Drivers Impact Analysis*
| Driver | (~) % Impact on CAGR Forecast | Geographic Relevance | Impact Timeline |
|---|---|---|---|
| Cloud Migration and CCaaS Adoption Surge | +1.80% | Global, with early adoption in North America and Western Europe | Medium term (2-4 years) |
| Digital-First Omni-Channel CX Mandates | +1.50% | Global, led by retail and e-commerce sectors in North America, Europe, and Asia Pacific | Short term (≤ 2 years) |
| Post-Pandemic Cost-to-Serve Pressure | +1.20% | Global, particularly acute in North America and Europe | Short term (≤ 2 years) |
| Near-Shore Talent Scalability in N. LATAM and E. Europe | +1.00% | North America sourcing from Mexico and Colombia; Europe sourcing from Poland and Romania | Medium term (2-4 years) |
| Gen-AI Copilots Elevate Agent Productivity | +1.60% | Global, with fastest uptake in BFSI and IT/Telecom sectors | Medium term (2-4 years) |
| Sovereign-Cloud and Data-Residency Incentives | +0.90% | Europe (GDPR), Middle East, China, and regulated sectors globally | Long term (≥ 4 years) |
| Source: Mordor Intelligence | |||
Cloud Migration and CCaaS Adoption Surge
Contact-center-as-a-service platforms provide elastic capacity, seamless CRM integrations, and out-of-the-box AI components, making them the default architecture for new outsourcing contracts. Multi-year on-premises refresh cycles are giving way to subscription models that cut implementation time from months to weeks. Shorter switching costs intensify competition, so providers respond by embedding proprietary analytics, vertical templates, and outcome-based pricing. As a result, the contact center outsourcing market increasingly rewards technology leadership over seat-count scale.[1]Cisco Systems, “Cisco Contact Center Portfolio,” cisco.com
Digital-First Omni-Channel CX Mandates
Consumers expect effortless transitions across chat, email, voice, and social channels, forcing enterprises to collapse siloed systems into unified customer timelines. Vendors offering pre-integrated omnichannel stacks alleviate the heavy lift of multi-year IT programs, securing stickier contracts in retail, e-commerce, and media. Success is judged on first-contact resolution and customer-effort scores, not channel breadth alone. Providers unable to prove quantifiable gains risk relegation to commodity overflow tasks.
Gen-AI Copilots Elevate Agent Productivity
Real-time transcription, sentiment detection, and next-best-action prompts allow junior agents to perform at expert levels, trimming average handle time and boosting upsell conversions. Early adopters report 30-45% efficiency gains, yet results hinge on proprietary training data, rigorous model governance, and continuous retraining. The productivity gap creates a moat for vendors investing in dedicated AI labs and co-development partnerships with hyperscalers.[2]TTEC Holdings, “Remote Contact Center Associate Solutions,” ttec.com
Near-Shore Talent Scalability in Latin America and Eastern Europe
U.S. buyers increasingly favour Mexico and Colombia for time-zone alignment, English proficiency, and rising bilingual talent pools, while Western European firms turn to Poland and Romania for EU-compliant delivery at lower cost. Governments court BPO investments with tax incentives and training grants, making near-shore locations strategic complements to Asian delivery hubs. Providers able to orchestrate multi-country footprints command premium retainers from risk-averse clients.
Restraints Impact Analysis*
| Restraint | (~) % Impact on CAGR Forecast | Geographic Relevance | Impact Timeline |
|---|---|---|---|
| Persistent Data-Sovereignty Regulations | -0.70% | Europe (GDPR), China, Middle East, and regulated sectors globally | Long term (≥ 4 years) |
| Cyber-Security and Privacy Breach Risk | -0.60% | Global, with heightened scrutiny in BFSI and healthcare sectors | Short term (≤ 2 years) |
| Chronic Agent Attrition and Wage Inflation | -0.90% | Global, particularly acute in North America, Western Europe, and urban centers in Asia | Medium term (2-4 years) |
| Gen-AI Bias, Regulatory and Compliance Liabilities | -0.50% | North America, Europe, and regulated industries (BFSI, healthcare, government) | Medium term (2-4 years) |
| Source: Mordor Intelligence | |||
Chronic Agent Attrition and Wage Inflation
Global turnover rates that spiked to near-80% in the immediate post-pandemic period have moderated but remain well above the 30-45% norm, driving up rehiring and training costs. Experienced agents leverage scarcity to negotiate higher pay, squeezing the labour-arbitrage margin that underpinned the first wave of outsourcing. Providers counter with AI-led coaching, flexible scheduling, and career pathways, but these require upfront investment that erodes short-term profitability, especially for thin-margin voice portfolios.
Cyber-Security and Privacy Breach Risk
Contact centers handle payment credentials, health records, and personal data that attract sophisticated cyber threats. Remote-agent models widen the attack surface, while GDPR, HIPAA, and similar statutes expose vendors to penalties up to 4% of global revenue per breach. Zero-trust architectures, continuous monitoring, and mandatory ISO-27001 certification have become table stakes, raising capital intensity. A single breach can trigger clawbacks and brand damage that reverberate across multi-year deals, making cyber resilience a critical differentiator.
*Our forecasts treat driver/restraint impacts as directional, not additive. The impact forecasts reflect baseline growth, mix effects, and variable interactions.
Segment Analysis
By Service Type: Messaging Channels Rise Beside Voice Leadership
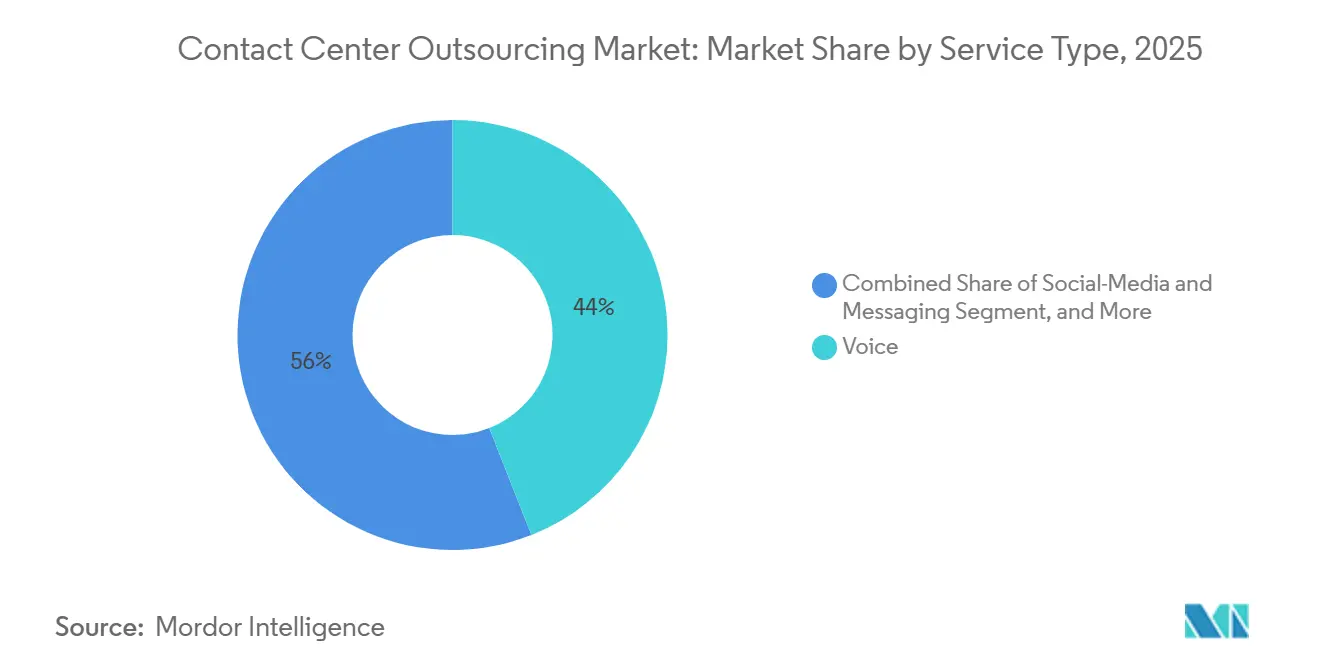
Voice support retained 44.01% of the contact center outsourcing market share in 2025 as complex disputes and high-value sales still favour real-time dialogue. The contact center outsourcing market size linked to social-media and messaging channels, however, is projected to post the fastest 8.99% CAGR to 2031 as digital-native customers embrace asynchronous chat that AI bots can resolve without queuing. Vendors integrate chatbots for tier-1 issues and escalate nuanced cases to human agents, blending cost control with empathy.
Email remains a cost-effective workhorse for non-urgent issues, while emerging video and co-browse use cases flourish in wealth management and telehealth. Providers now package unified agent desktops so staff can pivot among voice, chat, and messaging without losing context, a capability that boosts first-contact resolution and earns premium rates. Those still running siloed service lines struggle to win omnichannel bids.


By End-User Industry: Healthcare Momentum Offsets BFSI Maturity
BFSI commanded 21.34% of 2025 revenue, reflecting its long outsourcing history, stringent compliance needs, and high transaction volumes. Growth decelerates as large banks have already externalized most simple interactions, shifting deals toward niche fraud management and wealth-advisory support. In contrast, healthcare and life sciences are forecast for an 8.71% CAGR through 2031 as telehealth, electronic prior authorization, and patient-engagement mandates generate new outsourcing waves.
Vendors invest in HIPAA-compliant infrastructure and nurse-practitioner talent pools to manage triage, scheduling, and benefits verification, unlocking higher margins than voice-only BFSI work. Retail, e-commerce, and technology remain sizeable but competitive, encouraging providers to differentiate through AI-assisted sales enablement and data-driven personalization.
By Delivery Model: Virtual Frameworks Challenge Offshore Dominance
Offshore sites in India, the Philippines, and Egypt still held 56.71% of 2025 volume. Yet secure virtual-agent ecosystems are expanding at a 9.04% CAGR, enabling providers to recruit from previously untapped labour pools, including veterans and caregivers.
Work-from-home arrangements cut facility overhead, improve schedule adherence, and widen diversity, but demand sophisticated endpoint security and performance analytics. Nearshore hubs in Mexico, Colombia, Poland, and Romania attract clients seeking cultural affinity and faster issue escalation, while onshore centers cater to regulated verticals. Vendors able to blend onshore, nearshore, offshore, and virtual nodes into a single contract win larger, multi-year deals.
By Deployment Model: AI-Driven Architectures Redefine Infrastructure
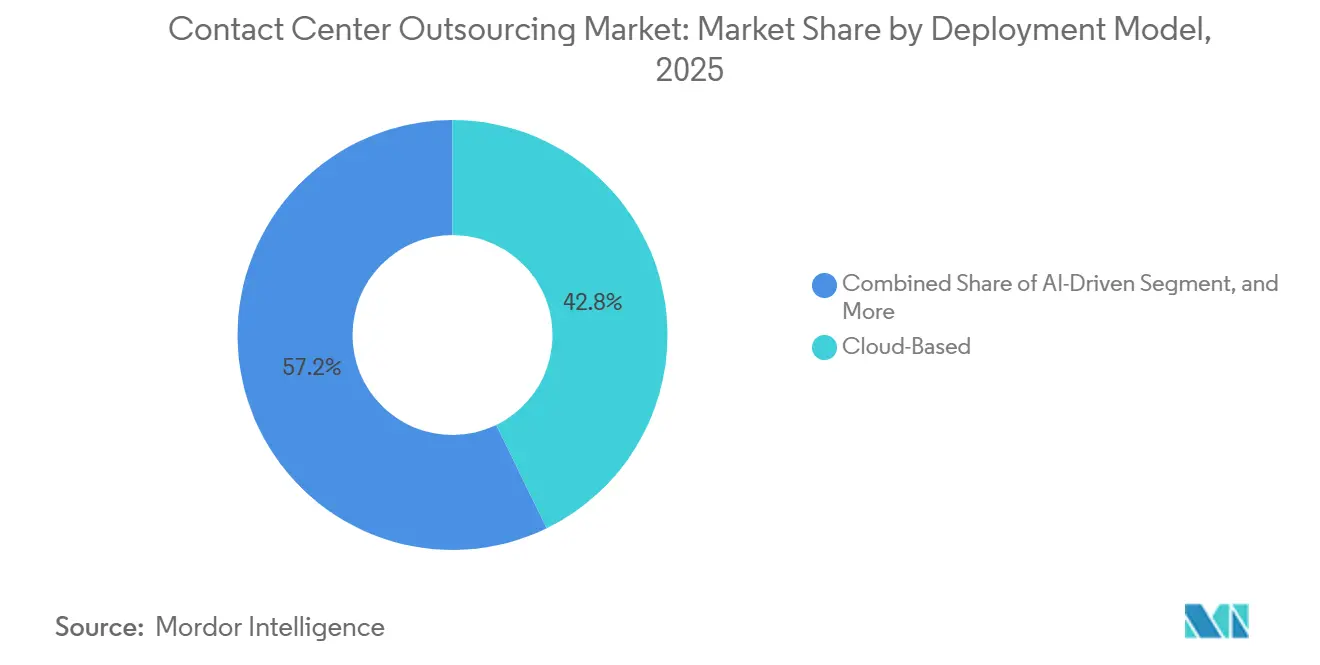
In 2025, cloud deployments accounted for 42.78% of the market, showcasing their adaptability and smooth integration with CRM and workforce management systems. The scalability and cost-efficiency of cloud solutions have made them a preferred choice for businesses aiming to streamline operations and enhance flexibility. Meanwhile, hybrid setups cater to clients hesitant to fully transition from their aging on-premises assets, albeit at the cost of added governance complexities. These hybrid models allow organizations to leverage the benefits of cloud technology while maintaining control over critical legacy systems, ensuring a balanced approach to modernization.
AI-driven centers, which incorporate features like real-time transcription and predictive routing, are projected to achieve a 9.22% CAGR through 2031, positioning them as the industry's fastest-growing deployment model. These centers are transforming customer service operations by enabling faster issue resolution and personalized customer interactions. Providers are strategically placing their proprietary AI layers as tools for revenue sharing, opting to charge clients based on the cost per resolved ticket. This approach, diverging from traditional seat-hour billing, has garnered favor among CFOs who prioritize alignment with tangible outcomes. The shift toward outcome-based pricing models reflects a broader trend in the industry, emphasizing efficiency and measurable results over conventional metrics.
By Interaction Flow: Omnichannel Complexity Fuels Outsourcing Appeal
Inbound calls, holding steady at 62.39%, face a plateau as self-service tools increasingly handle simpler queries. This shift reflects the growing adoption of automation and AI-driven solutions, which streamline customer interactions by addressing routine concerns without human intervention. Meanwhile, omnichannel interactions are poised to grow at a 9.61% CAGR, driven by consumers' desire for context continuity across chat, email, voice, and social platforms. Customers now expect seamless transitions between channels, with their interaction history readily accessible to ensure personalized and efficient service.
Competitive proposals now hinge on unified routing engines, knowledge graphs, and sentiment analytics. These technologies enable businesses to optimize customer journeys by providing real-time insights and predictive capabilities. Providers lacking the ability to offer a comprehensive view of cross-channel journeys risk relegation to overflow voice queues, grappling with diminishing margins. As the market evolves, the ability to deliver single-pane visibility and actionable insights across all touchpoints is becoming a critical differentiator for sustained growth and profitability.
Geography Analysis
North America generated 37.42% of 2025 revenue, anchored by mature BFSI, healthcare, and technology buyers that insist on multi-site redundancy, ISO certifications, and AI-supported quality assurance. Wage inflation and high turnover encourage nearshoring to Mexico and Colombia, both offering bilingual talent and overlapping time zones. Vendors that weave those nodes into existing Philippine and Indian networks mitigate currency and political risk while accelerating contract wins.
Europe presents a mixed landscape: GDPR drives in-country delivery in Germany and France, whereas nearshore hubs in Poland and Romania satisfy language and compliance needs for U.K. and Nordic buyers at lower cost. Regional cloud-sovereignty initiatives spur investments in local data centers, favouring providers with capital to build or lease secure infrastructure.
Asia Pacific posts the fastest 9.12% CAGR to 2031. India and the Philippines retain scale leadership, adding AI labs and vertical domain academies to defend share. Emerging ASEAN markets such as Vietnam, Thailand, and Malaysia are pulling pilot projects but grapple with infrastructure gaps. China’s vast domestic opportunity remains largely closed to foreign vendors, yet multinational clients seek Mandarin support from offshore Thailand and Malaysia operations, hedging geopolitical exposure.
Middle East and Africa grow off a smaller base. Egypt stands out with large-scale trilingual talent and pro-BPO incentives. Concentrix, Foundever, and Alorica have each commissioned multithousand-seat Cairo campuses, citing cost parity with major Indian metros and three-hour proximity to European capitals. South Africa services U.K. and Australian accounts, though power-grid instability limits round-the-clock reliability. Gulf Cooperation Council countries outsource selective citizen-services but often require onshore hosting within national borders.[3]David Gomez, “Colombia vs Mexico for Nearshore Technology Outsourcing,” Alcor, alcor-bpo.com
South America beyond Colombia sees Brazil commanding Portuguese programs for regional banks and e-commerce giants, while Chile and Guatemala court specialized Spanish contact flows. Macroeconomic volatility prompts clients to diversify among at least two Latin American sites, a trend favouring networked providers over single-country specialists.

Regulatory Landscape
Privacy, cybersecurity, and cross-border data-transfer rules shape outsourcing delivery decisions because contact centers process personal data, payment credentials, and regulated records. In regulated industries, buyers often require controls mapped to GDPR in Europe and HIPAA/PCI-DSS obligations for healthcare and payments, and many RFPs reference formal service and security standards to evidence process discipline and auditability.
Regulatory attention on where calls are handled intensified in the telecom vertical in 2026. In April 2026, the US Federal Communications Commission published a Notice of Proposed Rulemaking in CG Docket No. 26-52 proposing restrictions tied to foreign call center use by telecommunications and related providers. The draft includes requirements such as customer notification, transfer options to US-based centers on request, and tighter handling expectations for sensitive data. Standards activity also feeds procurement, including ISO/IEC updates to the 30105 ITES-BPO lifecycle series (2024 edition) and China’s GB/Z 42749.7-2025 maturity assessment example for ITES-BPO providers (implemented in 2025), which can be used as benchmarking frameworks in vendor qualification and ongoing governance.
Value Chain Analysis
The value chain starts with enterprise demand owners (BFSI, healthcare, retail, IT/telecom, and public sector) setting CX outcomes, compliance requirements, and the channel mix (voice, email, chat, social/messaging, and self-service). Outsourcing providers then build delivery programs around labor sourcing and training, workforce management, quality monitoring, and security, supported by CCaaS stacks and adjacent tooling such as CRM, knowledge bases, analytics, and AI copilots. Hyperscalers and CCaaS vendors (for example, platform providers commonly bundled in managed deals) supply core cloud runtime and contact routing capabilities, while specialist partners contribute speech analytics, fraud controls, and automation components.
Service delivery typically runs across a blended network of onshore, nearshore, offshore, and virtual/remote nodes, with growing emphasis on data-residency and cyber controls. Offshore hubs in India and the Philippines remain central for scale, while nearshore locations (Mexico, Colombia, Poland, Romania, and Egypt) support time-zone and language alignment and risk diversification. Contracting and monetization are shifting from seat-based billing to outcome-based constructs as AI handles more routine interactions, which pushes providers to invest in proprietary AI layers, domain playbooks, and compliance operations (ISO-aligned security management, zero-trust for remote agents, and auditable controls) as key value-adding links in the chain.
Competitive Landscape
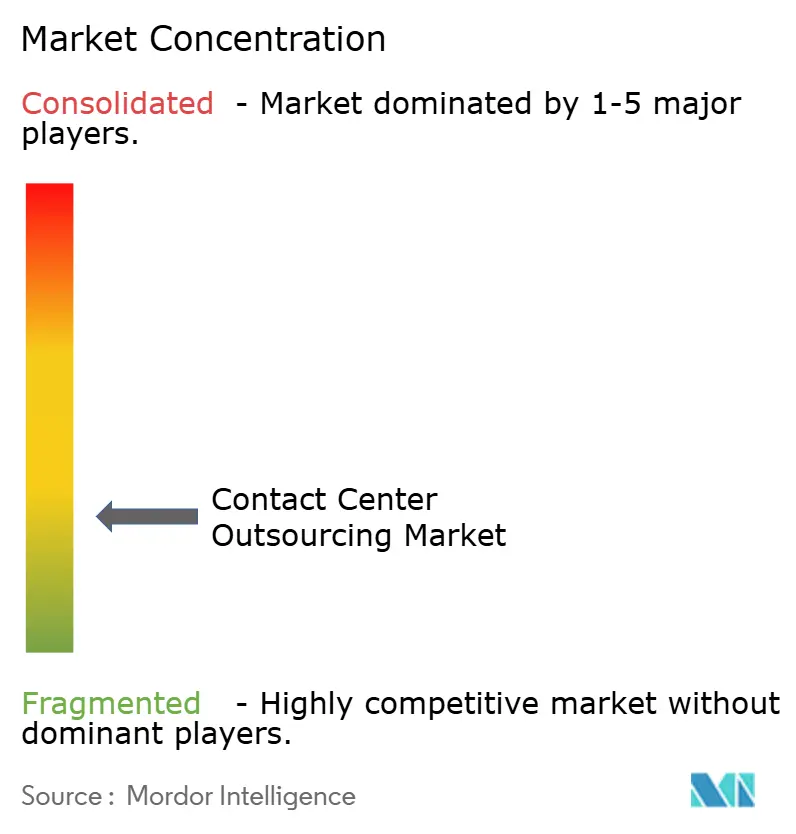
Market concentration is Low, with the top five firms holding about 38% of global billings. Teleperformance merged with Majorel to unlock technology and training synergies, while Concentrix’s acquisition of SAI Digital added consulting depth that elevates its seat-based model into transformation advisory. Foundever and Alorica pursue industry specialization and analytics-led upsell, whereas TTEC leans on its work-from-home platform for hyper-scalable retail peak management. Smaller disruptors such as TaskUs (gaming, fintech) and Firstsource (healthcare revenue-cycle) defend niches through domain certification and proprietary workflows.
Partnership ecosystems blur the line between software and services. Providers bundle CCaaS licenses from Five9, Genesys, and NICE with managed agents, positioning as end-to-end CX partners. Investments in proprietary AI studios, zero-trust security stacks, and cyber-insurance coverage become prerequisites for Fortune 500 RFP shortlists. Vendors lacking capital for these upgrades face relegation to subcontract roles.
Strategic bifurcation is apparent: global integrators chase breadth across geographies, languages, and verticals, while specialists double down on depth compliance mastery, unique data sets, and outcome-based SLA frameworks. Clients increasingly split portfolios, sending commoditized volumes to mega-vendors and reserving complex or regulated work for niche experts.
Contact Center Outsourcing Industry Leaders
Atento S.A
Sykes Enterprises, Incorporated
DATAMARK Inc.
Teleperformance, SA
Concentrix Corp.
- *Disclaimer: Major Players sorted in no particular order

Market Opportunities and Future Outlook
An opportunity area is emerging at the intersection of telecom-grade CX modernization and AI-enabled operating models, where enterprises combine application modernization, cloud migration, and contact center transformation to shorten change cycles and strengthen agent tooling. One signal of this convergence is DXC Technology completing a cloud migration for Telenor Sweden (reported in May 2026), supporting 500 concurrent specialists and about 300,000 monthly calls. It points to how modernization programs can expand capacity while improving operating agility.
This opens whitespace for outsourcers and managed-service providers that can integrate CCaaS, CRM, and data platforms with AI copilots, and then structure contracts around business outcomes such as first-contact resolution or cost per resolved ticket. Another opportunity is the reconfiguration of delivery footprints in response to data-residency constraints and emerging onshoring pressure in telecom. The FCC’s April 2026 NPRM (CG Docket No. 26-52) raises the value of compliant US-based or US-adjacent capacity and governance models that demonstrate tight control over sensitive data handling. Providers that can orchestrate multi-country delivery (onshore plus nearshore nodes such as Mexico, Colombia, or US territories) while maintaining auditable security and industry controls can address buyer concerns without reverting to single-location dependency. The market is also expanding into hybrid models where providers sell technology-enabled CX capabilities to clients operating in-house, consistent with Atento’s June 2026 expansion of its technology offerings beyond traditional outsourced BTO.
Recent Industry Developments
- July 2026: Teleperformance Philippines announced an expansion in Pasay City with a 29th site at the Four E-Com Center Building, adding over 1,000 jobs following Philippine Economic Zone Authority (PEZA) approval dated June 29, 2026. The expansion increases delivery capacity in a core offshore market and supports scale-up needs for multilingual and omnichannel programs.
- May 2026: Atento signed a multi-year, eight-figure partnership with Cresta to integrate agentic AI capabilities into its Atent.AI platform across the United States and Latin America. This supports hybrid human-AI delivery models and strengthens differentiation around productivity tooling and consistent quality at distributed sites.
- November 2024: Teleperformance strengthened its Specialized Services portfolio through the strategic acquisition of ZP Better Together, a provider focused on services for the deaf and hard-of-hearing community. The transaction broadens vertical specialization and supports higher-value programs where accessibility requirements and specialized language capabilities influence vendor selection.


Research Methodology Framework and Report Scope
Market Definition and Coverage
We define this market as the annual revenue earned by third party providers that deliver outsourced contact center operations for client organizations across voice and digital channels.
Scope exclusions: We exclude in-house captive contact centers and standalone contact center software licensing revenues.
Segmentation Overview
- By Service Type
- Voice (On-Shore)
- Voice (Off-Shore)
- Email Support
- Chat / Live-Chat Support
- Social-Media and Messaging
- Video and Co-Browse Support
- Self-Service / Bots
- By End-User Industry
- BFSI
- Retail and E-Commerce
- Healthcare and Life Sciences
- IT and Telecom
- Government and Public Sector
- Travel and Hospitality
- Utilities and Energy
- Media and Entertainment
- By Delivery Model (Location)
- On-Shore Outsourcing
- Near-Shore Outsourcing
- Off-Shore Outsourcing
- Virtual / Remote Contact Centers
- By Deployment Model (Technology)
- Cloud-Based Contact Centers
- On-Premise Contact Centers
- Hybrid Contact Centers
- AI-Driven Contact Centers
- By Interaction Flow
- Inbound Services
- Outbound Services
- Omnichannel Communication
- Self-Service and Automation
- By Geography
- North America
- United States
- Canada
- Mexico
- South America
- Brazil
- Colombia
- Europe
- United Kingdom
- Germany
- France
- Spain
- Italy
- Russia
- Asia Pacific
- China
- India
- Japan
- South Korea
- ASEAN
- Rest of Asia Pacific
- Middle East
- Turkey
- UAE
- Saudi Arabia
- Africa
- South Africa
- Rest of Africa
- North America
Data Sources, Market Sizing, and Validation
Desk Research
Desk research was used to set clear market boundaries and to size the demand pool by region and end-user activity before building the model. We referenced public sources such as the US Bureau of Labor Statistics, Eurostat, the World Bank, OECD datasets, and ITU indicators to understand service employment trends, wage direction, and connectivity readiness that influence delivery location choices.
We also reviewed company filings and investor presentations to map revenue mix between customer care, technical support, and adjacent business process services. Reputable press and association websites were used to cross-check outsourcing adoption themes. For grounding assumptions like wage inflation and location expansion, we supplemented with paid subscriptions focused on company financials and news, and with an import-export shipment-level database where relevant for delivery footprint signals. These desk research sources are illustrative only, and many other public documents and datasets were also referenced for data collection, validation, and clarification.
Primary Interviews and Surveys
Primary work focused on checking what is billed inside outsourced contact center contracts, and how pricing shifts as buyers move from voice to chat, email, and social interactions. We spoke with provider side leaders and operations managers, and with procurement or customer experience owners on the buyer side across major regions, so gaps in service scope, location mix, and utilization assumptions could be corrected before finalizing the model.
Distribution of primary research fieldwork respondents
| Company type | Respondent position | Region |
|---|---|---|
| Top tier: 28% | CXOs: 17% | APAC: 46% |
| Mid tier: 50% | Functional/Unit leaders: 28% | EMEA: 35% |
| Smaller Players: 22% | Managers: 55% | Americas: 19% |
Market-Sizing & Forecasting
The model starts with a top-down demand pool build where addressable customer contact volumes and outsourcing penetration are translated into service spend by region and major end-user groups. To keep totals realistic, we corroborated the result with selective bottom-up checks such as sampled pricing per agent seat and per interaction, typical channel mix by program type, and supplier revenue splits visible in public materials.
Key inputs used in the sizing include outsourced agent headcount capacity by delivery location, average monthly price per FTE seat, non-voice share of interactions (which shifts staffing and billing), utilization and attrition patterns that influence productive hours, and wage inflation trends in common delivery countries. Where direct data was thin for smaller countries, we used proxy indicators like service employment growth and contact volume intensity by sector, and then adjusted with interview feedback.
For forecasting, we relied on scenario analysis supported by a light multivariate regression on drivers like service sector growth, labor cost inflation, and digital channel adoption, and then refined the path using primary feedback on contract renewal cycles and pricing reset frequency. This keeps the forecast explainable on a client call and avoids forcing a fully bottom-up roll-up that is hard to reproduce at global scale.
Data Validation & Update Cycle
Validation was done through stepwise checks, first by matching regional outputs to independent signals like outsourcing adoption commentary, labor availability, and wage movements, and then by reviewing outliers in implied pricing per seat and per interaction. When a variance could not be explained by channel mix or delivery location mix, we rechecked the scope definition and re-contacted relevant experts to confirm what was included in contract value.
Before sign-off, the model and assumptions are reviewed by another analyst, followed by a final pass to ensure definitions, currency timing, and growth logic stay consistent across chapters. Reports are refreshed annually, and interim updates are made when material events meaningfully change demand, delivery capacity, or pricing. Just before delivery, an analyst performs a fresh review so clients receive the latest updated view.
Mordor Intelligence's Contact Center Outsourcing Market Size Measured Against Other Published Estimates
Published market sizes for outsourced contact centers often differ because the service boundary and the billing basis are not treated the same way, even when the topic labels look similar. In some cases, totals move simply because a source includes captive operations, or it counts software license spend alongside outsourced service revenue.
By tracking billing units and channel mix shifts and refreshing currency timing assumptions, Mordor Intelligence keeps the total aligned to third party contact center service revenue across voice and digital interactions, with captive centers and standalone CCaaS licenses kept outside scope.
Benchmark comparison
| Source | Market Size | Gaps in Research Methodology |
|---|---|---|
| Mordor Intelligence | USD 125.73 B (2026) | |
| Industry Research House A | USD 92.50 B (2024) | The estimate appears to focus on call center outsourcing with a different base year, which can undercount chat, email, and social programs that are billed beyond classic voice seat pricing. |
| Syndicated Publisher B | USD 93.30 B (2025) | The forecast implies slower pricing progression and a narrower service inclusion, especially if outcome-linked bundles and non-voice interaction billing are not fully reflected year to year. |
The comparison indicates that most variance comes from what is included as outsourced service revenue and how pricing and channel change are carried through the forecast years. Our sizing stays traceable to repeatable drivers such as outsourced capacity, utilization, channel mix, and price per billing unit, which makes the final number easier to validate and update over time.


Key Questions Answered in the Report
How large is the contact center outsourcing market today?
The contact center outsourcing market size reached USD 125.73 billion in 2026 and is projected to climb to USD 189.49 billion by 2031.
Which customer-support channel is growing the fastest?
Social-media and messaging workloads are forecast to expand at an 8.99% CAGR through 2031 as consumers favor asynchronous digital engagement.
Why are healthcare organizations increasing outsourcing?
Telehealth growth, patient-engagement mandates, and back-office complexity drive an 8.71% CAGR for healthcare and life-sciences outsourcing demand.
What delivery model is disrupting traditional offshore centers?
Secure virtual and remote contact centers are growing at a 9.04% CAGR, letting providers tap wider talent pools without investing in brick-and-mortar sites.
How are vendors differentiating beyond labor cost?
Providers bundle proprietary AI layers with CCaaS platforms, offer outcome-based pricing, and invest in zero-trust security to meet stringent compliance requirements.
Which regions show the highest growth potential?
Asia Pacific leads with a 9.12% CAGR to 2031, fueled by continued investments in AI-enabled capacity across India and the Philippines.
Page last updated on:


