Market Overview
| Study Period | 2019 - 2031 |
|---|---|
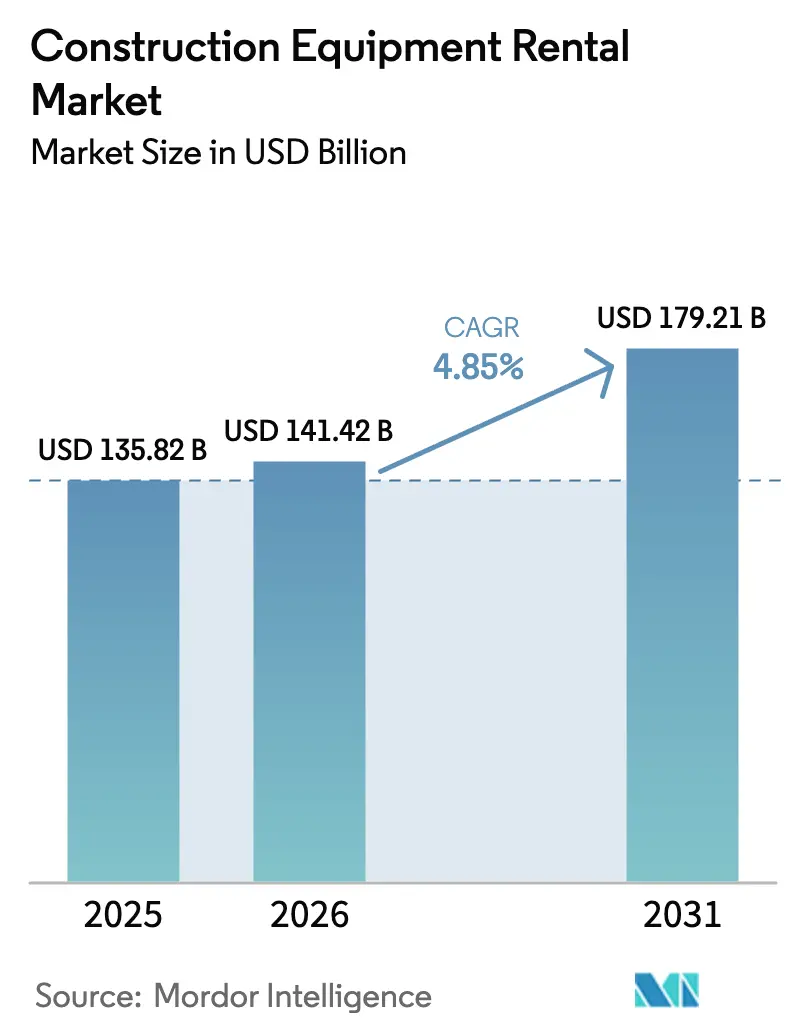
| Market Size (2026) | USD 141.42 Billion |
| Market Size (2031) | USD 179.21 Billion |
| Growth Rate (2026 - 2031) | 4.85% CAGR |
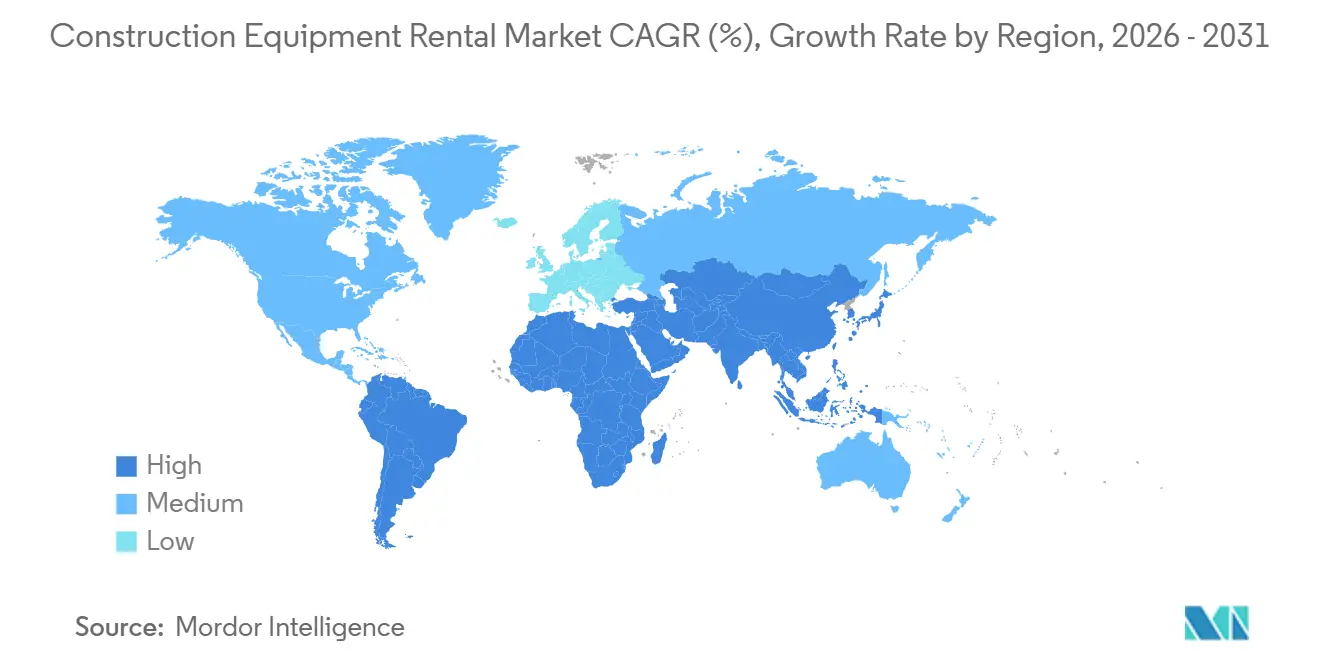
| Fastest Growing Market | Middle East and Africa |
| Largest Market | Asia Pacific |
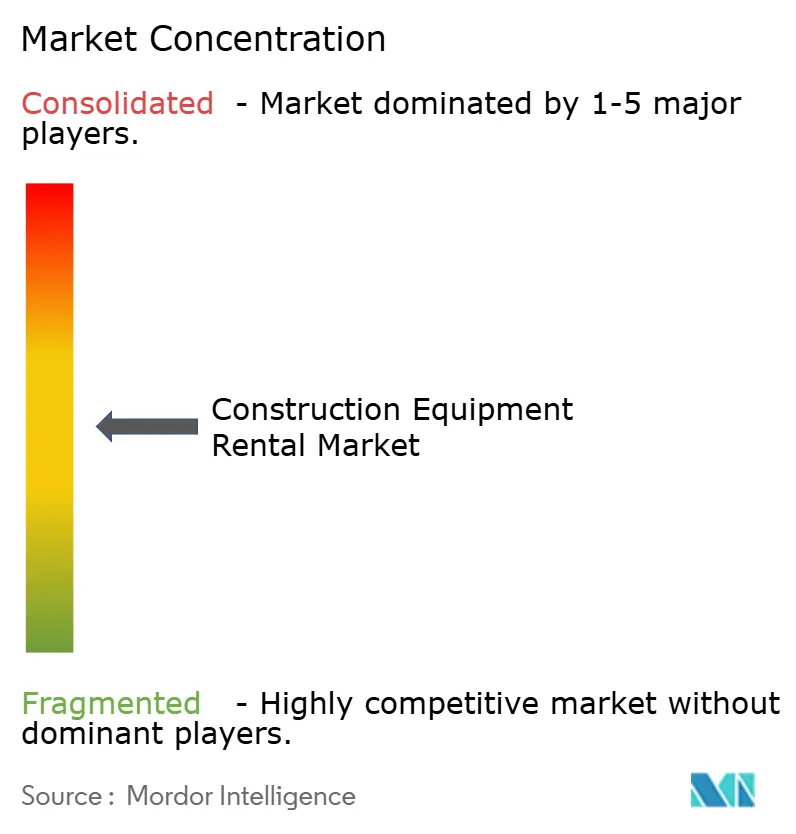
| Market Concentration | Medium |
Major Players *Disclaimer: Major Players sorted in no particular order Image © Mordor Intelligence. Reuse requires attribution under CC BY 4.0. | |
Construction Equipment Rental Market Analysis by Mordor Intelligence
The construction equipment rental market size is projected to be USD 135.82 billion in 2025, USD 141.42 billion in 2026, and reach USD 179.21 billion by 2031, growing at a CAGR of 4.85% from 2026 to 2031. Contractors are shifting from ownership to rentals to conserve cash for labor and materials, while sovereign infrastructure pipelines in the Asia-Pacific and the Middle East provide multi-year demand visibility, encouraging rental operators to lock in medium-term contracts. The United States Infrastructure Investment and Jobs Act directed a significant amount to more than 60,000 projects through 2024, favoring rental models because they avoid residual-value risk. China’s issuance of local-government infrastructure bonds during 2024 similarly channels capital into transport corridors that suit flexible rental fleets. Add to this the ongoing ESG regulations and the rapid spread of digital marketplaces, and the growth trajectory for the construction equipment rental market appears firmly supported by both policy and technological levers.
Key Report Takeaways
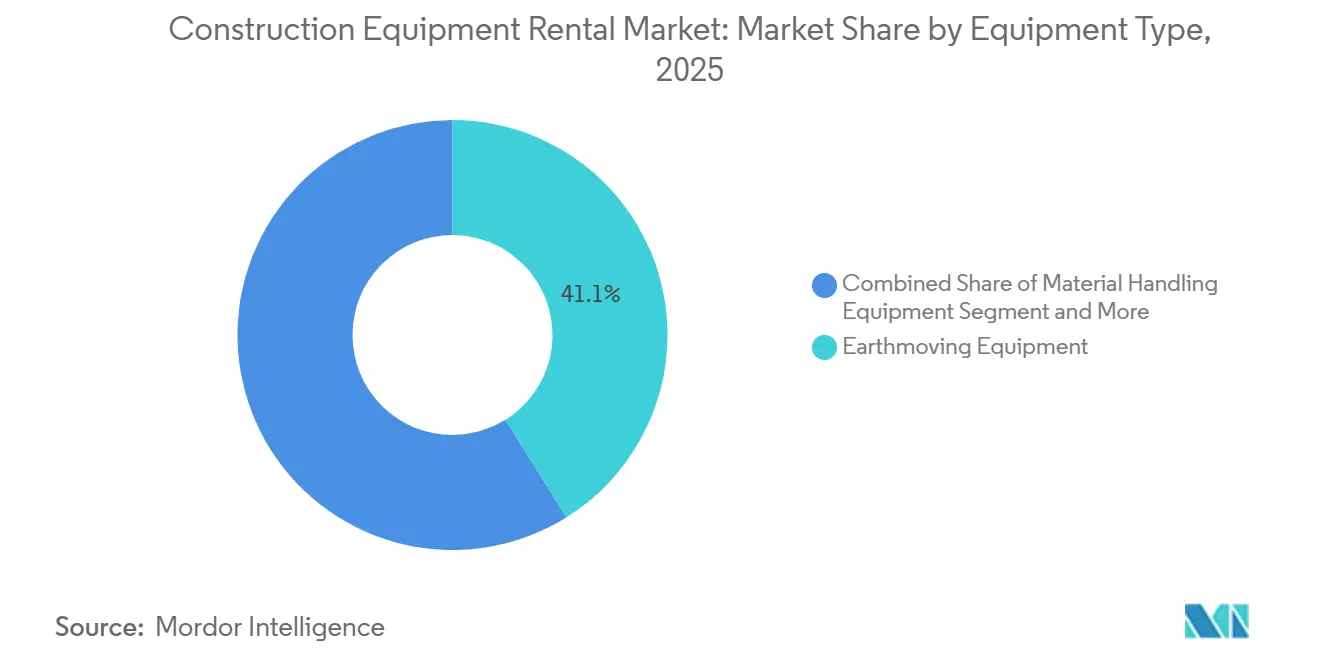
- By equipment type, earthmoving commanded 41.05% of the construction equipment rental market share in 2025 and is set to outpace the overall market with a 7.61% CAGR through 2031.
- By drive type, IC-engine machines dominated the mix with 86.13% in 2025, yet hydrogen fuel-cell models are scaling at a brisk 15.88% CAGR through 2031.
- By application, infrastructure projects accounted for 36.24% of revenue in 2025, while mining and quarrying were the fastest-growing sectors at a 5.94% CAGR through 2031.
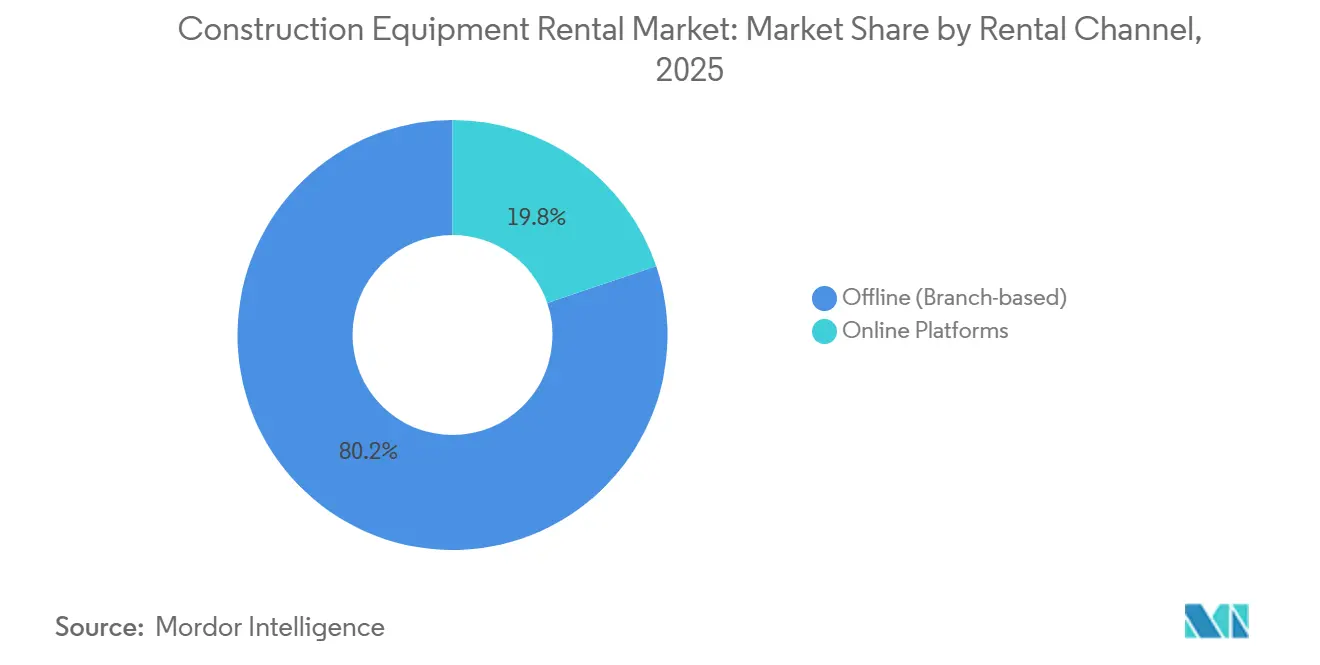
- By rental channel, offline branches captured an 80.22% share in 2025; online platforms showed the quickest rise, advancing at a 9.84% CAGR to 2031.
- By service type, medium-term rentals (1–12 months) accounted for 48.26% of the construction equipment rental market in 2025; however, short-term rentals (<1 month) are expected to grow at a 7.13% CAGR through 2031.
- By geography, Asia-Pacific held a 40.11% share in 2025, while the Middle East and Africa will advance at a 6.72% CAGR by 2031.
Note: Market size and forecast figures in this report are generated using Mordor Intelligence’s proprietary estimation framework, updated with the latest available data and insights as of January 2026.
Global Construction Equipment Rental Market Trends and Insights
Drivers Impact Analysis*
| Driver | (~) % Impact on CAGR Forecast | Geographic Relevance | Impact Timeline |
|---|---|---|---|
| Infrastructure Stimulus Megaproject Pipeline | +1.2% | Global, high in Asia-Pacific, the Middle East, and Africa | Long term (≥ 4 years) |
| Contractors Shifting Capex to Opex | +0.9% | North America and Europe, expanding to the Asia-Pacific | Medium term (2-4 years) |
| ESG Targets Driving Electric Rentals | +0.7% | Europe, California, urban Asia-Pacific | Medium term (2-4 years) |
| Digital Rental-Platform Growth | +0.6% | Asia-Pacific core, spill-over to the Middle East, Africa, and South America | Short term (≤ 2 years) |
| Outcome Based Usage Contracting Models | +0.5% | North America, early adoption in Europe | Short term (≤ 2 years) |
| Data Driven Fleet Optimization | +0.4% | Global, led by North America and Europe | Medium term (2-4 years) |
| Source: Mordor Intelligence | |||
Infrastructure-Stimulus Megaproject Pipeline
Large public spending programs turn speculative demand into firm, multi-year rental contracts. The United States has already committed significant investment to over 60,000 infrastructure projects under the Infrastructure Investment and Jobs Act. In 2024, China significantly increased its deployment of provincial bonds, focusing primarily on transport corridors and urban renewal projects. India budgeted INR 11.11 lakh crore (USD 133 billion) for infrastructure in fiscal 2024-25 [1]“National Infrastructure Pipeline,” Ministry of Finance, India, indiabudget.gov.in . Saudi Arabia’s Vision 2030 includes multiple giga-projects (e.g., NEOM, Qiddiya) that are sustaining construction demand and equipment utilization. Preliminary damage assessments for Türkiye indicate needs above USD 100 billion, supporting sustained reconstruction activity. These pipelines feed directly into medium-term rentals, already generating notable revenue.
Shift from CAPEX-to-OPEX Among Contractors
In a bid to preserve liquidity, construction firms are increasingly turning to rentals instead of relying on owned fleets. United Rentals maintained a significant annual capex program in 2024, with a focus on minority-financing specialty and electric assets for rental purposes. Sunbelt Rentals committed substantial resources in fiscal 2025 for fleet expansion, simultaneously inaugurating numerous new outlets across the United States. Herc Rentals, in 2024, enhanced its fleet value significantly, honing in on specialty niches. As tighter credit markets emerge in North America and Europe, there's a noticeable shift towards operating leases over capital purchases. This financial strategy is now being rolled out to contractors in the Asia-Pacific region.
Stringent ESG Targets Accelerating Electric Rentals
Rental agencies, driven by environmental mandates, are electrifying their inventories even before contractors demand it. California has identified several models of zero-emission equipment. Boels has set a long-term target to transition the majority of its fleet to electric. Sunbelt reports that a growing portion of its clients are now willing to pay a premium for zero-emission equipment. Volvo’s L120 and L90 electric loaders deliver diesel-parity performance without tailpipe emissions[2]“L120 Electric Loader Factsheet,” Volvo Construction Equipment, volvoce.com . Europe and California anchor this trend, which is spreading into Asian megacities adopting low-emission zones.
Digital Rental-Platform Explosion in Emerging Markets
Online marketplaces are reducing discovery times and improving equipment utilization. EquipmentShare, which operates numerous sites, uses its T3 platform to provide real-time utilization and maintenance alerts. United Rentals enhances asset efficiency through its Total Control portal, which integrates booking, invoicing, and predictive maintenance. Digital channels are growing significantly faster than the overall market, driven by their convenience and efficiency. In the Asia-Pacific region, where branch networks are limited, there is a strong preference for app-based ordering. Consequently, rental firms are making substantial investments in user-friendly interfaces and telematics to meet the needs of a younger, digitally-savvy customer base.
Restraints Impact Analysis*
| Restraint | (~) % Impact on CAGR Forecast | Geographic Relevance | Impact Timeline |
|---|---|---|---|
| Skilled Operator Scarcity | −0.8% | North America and Europe, emerging in Asia-Pacific | Long term (≥ 4 years) |
| Multi-Brand Maintenance Complexity | −0.6% | Global, acute in fragmented European fleets | Medium term (2-4 years) |
| Direct Rental Market Cannibalization | −0.5% | North America and Europe, expanding to Asia-Pacific | Medium term (2-4 years) |
| Residual Value Volatility for Lithium | −0.3% | Europe and California | Long term (≥ 4 years) |
| Source: Mordor Intelligence | |||
Skilled-Operator Scarcity Elevates Downtime Risk
Rental equipment often sits idle because trained operators are unavailable when demand surges. In 2026, the U.S. Bureau of Labor Statistics projects continued annual openings for construction equipment operators over the next decade, driven mainly by replacement needs. This gap becomes more pronounced during peak construction months, as retirements outpace new certifications. Similar shortages are also evident in Germany and Japan, where aging workforces drive up wage premiums and lengthen recruitment cycles, thereby inflating project costs and extending schedules. Rental firms attempt to mitigate the risk by bundling operator training into contracts and partnering with vocational schools; however, class backlogs still mean contractors wait weeks for certified personnel. Idle machinery erodes utilization metrics, forcing rental companies to maintain larger fleets to meet service-level guarantees, thereby tying up capital that could be used to fund electrification or digital upgrades. Unless training pipelines expand materially, operator scarcity will continue to depress adequate fleet availability and place downward pressure on rental margins through at least the medium term.
High Multi-Brand Maintenance Complexity
Rental fleets include Caterpillar, Komatsu, Volvo, and JCB, each with its own proprietary diagnostics. Trackunit and similar telematics can cut unplanned downtime, yet full integration remains elusive. Cross-trained technicians are scarce, especially in Europe, where fleets draw from many OEMs and operations cross borders. Rental firms incur higher service costs to maintain the brand diversity that clients demand. Until unified diagnostics gain traction, maintenance complexity continues to weigh on profitability.
*Our forecasts treat driver/restraint impacts as directional, not additive. The impact forecasts reflect baseline growth, mix effects, and variable interactions.
Segment Analysis
By Equipment Type: Earthmoving Dominates Infrastructure Buildout
Earthmoving equipment secured 41.05% of the construction equipment rental market share in 2025, and its 7.61% CAGR through 2031 exceeds the overall market pace. Excavators, loaders, and bulldozers remain indispensable for road, rail, and mining projects. Backhoe loaders serve utilities and residential work where versatility matters. Excavators, especially tracked units, lead demand for heavy soil removal, while wheeled variants gain ground in urban sites where mobility is prized.
Material-handling gear forms the next-largest slice, driven by cranes and telehandlers used in high-rise and logistics developments. Concrete and road machinery rise with highway spending, and power equipment—such as generators and compressors—meets intermittent site needs. Telematics-enabled earthmovers differentiate rental fleets on uptime rather than price, reinforcing their central role in the construction equipment rental market.


By Drive Type: Hydrogen Fuel Cells Emerge From Niche
Internal Combustion (IC) engine machines accounted for 86.13% of the mix in 2025, as diesel refueling networks remain ubiquitous. Hybrid models blend diesel and electric to navigate low-emission zones. Battery electric equipment gains momentum, helped by a significant number of zero-emission models listed in California.
Hydrogen fuel-cell units, such as Hyundai’s HW155H excavator unveiled at Bauma 2025, are growing at a 15.88% CAGR by 2031 and attract projects that need zero emissions without battery-range limits. JCB’s hydrogen-combustion engines offer a drop-in diesel alternative. IC dominance will persist this decade; however, regulatory pressure and falling total cost of ownership will tilt the longer-term curve toward electric and hydrogen technologies.
By Application: Mining and Quarrying Outpace Traditional Construction
Infrastructure works accounted for 36.24% of 2025 revenue, driven by sovereign stimulus in the Asia-Pacific and Middle East regions. Residential builders rent compact machines to avoid idle capital, while commercial developers rely on cranes and concrete gear for multi-story timelines.
Mining and quarrying exhibit the fastest growth rate of 5.94% to 2031, as commodity price volatility encourages operators to shift fixed equipment costs into variable rental outlays. Epiroc noted that mining represented a notable share of its 2024 orders, underscoring the opportunity. Oil and gas contractors similarly prefer rentals for specialized, high-capex machines needed only episodically.
By Rental Channel: Online Platforms Gain Share
Offline branches retained an 80.22% hold in 2025 because many contractors still value face-to-face service and instant availability. Same-day delivery and on-site maintenance remain decisive for complex gear.
Online platforms, however, are projected to grow at a 9.84% CAGR by 2031, significantly outpacing the overall construction equipment rental market. EquipmentShare’s T3 and United Rentals’ Total Control platforms illustrate how telematics and real-time availability enhance customer ROI. Adoption is fastest in the Asia-Pacific and Middle East regions, where mobile-first users are bypassing legacy branch models.
By Service Type: Short-Term Rentals Accelerate
Medium-term contracts (1–12 months) accounted for 48.26% of 2025 revenue, as they align with typical infrastructure project lengths. Long-term rentals underpin predictable mining and industrial operations, enabling volume discounts.
Short-term rentals of less than one month exhibit the steepest CAGR of 7.13% from 2026 to 2031. Project volatility, tighter credit, and the rise of gig-economy builders make daily and weekly rentals attractive. Operators counter higher logistics costs by leveraging telematics to maximize asset utilization and by charging premium pricing to protect their margins.
Geography Analysis
Asia-Pacific captured a 40.11% share in 2025 and is tracking a notable CAGR to 2031. China’s local infrastructure bonds, India’s significant pipeline, and Japan’s construction budget anchor demand. South Korea’s considerable program and Australia’s mining-plus-renewables mix likewise favor rentals. The region’s mix of urbanization and mega-projects sustains the construction equipment rental market.
The Middle East and Africa log the fastest CAGR of 6.72%, led by Saudi Vision 2030’s USD 1.3 trillion slate spanning NEOM, the Red Sea, and Qiddiya. Projects in the United Arab Emirates, such as Etihad Rail Phase 2, require continuous rotations [3]“Phase 2 Milestones,” Etihad Rail, etihadrail.ae. Turkey’s USD 100 billion reconstruction and South Africa’s renewable-energy program add depth.
North America and Europe experience a steady, albeit slow, growth. The United States continues its strong infrastructure push with significant investments. While Canada prioritizes transit and power lines, Germany channels its construction efforts towards electric fleets, aligning with urban low-emission mandates. The United Kingdom construction sector also leans into specialty rentals to ensure compliance.

Competitive Landscape
North America is more consolidated than other regions, with United Rentals and Sunbelt Rentals together holding a notable share of the construction equipment rental market. In Q3 2024, United Rentals reported significant revenue growth, supported by its extensive fleet. Looking ahead, the company plans to make substantial investments in specialty and electric assets. Meanwhile, Sunbelt demonstrated strong performance in Q1 FY 2025, with a notable commitment to fleet expansion and the addition of numerous new sites across the United States.
Europe remains fragmented: Loxam, Boels, and Cramo push electric fleets and digital portals but face OEM-captive rentals encroaching on their base. Caterpillar’s Cat Rental Stores exploit manufacturer-grade service to win clients directly.
Asia-Pacific operators such as Kanamoto and Coates Hire focus on local service density and specialized equipment. EquipmentShare marries telematics with 373 depots, leveraging data analytics to cut downtime. M&A activity is likely to intensify as big players acquire regional specialists to expand their footprint, gain scale in procurement, and amortize digital-platform investments.
Construction Equipment Rental Industry Leaders
Herc Rentals Inc.
United Rentals Inc.
Ashtead Group plc (Sunbelt Rentals)
Loxam Group
Caterpillar Inc.
- *Disclaimer: Major Players sorted in no particular order

Recent Industry Developments
- October 2025: EquipmentShare opened its sixth Oregon branch in Redmond, creating 24 jobs and signaling plans to double its state footprint.
- June 2025: Desi Machines launched as an India-focused digital platform for discovering, financing, and insuring construction machinery.
- March 2025: BigRentz partnered with PermitFlow to integrate permitting and equipment procurement for smoother pre-construction workflows.
- January 2024: BigRentz teamed with fintech Billd to extend material-and-labor financing to rental customers.


Research Methodology Framework and Report Scope
Market Definitions and Key Coverage
Our study treats the global construction equipment rental market as the revenue earned when contractors, industrial users, and public-sector bodies hire heavy machines, including earth-moving, material-handling, concrete and road-building, power support, and allied attachments, without an operator for periods ranging from a single day to multi-year agreements.
Scope exclusion: Leasing contracts that bundle full-time operators or purely tool-hire outlets are kept outside the counting frame.
Segmentation Overview
- By Equipment Type
- Earthmoving Equipment
- Backhoe Loaders
- Loaders
- Excavators
- Bulldozers
- Skid-Steer Loaders
- Other Earthmoving
- Material Handling Equipment
- Cranes
- Forklifts
- Dump Trucks
- Telehandlers
- Other Material Handling
- Concrete and Road Construction Equipment
- Power and Energy Equipment
- Other Equipment
- Earthmoving Equipment
- By Drive Type
- IC Engine
- Hybrid
- Electric
- Hydrogen Fuel Cell
- By Application
- Residential Construction
- Commercial Construction
- Industrial / Manufacturing
- Infrastructure (Roads, Bridges, Ports)
- Mining and Quarrying
- Oil and Gas
- By Rental Channel
- Offline (Branch-based)
- Online Platforms
- By Service Type
- Short-Term Rental (less than 1 Month)
- Medium-Term Rental (1 - 12 Months)
- Long-Term Rental (Over 1 Year)
- By Geography
- North America
- United States
- Canada
- Rest of North America
- Europe
- Germany
- United Kingdom
- France
- Italy
- Spain
- Russia
- Rest of Europe
- Asia-Pacific
- China
- Japan
- India
- South Korea
- Australia
- Rest of Asia-Pacific
- South America
- Brazil
- Argentina
- Chile
- Rest of South America
- Middle East and Africa
- Saudi Arabia
- United Arab Emirates
- Turkey
- South Africa
- Nigeria
- Rest of Middle East and Africa
- North America
Detailed Research Methodology and Data Validation
Primary Research
Mordor analysts interviewed fleet managers at national rental chains, mid-sized regional depots, and civil-engineering contractors across North America, Europe, Asia-Pacific, and the GCC. Follow-up calls with OEM channel managers and insurance underwriters validated utilization benchmarks, resale ratios, and discount ladders that rarely appear in public filings, allowing us to fine-tune average selling price (ASP) curves and service mix splits.
Desk Research
We began with open datasets such as the U.S. Census Bureau's Monthly Construction Spending tables, Eurostat's Production in Construction index, and building-permit filings that signal fleet demand cycles. Trade bodies, including the American Rental Association, European Rental Association, and Japan Construction Equipment Manufacturers Association, helped us gauge rental penetration shifts and utilization hours. Customs and trade flows from UN Comtrade, plus safety-inspection records published by OSHA and its European equivalents, clarified the active stock of large machines by class. Financial clues on fleet size, age, and average daily rates were extracted from listed rental company 10-Ks, OEM annual reports, and D&B Hoovers screens. News feeds on new depot openings via Dow Jones Factiva rounded out regional momentum. This source list is illustrative; many further documents were consulted for corroboration, gap-filling, and context.
Market-Sizing & Forecasting
A top-down reconstruction starts with national construction outlays and infrastructure capex, which are then converted to equipment pools using rental penetration rates and fleet turnover norms. Supplier roll-ups of depot counts and sampled ASP multiplied by rental-days act as a selective bottom-up cross-check before totals are locked. Key variables modeled include residential starts, government infrastructure budgets, diesel-electric price gaps, fleet age profiles, capex deferral index, and online booking share. Forecasts rely on multivariate regression supplemented by scenario analysis around commodity prices and interest-rate paths; parameter ranges were stress-tested with our primary respondents to ensure realism.
Data Validation & Update Cycle
Outputs pass a three-layer review: automated variance scans against historical series, peer review by a senior domain lead, and a final sign-off meeting. Reports refresh every twelve months; yet we trigger interim edits whenever material events, such as large stimulus bills, emissions mandates, or major M&A, shift the baseline. Clients therefore receive the latest vetted view each time they log in.
Why Mordor's Construction Equipment Rental Baseline Earns Dependability
Published estimates frequently diverge because each firm picks its own cut of equipment classes, rental durations, and currency conversions. We acknowledge those gaps upfront so users see exactly what shapes every figure they read.
Key gap drivers include rivals mixing light tool hire with heavy machines, rolling fleet purchases into rental income, or applying a uniform global ASP that ignores strong regional variance. Some also inflate totals by converting local earnings at average yearly rates instead of daily rates, or by projecting a single aggressive electrification curve rather than region-specific adoption paths that our model captures.
Benchmark comparison
| Market Size | Anonymized source | Primary gap driver |
|---|---|---|
| USD 141.42 Bn (2025) | Mordor Intelligence | - |
| USD 213.68 Bn (2025) | Global Consultancy A | Includes light-tool hire and operated leases, applies uniform ASP |
| USD 147.40 Bn (2024) | Industry Association B | Uses calendar-year averages, omits currency-volatility adjustment |
| USD 135.00 Bn (2024) | Trade Journal C | Excludes online-only rental channels, applies conservative electrification share |
Taken together, the comparison shows that Mordor's disciplined scope selection, dual-track modeling, and annual refresh cadence produce a balanced, transparent baseline that decision-makers can retrace and replicate with confidence.


Key Questions Answered in the Report
What is the projected value of the construction equipment rental market in 2031?
It is forecast to reach USD 179.21 billion, growing at a 4.85% CAGR from 2026 to 2031.
Which segment leads by construction equipment rental market share?
Earthmoving equipment commanded 41.05% share in 2025 and is still growing faster than the overall market.
Why are contractors shifting to equipment rentals?
Rentals convert capital outlays into operating expenses, preserve liquidity, and align costs with project timelines.
Which geography is expanding the fastest?
The Middle East and Africa show a 6.72% CAGR to 2031, driven by mega-projects under Saudi Vision 2030.
How big is the opportunity for online rental platforms?
Online platforms are advancing at 9.84% CAGR, almost double the overall market pace, thanks to mobile-first adoption in Asia-Pacific and the Middle East.
Page last updated on:


