Market Overview
| Study Period | 2019 - 2030 |
|---|---|
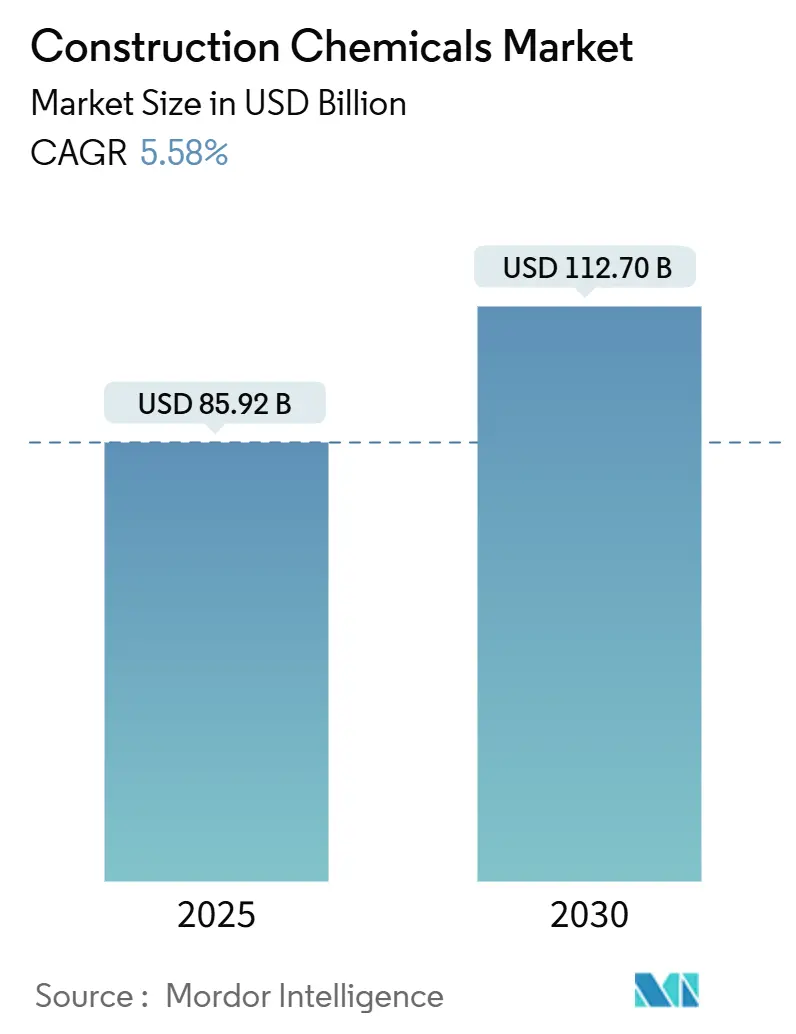
| Market Size (2025) | USD 85.92 Billion |
| Market Size (2030) | USD 112.70 Billion |
| Growth Rate (2025 - 2030) | 5.58% CAGR |
| Fastest Growing Market | Asia Pacific |
| Largest Market | Asia-Pacific |
| Market Concentration | Low |
Major Players
*Disclaimer: Major Players sorted in no particular order Image © Mordor Intelligence. Reuse requires attribution under CC BY 4.0. |
|
Construction Chemicals Market Analysis by Mordor Intelligence
The Construction Chemicals Market size is estimated at USD 85.92 billion in 2025, and is expected to reach USD 112.70 billion by 2030, at a CAGR of 5.58% during the forecast period (2025-2030). Robust urban infrastructure pipelines, tighter green-building mandates, and steady residential demand together strengthen the construction chemicals market growth outlook. Waterproofing systems anchor product revenues because insurers and code officials prioritize moisture protection, while advanced surface treatments gain traction in automated precast yards. Regional momentum remains centered in Asia-Pacific, where megaproject pipelines accelerate specialty chemical adoption. Across mature economies, asset rehabilitation programs sustain volume when new-build activity plateaus. Competitive dynamics favor suppliers that marry formulation science with on-site technical service, helping contractors meet stricter performance specifications.
Key Report Takeaways
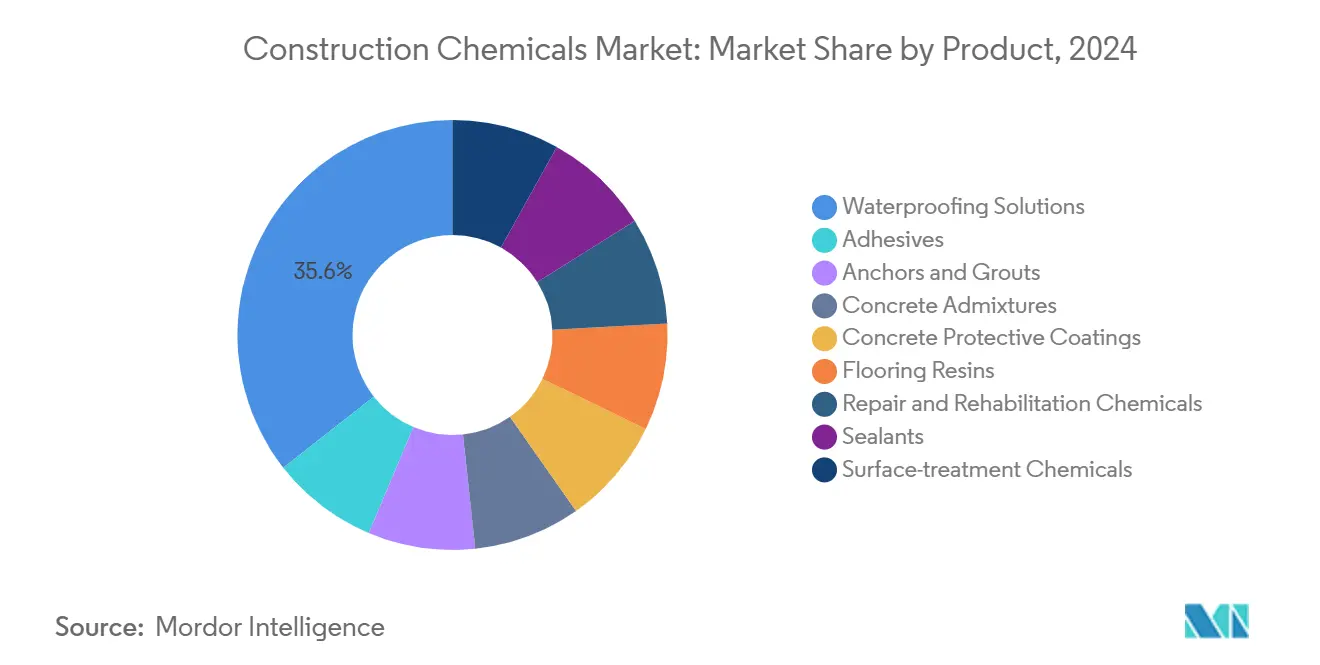
- By product category, waterproofing solutions led with 35.57% of the construction chemicals market share in 2024; surface-treatment chemicals are projected to expand at a 6.92% CAGR through 2030.
- By end-use sector, infrastructure accounted for 29.61% of the construction chemicals market size in 2024, while residential applications posted the fastest 7.05% CAGR to 2030.
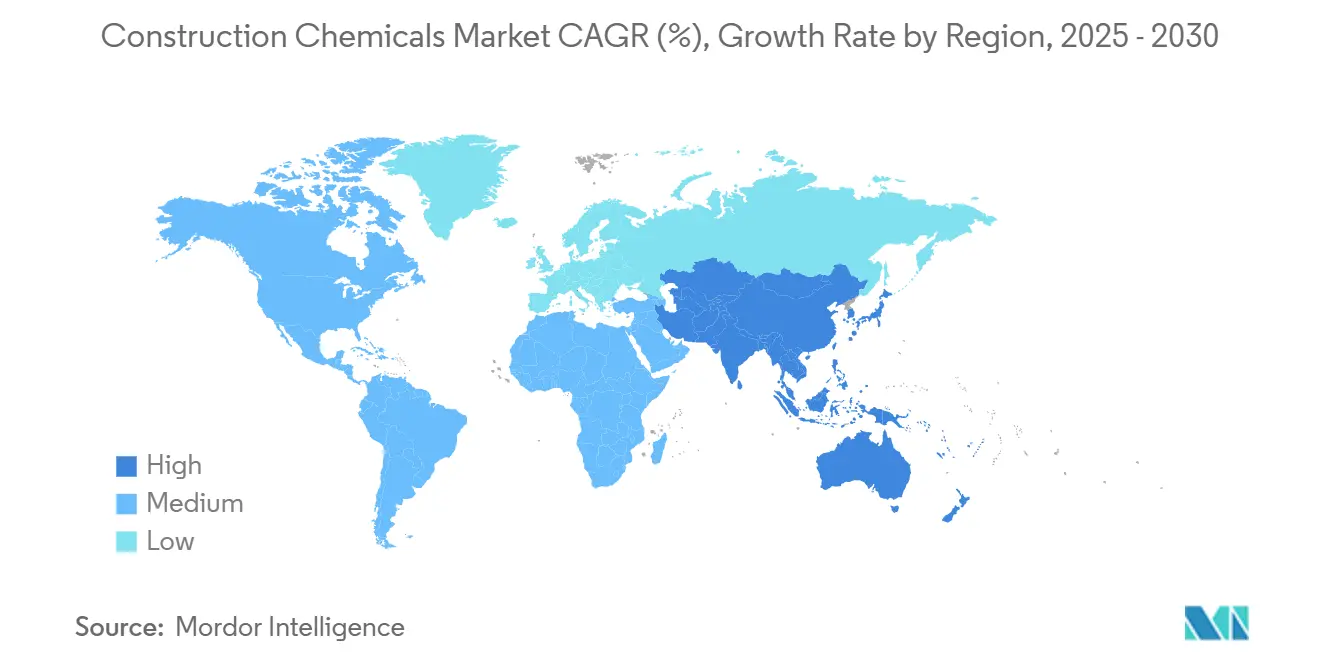
- By geography, Asia-Pacific commanded 41.45% of the construction chemicals market in 2024 and is advancing at a 6.38% CAGR over 2025-2030.
Global Construction Chemicals Market Trends and Insights
Driver Impact Analysis
| Drivers | (~) % Impact on CAGR Forecast | Geographic Relevance | Impact Timeline |
|---|---|---|---|
| Urbanization-led infrastructure boom | +1.8% | APAC core, spill-over to MEA | Long term (≥ 4 years) |
| Green-building codes boost admixture demand | +1.2% | Global, with early gains in EU and North America | Medium term (2-4 years) |
| Government post-COVID stimulus for construction | +0.9% | Global | Short term (≤ 2 years) |
| Aging assets spur repair and rehabilitation spend | +0.7% | North America and EU | Long term (≥ 4 years) |
| 3D-printed concrete adoption needs specialty mixes | +0.4% | North America, EU, select APAC markets | Medium term (2-4 years) |
| Source: Mordor Intelligence | |||
Understand The Key Trends Shaping This Market
Download PDF
Urbanization-Led Infrastructure Boom Drives Emerging-Market Demand
Sustained city building programs in Asia-Pacific drive bulk consumption of admixtures, waterproofers, and curing compounds that improve durability in congested job sites. India’s USD 1.4 trillion National Infrastructure Pipeline offers a similar catalyst, with large highway and metro packages specifying low-shrinkage concrete admixtures for slab continuity. UN-Habitat forecasts 2.5 billion additional urban residents by 2050, implying a long runway for chemical demand tied to transit, utilities, and high-rise housing. Contractors also lean on fast-setting grouts to keep megaproject schedules on track. Taken together, these factors embed a structural pull for the construction chemicals market that transcends short-cycle fluctuations.
Green-building Codes Boost Admixture Demand
Energy-performance directives now force designers to cap embodied carbon, pushing concrete producers to adopt high-range water reducers and supplementary cementitious materials. The European Union requires all new buildings to achieve net-zero emissions by 2030 under the Energy Performance of Buildings Directive[1]European Commission, “Energy Performance of Buildings Directive,” europa.eu. U.S. LEED v4.1 and BREEAM standards likewise reward low-VOC sealants and bio-based coatings, stimulating premium niches for soy-polyol polyurethane membranes. Product registries such as EPA Safer Choice further influence contractor specifications toward water-borne systems. Suppliers that reformulate ahead of code deadlines capture specification loyalty and reinforce pricing power within the construction chemicals market.
Government Post-COVID Stimulus for Construction
Infrastructure stimulus preserved jobsite momentum in 2024 and continues to support bid pipelines into 2026. The United States earmarked USD 550 billion for bridges, roads, and utilities under the Infrastructure Investment and Jobs Act[2]U.S. Department of Transportation, “Funding for Major Bridge Projects,” transportation.gov. The EU’s EUR 724 billion Recovery and Resilience Facility channels funds toward green and digital projects, many requiring high-performance membranes and protective coatings. Rapid award cycles elevate demand for ready-to-use repair mortars that speed time-to-service. Although stimulus disbursements taper after 2025, backlogs generated to date sustain order books for admixture and sealant suppliers in the construction chemicals market.
Aging Assets Spur Repair and Rehabilitation Spend
Deferred maintenance in mature economies shifts budgets from replacement toward chemical-enabled refurbishment. The American Society of Civil Engineers places cumulative needs at USD 2.6 trillion through 2029 and labels 42% of U.S. bridges as at least 50 years old. Carbon-fiber wrap systems and corrosion inhibitors extend service life while minimizing traffic disruptions. Europe faces a similar predicament; 40% of its bridge inventory will require major rehabilitation within ten years. Given limited public budgets, asset owners gravitate toward chemical solutions that deliver 25-30-year performance guarantees, underpinning a resilient revenue stream for the construction chemicals market.
Restraint Impact Analysis
| Restraints | (~) % Impact on CAGR Forecast | Geographic Relevance | Impact Timeline |
|---|---|---|---|
| Petro-chemical price volatility | -1.1% | Global | Short term (≤ 2 years) |
| Stricter VOC limits on solvent-borne products | -0.6% | EU, North America, select APAC markets | Medium term (2-4 years) |
| Skill gap in dosing advanced admixtures | -0.3% | Global, acute in developing markets | Long term (≥ 4 years) |
| Source: Mordor Intelligence | |||
Petro-chemical Price Volatility
Fluctuating oil and derivative feedstock prices compress supplier margins and complicate contractor budgeting. Brent crude traded between USD 70 and USD 90 per barrel throughout 2024, pulling propylene and epoxy resin prices along the same path. Manufacturers absorb cost spikes or issue surcharges that sometimes delay jobsite adoption of premium products. Heightened geopolitical risks further disrupt supply chains, prompting formulators to diversify into bio-based polyols or recycled polymers. Short-term uncertainty therefore trims the forecast growth slope of the construction chemicals market until feedstock trends stabilize.
Stricter VOC Limits on Solvent-borne Products
Regulators cap volatile organic compound emissions to improve indoor air quality and curb smog. California’s South Coast AQMD slashes allowable VOC levels for architectural coatings to 30 g/L, forcing rapid reformulation of legacy primers. The EU Paints Directive imposes parallel ceilings, challenging suppliers to maintain cure speed and adhesion without high-solvent carriers. Reformulation costs can raise finished-goods prices by 8-10%, discouraging uptake in cost-sensitive markets. Consequently, compliance pressure moderates gains in certain product niches within the construction chemicals market.
Segment Analysis
By Product: Waterproofing Solutions Drive Market Leadership
Waterproofing solutions captured 35.57% of construction chemicals market share in 2024, illustrating their central role in safeguarding concrete and masonry against moisture intrusion. The sub-segment benefits from stricter building codes that specify full-basement tanking, green-roof membranes, and negative-side coatings on water-retaining structures. Infrastructure agencies in flood-prone regions demand elastomeric sheets that can bridge 2 mm-wide cracks, supporting premium pricing even when commodity polymers fluctuate. Manufacturers integrate nanoclay barriers into polymer chains to cut permeance by 40%, strengthening brand differentiation.
The fastest-growing surface-treatment chemicals segment posts a 6.92% CAGR, fueled by automated precast factories that apply curing compounds by robot to enhance batch consistency. Demand also rises for lithium-silicate hardeners that cut dusting in logistics warehouses. Admixture portfolios continue to evolve with polycarboxylate ether superplasticizers that deliver 25 MPa in 24 hours, enabling form-reuse cycles critical to modular construction.
Note: Segment shares of all individual segments available upon report purchase
Get Detailed Market Forecasts at the Most Granular Levels
Download PDF
By End-Use Sector: Infrastructure Dominance Meets Residential Growth
Infrastructure projects accounted for 29.61% of the construction chemicals market size in 2024, led by highways, tunnels, and metro systems that rely on plasticizers, corrosion inhibitors, and sprayed membranes. Notable contracts such as the USD 5 billion Mumbai Coastal Road specify hybrid acrylic-PU systems rated for 100-year design life. Large dam rehabilitation in North America further reinforces volume for alkali-free shotcrete accelerators.
Residential construction is the fastest-advancing end-use at a 7.05% CAGR to 2030, buoyed by government housing incentives and homeowner upgrades to energy-efficient envelopes. Builders embrace ready-mix integral waterproofers that cut labor on low-rise slabs. DIY adoption of crack sealers also widens the consumer channel, adding a new layer to the construction chemicals market. Combining these trends, suppliers tailor pack sizes and marketing to address professional contractors and retail customers without cannibalizing core trade volumes.

Note: Segment shares of all individual segments available upon report purchase
Get Detailed Market Forecasts at the Most Granular Levels
Download PDF
Geography Analysis
Asia-Pacific held 41.45% construction chemicals market share in 2024 and maintains the highest 6.38% CAGR through 2030. China anchors demand with Belt and Road rail lines and coastal port upgrades that specify low-chloride admixtures for marine exposure. India’s Smart Cities Mission triggers rooftop waterproofing and paving sealant purchases across 100 municipalities, while Southeast Asia accelerates industrial park builds that require anti-carbonation coatings. Price-sensitive contractors favor locally blended formulations yet consult multinational suppliers for complex bridge decks, enabling cooperative production agreements that deepen regional penetration.
North America contributes steady revenue on the back of public-sector modernization. The USD 550 billion federal infrastructure act channels funds into 15,000 highway-lane-mile resurfacing projects that need fiber-modified patching mortars. Building codes such as the International Residential Code mandate dampproof courses in basements, supporting retail membrane sales. Growth in the United States and Canada therefore offsets cyclic softness in private commercial starts, keeping the construction chemicals market on a positive slope.
Europe shows mature yet innovation-driven behavior. Carbon-neutrality goals in the European Green Deal demand clinker-reduced cements, advancing demand for high-range water reducers and silane sealers that restrict carbonation. Aging bridge stock in Germany and Italy spurs cathodic-protection grout usage, while Scandinavia pioneers bio-based polyurethane foams for below-grade insulation.
Get Analysis on Important Geographic Markets
Download PDF
Competitive Landscape
The construction chemicals market remains highly fragmented in nature. Sika, MAPEI, and BASF leverage global technical centers to customize formulations for local codes, boosting switching costs for contractors. Each has developed proprietary admixture analytics apps that recommend dosage in real time, minimizing on-site errors and strengthening customer lock-in. Strategic moves emphasize vertical integration. Sika’s 2024 purchase of MBCC added epoxy resin capacity and new precast additives, enhancing supply security during raw-material spikes. Regional players in India, Turkey, and Brazil expand via cost-effective blends that meet mid-tier specifications. Many license spray-applied polyurea technologies from multinational firms, creating hybrid competition–collaboration models. Private-label channels through big-box retailers comprise another growth lane, particularly for one-component sealants.
Construction Chemicals Industry Leaders
-
Saint-Gobain
-
Sika AG
-
MAPEI S.p.A.
-
RPM International Inc.
-
Beijing Oriental Yuhong Waterproof Technology Co., Ltd.
- *Disclaimer: Major Players sorted in no particular order
Need More Details on Market Players and Competitors?
Download PDF
Recent Industry Developments
- September 2025: Master Builder Construction Chemicals inaugurated a 25,000 t/year multi-line plant in Taloja, India, boosting domestic supply of admixtures, waterproofers, and repair mortars.
- April 2025: Sika acquired HPS North America, integrating adhesives, sealants, and waterproofing lines to build a national finishing-products platform.
Global Construction Chemicals Market Report Scope
Commercial, Industrial and Institutional, Infrastructure, Residential are covered as segments by End Use Sector. Adhesives, Anchors and Grouts, Concrete Admixtures, Concrete Protective Coatings, Flooring Resins, Repair and Rehabilitation Chemicals, Sealants, Surface Treatment Chemicals, Waterproofing Solutions are covered as segments by Product. Asia-Pacific, Europe, Middle East and Africa, North America, South America are covered as segments by Region.
By Product
| Adhesives | Hot-melt |
| Reactive | |
| Solvent-borne | |
| Water-borne | |
| Anchors and Grouts | Cementitious |
| Resin | |
| Concrete Admixtures | Accelerator |
| Air-entraining | |
| High Range Water Reducer (Super Plasticizer) | |
| Retarder | |
| Shrinkage-reducing | |
| Viscosity Modifier | |
| Water Reducer (Plasticizer) | |
| Other Types | |
| Concrete Protective Coatings | Acrylic |
| Alkyd | |
| Epoxy | |
| Polyurethane | |
| Other Resins | |
| Flooring Resins | Acrylic |
| Epoxy | |
| Polyaspartic | |
| Polyurethane | |
| Other Resins | |
| Repair and Rehabilitation Chemicals | Fiber-wrapping systems |
| Injection grouts | |
| Micro-concrete mortars | |
| Modified mortars | |
| Rebar protectors | |
| Sealants | Acrylic |
| Epoxy | |
| Polyurethane | |
| Silicone | |
| Other Resins | |
| Surface-treatment Chemicals | Curing compounds |
| Mold-release agents | |
| Other Types | |
| Waterproofing Solutions | Chemicals |
| Membranes |
By End-Use Sector
| Commercial |
| Industrial and Institutional |
| Infrastructure |
| Residential |
By Geography
| Asia-Pacific | China |
| India | |
| Japan | |
| South Korea | |
| Australia | |
| Indonesia | |
| Malaysia | |
| Thailand | |
| Vietnam | |
| Rest of Asia-Pacific | |
| North America | United States |
| Canada | |
| Mexico | |
| Europe | Germany |
| France | |
| Italy | |
| Spain | |
| United Kingdom | |
| Russia | |
| Rest of Europe | |
| South America | Brazil |
| Argentina | |
| Rest of South America | |
| Middle-East and Africa | Saudi Arabia |
| United Arab Emirates | |
| Rest of Middle-East and Africa |
| By Product | Adhesives | Hot-melt |
| Reactive | ||
| Solvent-borne | ||
| Water-borne | ||
| Anchors and Grouts | Cementitious | |
| Resin | ||
| Concrete Admixtures | Accelerator | |
| Air-entraining | ||
| High Range Water Reducer (Super Plasticizer) | ||
| Retarder | ||
| Shrinkage-reducing | ||
| Viscosity Modifier | ||
| Water Reducer (Plasticizer) | ||
| Other Types | ||
| Concrete Protective Coatings | Acrylic | |
| Alkyd | ||
| Epoxy | ||
| Polyurethane | ||
| Other Resins | ||
| Flooring Resins | Acrylic | |
| Epoxy | ||
| Polyaspartic | ||
| Polyurethane | ||
| Other Resins | ||
| Repair and Rehabilitation Chemicals | Fiber-wrapping systems | |
| Injection grouts | ||
| Micro-concrete mortars | ||
| Modified mortars | ||
| Rebar protectors | ||
| Sealants | Acrylic | |
| Epoxy | ||
| Polyurethane | ||
| Silicone | ||
| Other Resins | ||
| Surface-treatment Chemicals | Curing compounds | |
| Mold-release agents | ||
| Other Types | ||
| Waterproofing Solutions | Chemicals | |
| Membranes | ||
| By End-Use Sector | Commercial | |
| Industrial and Institutional | ||
| Infrastructure | ||
| Residential | ||
| By Geography | Asia-Pacific | China |
| India | ||
| Japan | ||
| South Korea | ||
| Australia | ||
| Indonesia | ||
| Malaysia | ||
| Thailand | ||
| Vietnam | ||
| Rest of Asia-Pacific | ||
| North America | United States | |
| Canada | ||
| Mexico | ||
| Europe | Germany | |
| France | ||
| Italy | ||
| Spain | ||
| United Kingdom | ||
| Russia | ||
| Rest of Europe | ||
| South America | Brazil | |
| Argentina | ||
| Rest of South America | ||
| Middle-East and Africa | Saudi Arabia | |
| United Arab Emirates | ||
| Rest of Middle-East and Africa | ||
Need A Different Region or Segment?
Customize Now
Market Definition
- END-USE SECTOR - Construction chemicals consumed in the construction sectors such as commercial, residential, industrial, institutional, and infrastructure are considered under the scope of the study.
- PRODUCT/APPLICATION - Under the scope of the study, the consumption of construction chemical products such as concrete admixtures, repair and rehabilitation chemicals, flooring resins, waterproofing solutions, anchors and grouts, adhesives and sealants, and surface treatment chemicals is considered.
| Keyword | Definition |
|---|---|
| Accelerator | Accelerators are admixtures used to fasten the setting time of concrete by increasing the initial rate and speeding up the chemical reaction between cement and the mixing water. These are used to harden and increase the strength of concrete quickly. |
| Acrylic | This synthetic resin is a derivative of acrylic acid. It forms a smooth surface and is mainly used for various indoor applications. The material can also be used for outdoor applications with a special formulation. |
| Adhesives | Adhesives are bonding agents used to join materials by gluing. Adhesives can be used in construction for many applications, such as carpet laying, ceramic tiles, countertop lamination, etc. |
| Air Entraining Admixture | Air-entraining admixtures are used to improve the performance and durability of concrete. Once added, they create uniformly distributed small air bubbles to impart enhanced properties to the fresh and hardened concrete. |
| Alkyd | Alkyds are used in solvent-based paints such as construction and automotive paints, traffic paints, flooring resins, protective coatings for concrete, etc. Alkyd resins are formed by the reaction of an oil (fatty acid), a polyunsaturated alcohol (Polyol), and a polyunsaturated acid or anhydride. |
| Anchors and Grouts | Anchors and grouts are construction chemicals that stabilize and improve the strength and durability of foundations and structures like buildings, bridges, dams, etc. |
| Cementitious Fixing | Cementitious fixing is a process in which a cement-based grout is pumped under pressure to fill forms, voids, and cracks. It can be used in several settings, including bridges, marine applications, dams, and rock anchors. |
| Commercial Construction | Commercial construction comprises new construction of warehouses, malls, shops, offices, hotels, restaurants, cinemas, theatres, etc. |
| Concrete Admixtures | Concrete admixtures comprise water reducers, air entrainers, retarders, accelerators, superplasticizers, etc., added to concrete before or during mixing to modify its properties. |
| Concrete Protective Coatings | To provide specific protection, such as anti-carbonation or chemical resistance, a film-forming protective coat can be applied on the surface. Depending on the applications, different resins like epoxy, polyurethane, and acrylic can be used for concrete protective coatings. |
| Curing Compounds | Curing compounds are used to cure the surface of concrete structures, including columns, beams, slabs, and others. These curing compounds keep the moisture inside the concrete to give maximum strength and durability. |
| Epoxy | Epoxy is known for its strong adhesive qualities, making it a versatile product in many industries. It resists heat and chemical applications, making it an ideal product for anyone needing a stronghold under pressure. It is widely used in adhesives, electrical and electronics, paints, etc. |
| Fiber Wrapping Systems | Fiber Wrapping Systems are a part of construction repair and rehabilitation chemicals. It involves the strengthening of existing structures by wrapping structural members like beams and columns with glass or carbon fiber sheets. |
| Flooring Resins | Flooring resins are synthetic materials applied to floors to enhance their appearance, increase their resistance to wear and tear or provide protection from chemicals, moisture, and stains. Depending on the desired properties and the specific application, flooring resins are available in distinct types, such as epoxy, polyurethane, and acrylic. |
| High-Range Water Reducer (Super Plasticizer) | High-range water reducers are a type of concrete admixture that provides enhanced and improved properties when added to concrete. These are also called superplasticizers and are used to decrease the water-to-cement ratio in concrete. |
| Hot Melt Adhesives | Hot-melt adhesives are thermoplastic bonding materials applied as melts that achieve a solid state and resultant strength on cooling. They are commonly used for packaging, coatings, sanitary products, and tapes. |
| Industrial and Institutional Construction | Industrial and institutional construction includes new construction of hospitals, schools, manufacturing units, energy and power plants, etc. |
| Infrastructure Construction | Infrastructure construction includes new construction of railways, roads, seaways, airports, bridges, highways, etc. |
| Injection Grouting | The process of injecting grout into open joints, cracks, voids, or honeycombs in concrete or masonry structural members is known as injection grouting. It offers several benefits, such as strengthening a structure and preventing water infiltration. |
| Liquid-Applied Waterproofing Membranes | Liquid-Applied membrane is a monolithic, fully bonded, liquid-based coating suitable for many waterproofing applications. The coating cures to form a rubber-like elastomeric waterproof membrane and may be applied over many substrates, including asphalt, bitumen, and concrete. |
| Micro-concrete Mortars | Micro-concrete mortar is made up of cement, water-based resin, additives, mineral pigments, and polymers and can be applied on both horizontal and vertical surfaces. It can be used to refurbish residential complexes, commercial spaces, etc. |
| Modified Mortars | Modified Mortars include Portland cement and sand along with latex/polymer additives. The additives increase adhesion, strength, and shock resistance while also reducing water absorption. |
| Mold Release Agents | Mold release agents are sprayed or coated on the surface of molds to prevent a substrate from bonding to a molding surface. Several types of mold release agents, including silicone, lubricant, wax, fluorocarbons, and others, are used based on the type of substrates, including metals, steel, wood, rubber, plastic, and others. |
| Polyaspartic | Polyaspartic is a subset of polyurea. Polyaspartic floor coatings are typically two-part systems that consist of a resin and a catalyst to ease the curing process. It offers high durability and can withstand harsh environments. |
| Polyurethane | Polyurethane is a plastic material that exists in various forms. It can be tailored to be either rigid or flexible and is the material of choice for a broad range of end-user applications, such as adhesives, coatings, building insulation, etc. |
| Reactive Adhesives | A reactive adhesive is made of monomers that react in the adhesive curing process and do not evaporate from the film during use. Instead, these volatile components become chemically incorporated into the adhesive. |
| Rebar Protectors | In concrete structures, rebar is one of the important components, and its deterioration due to corrosion is a major issue that affects the safety, durability, and life span of buildings and structures. For this reason, rebar protectors are used to protect against degrading effects, especially in infrastructure and industrial construction. |
| Repair and Rehabilitation Chemicals | Repair and Rehabilitation Chemicals include repair mortars, injection grouting materials, fiber wrapping systems, micro-concrete mortars, etc., used to repair and restore existing buildings and structures. |
| Residential Construction | Residential construction involves constructing new houses or spaces like condominiums, villas, and landed homes. |
| Resin Fixing | The process of using resins like epoxy and polyurethane for grouting applications is called resin fixing. Resin fixing offers several advantages, such as high compressive and tensile strength, negligible shrinkage, and greater chemical resistance compared to cementitious fixing. |
| Retarder | Retarders are admixtures used to slow down the setting time of concrete. These are usually added with a dosage rate of around 0.2% -0.6% by weight of cement. These admixtures slow down hydration or lower the rate at which water penetrates the cement particles by making concrete workable for a long time. |
| Sealants | A sealant is a viscous material that has little or no flow qualities, which causes it to remain on surfaces where they are applied. Sealants can also be thinner, enabling penetration to a certain substance through capillary action. |
| Sheet Waterproofing Membranes | Sheet membrane systems are reliable and durable thermoplastic waterproofing solutions that are used for waterproofing applications even in the most demanding below-ground structures, including those exposed to highly aggressive ground conditions and stress. |
| Shrinkage Reducing Admixture | Shrinkage-reducing admixtures are used to reduce concrete shrinkage, whether from drying or self-desiccation. |
| Silicone | Silicone is a polymer that contains silicon combined with carbon, hydrogen, oxygen, and, in some cases, other elements. It is an inert synthetic compound that comes in various forms, such as oil, rubber, and resin. Due to its heat-resistant properties, it finds applications in sealants, adhesives, lubricants, etc. |
| Solvent-borne Adhesives | Solvent-borne adhesives are mixtures of solvents and thermoplastic or slightly cross-linked polymers such as polychloroprene, polyurethane, acrylic, silicone, and natural and synthetic rubbers. |
| Surface Treatment Chemicals | Surface treatment chemicals are chemicals used to treat concrete surfaces, including roofs, vertical surfaces, and others. They act as curing compounds, demolding agents, rust removers, and others. They are cost-effective and can be used on roadways, pavements, parking lots, and others. |
| Viscosity Modifier | Viscosity Modifiers are concrete admixtures used to change various properties of admixtures, including viscosity, workability, cohesiveness, and others. These are usually added with a dosage of around 0.01% to 0.1% by weight of cement. |
| Water Reducer | Water reducers, also called plasticizers, are a type of admixture used to decrease the water-to-cement ratio in the concrete, thereby increasing the durability and strength of concrete. Various water reducers include refined lignosulfonates, gluconates, hydroxycarboxylic acids, sugar acids, and others. |
| Water-borne Adhesives | Water-borne adhesives use water as a carrier or diluting medium to disperse resin. They are set by allowing the water to evaporate or be absorbed by the substrate. These adhesives are compounded with water as a dilutant rather than a volatile organic solvent. |
| Waterproofing Chemicals | Waterproofing chemicals are designed to protect a surface from the perils of leakage. A waterproofing chemical is a protective coating or primer applied to a structure's roof, retaining walls, or basement. |
| Waterproofing Membranes | Waterproofing membranes are liquid-applied or self-adhering layers of water-tight materials that prevent water from penetrating or damaging a structure when applied to roofs, walls, foundations, basements, bathrooms, and other areas exposed to moisture or water. |
Need More Details on Market Definition?
Ask a Question
Research Methodology
Mordor Intelligence follows a four-step methodology in all our reports.
- Step-1: Identify Key Variables: The quantifiable key variables (industry and extraneous) pertaining to the specific product segment and country are selected from a group of relevant variables & factors based on desk research & literature review; along with primary expert inputs. These variables are further confirmed through regression modeling (wherever required).
- Step-2: Build a Market Model: In order to build a robust forecasting methodology, the variables and factors identified in Step-1 are tested against available historical market numbers. Through an iterative process, the variables required for market forecast are set and the model is built on the basis of these variables.
- Step-3: Validate and Finalize: In this important step, all market numbers, variables and analyst calls are validated through an extensive network of primary research experts from the market studied. The respondents are selected across levels and functions to generate a holistic picture of the market studied.
- Step-4: Research Outputs: Syndicated Reports, Custom Consulting Assignments, Databases & Subscription Platforms

Get More Details On Research Methodology
Download PDF


