
Connected Street Lighting Market Size and Share
Market Overview
| Study Period | 2020 - 2031 |
|---|---|
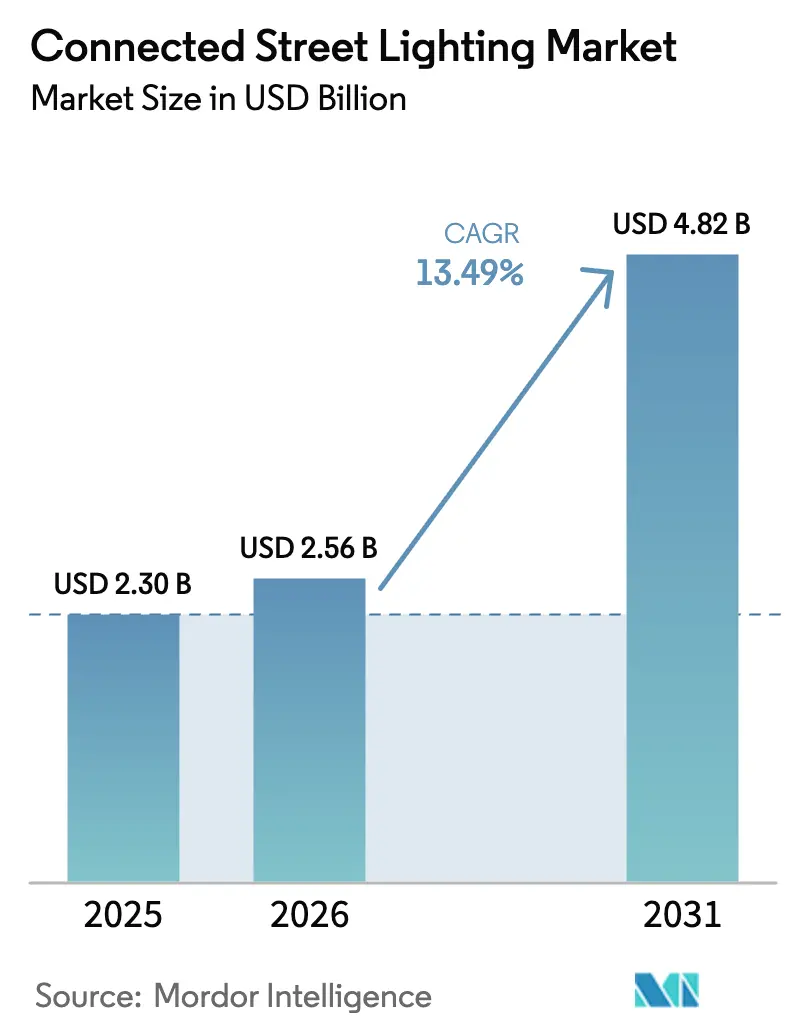
| Market Size (2026) | USD 2.56 Billion |
| Market Size (2031) | USD 4.82 Billion |
| Growth Rate (2026 - 2031) | 13.49 % |
| Fastest Growing Market | Asia Pacific |
| Largest Market | North America |
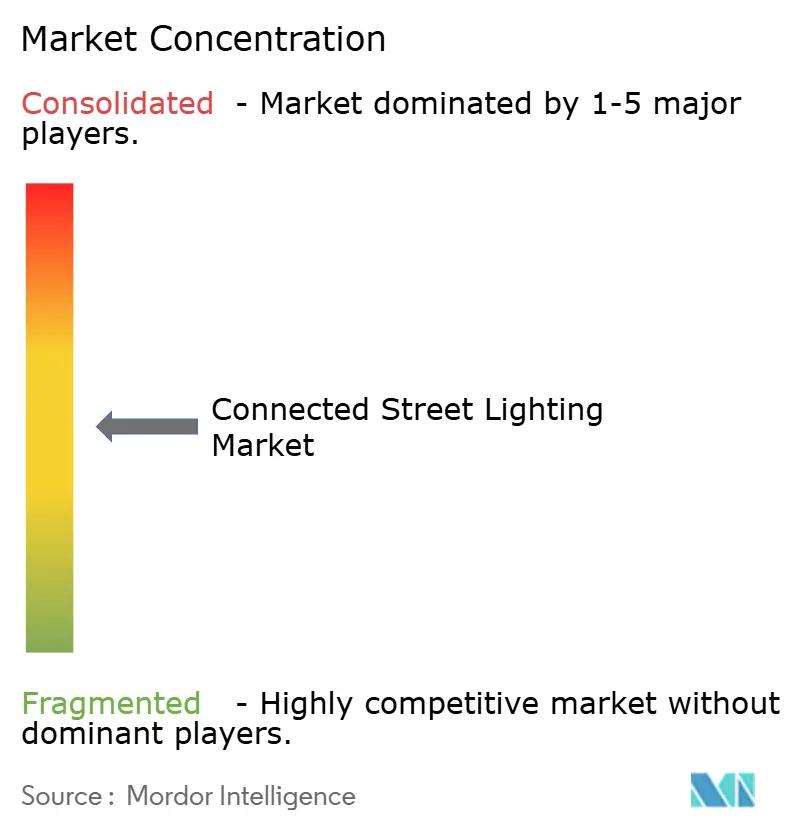
| Market Concentration | Medium |
Major Players *Disclaimer: Major Players sorted in no particular order Image © Mordor Intelligence. Reuse requires attribution under CC BY 4.0. | |
Connected Street Lighting Market Analysis by Mordor Intelligence
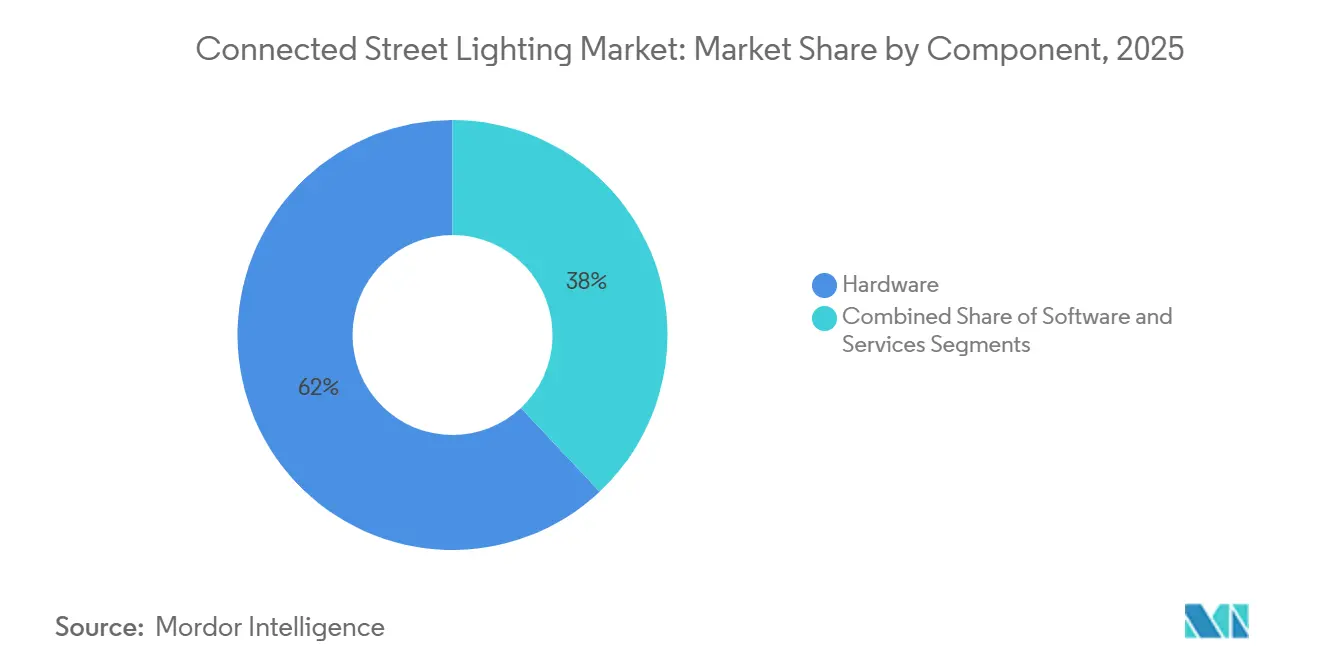
The connected street lighting market size is projected to reach USD 4.82 billion by 2031, reflecting a 13.49% CAGR over the forecast period, from USD 2.56 billion in 2026. Cities are prioritizing energy efficiency, cellular IoT maturity, and multiuse poles that can host 5G small cells, environmental sensors, and EV charging add-ons.[1] Hardware commanded a 62% share in 2025, while software and services are expanding at 13.65% CAGR as buyers emphasize predictive maintenance and emissions reporting tied to revenue-grade metering. Proprietary RF held 55.5% of connectivity in 2025; however, cellular options such as NB-IoT and LTE-M are expected to grow at a 13.73% CAGR, as plug-and-play controllers reduce deployment friction. Cloud models accounted for 45% of deployments in 2025 and are scaling with open APIs that integrate lighting telemetry into traffic, air quality, and emergency dashboards.
Key Report Takeaways
- By component, hardware led with a 62% share in 2025, while software and services are projected to grow at a 13.65% CAGR to 2031.
- By connectivity, proprietary RF networking held a 55.5% share in 2025, and cellular is forecast to post a 13.73% CAGR through 2031.
- By application, traffic optimization accounted for 28% of deployments in 2025, while smart parking is expected to expand at a 13.89% CAGR through 2031.
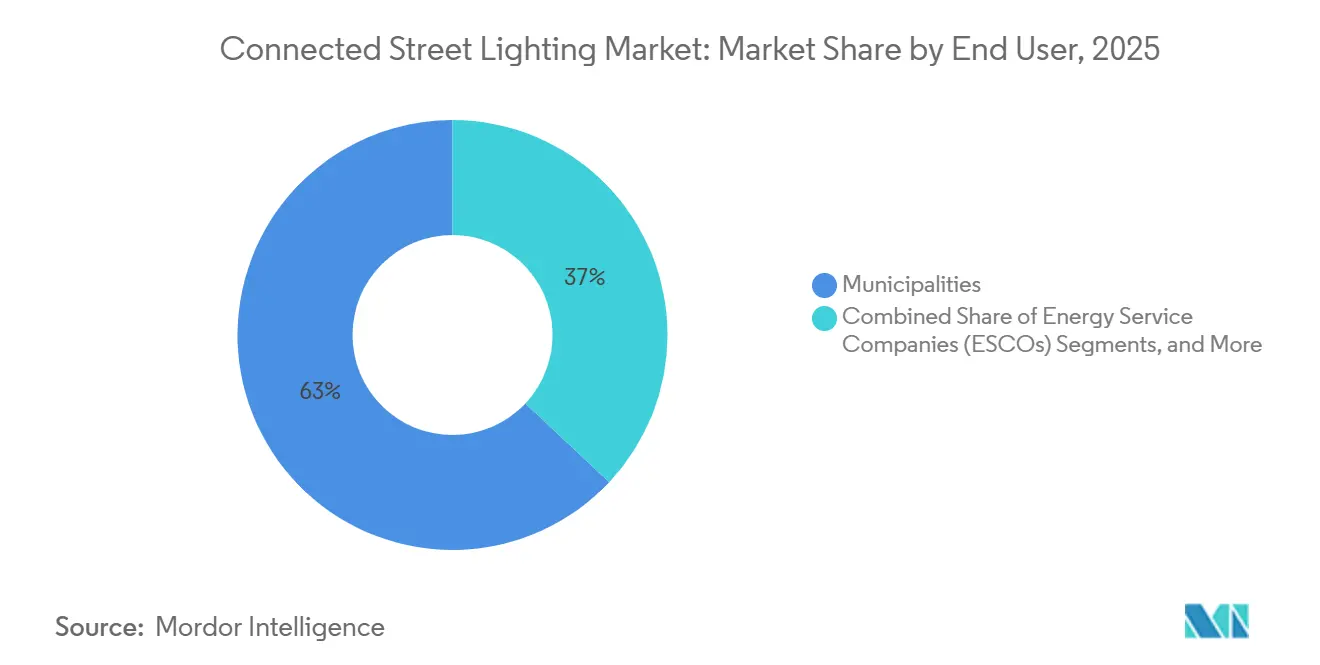
- By end user, municipalities accounted for 63% of adoption in 2025, while industrial parks and ESCOs are set to grow at a 14.04% CAGR.
- By geography, Europe held a 65% installed base lead in 2025, and Asia-Pacific is projected to be the fastest-growing region at a 14.12% CAGR.
- By deployment model, cloud held a 45% share in 2025 and is expected to rise at a 13.67% CAGR through 2031.
Note: Market size and forecast figures in this report are generated using Mordor Intelligence’s proprietary estimation framework, updated with the latest available data and insights as of January 2026.
Market Trends and Insights
Drivers Impact Analysis of Connected Street Lighting Market*
| Driver | (~) % Impact on CAGR Forecast | Geographic Relevance | Impact Timeline |
|---|---|---|---|
| Rising Electricity Prices and Energy Efficiency Mandates | +2.8% | Global, stronger in EU and North America | Medium term (2-4 years) |
| Acceleration of Smart City Programs and PPP Procurement | +3.1% | Asia-Pacific, Middle East, selected EU cities | Long term (≥ 4 years) |
| Rapid Shift to Cellular Controls for Plug-and-Play Deployments | +2.4% | North America, Asia-Pacific, early Middle East | Short term (≤ 2 years) |
| Interoperability via Zhaga-D4i, DALI-2, and TALQ | +1.9% | Europe, North America, global greenfield | Medium term (2-4 years) |
| Data-Driven Operations and Predictive Maintenance | +2.2% | North America, Europe, expanding in Asia-Pacific | Medium term (2-4 years) |
| Lamp-Post-as-a-Platform for 5G and Sensing | +1.1% | Urban hubs in North America and Europe, APAC corridors | Long term (≥ 4 years) |
| Source: Mordor Intelligence | |||
Rising Electricity Prices and Energy Efficiency Mandates Compound Retrofit Economics
Networked LED streetlights with controls have delivered measurable energy and O&M cuts in large programs, which strengthens the business case for scale. Chicago’s 290,000 fixture rollout reduced annual electricity expenses by USD 8.7 million and generated USD 37 million in utility rebates over five years, while carbon reductions totaled 134,600 metric tons by September 2022. [2] Revenue-grade metering in smart lighting platforms supports compliance and streamlined reporting, eliminating the need for costly substation instrumentation. Ontario’s 2025 grid-planning guidance emphasizes non-wires strategies during project screening, positioning adaptive lighting as a flexible demand-response tool for utilities and municipalities. Procurement teams increasingly link controller-capable luminaires to rebate eligibility and decarbonization tracking, reinforcing the role of connected lighting in municipal energy policy. These dynamics underpin durable demand in the smart street lighting management systems market as cities aim to protect budgets and meet climate targets.
Acceleration of Smart City Programs and PPP Procurement De-Risks Municipal Balance Sheets
Public-private partnerships enable cities to shift performance risk and transform energy savings into predictable payments over multi-year terms. Serbia’s Požega project under an energy service structure is cited as a practical template for smaller municipalities that lack upfront capital but need modernization and verifiable outcomes. India’s Smart Cities Mission directs sizable funding to corridor illumination, intelligent intersections, and connected poles, which sustains high-volume tenders and accelerates digital infrastructure in fast-growing urban clusters. These models also attract infrastructure funds that prefer long-duration, utility-like cash flows anchored in verified energy reductions. As multi-party agreements mature, performance guarantees, remote monitoring, and open-data clauses become standard, which reduces perceived vendor risk and advances bankability. This structural shift supports steady growth in the smart street lighting management systems market where fiscal constraints would otherwise stall upgrades.
Rapid Shift to Cellular Controls for Plug-and-Play Deployments Sidesteps Mesh Gateway Overhead
Deployments that rely on NB-IoT or LTE-M controllers can avoid large gateway fleets, which lowers installation time and simplifies maintenance. Washington, D.C. equipped 75,000 lights with cellular controllers, achieving lamp-level control and real-time monitoring while overcoming the gateway burden typical of private meshes. Standard device management protocols, such as LwM2M 2.0, enhance provisioning and lifecycle support, streamlining large-scale rollouts for utilities and city departments. [3] For city fleets numbering in the tens of thousands, plug-and-play configurations reduce truck rolls and working capital tied up in spares. Cellular models align with standard IT operations by leveraging carrier-grade security and SLAs, which support governance objectives in critical infrastructure. These advantages reinforce the adoption of smart street lighting management systems, where simplicity and speed favor cellular-first strategies.
Interoperability via Zhaga-D4i, DALI-2, and TALQ Improving Vendor Neutrality Unlocks Multi-Decade Asset Life
The DALI Alliance, TALQ Consortium, and Zhaga Consortium formalized a liaison to unify data streams, which reduces integration overhead for multi-vendor lighting fleets. Zhaga Book 18 Edition 4 extended socket-based control to heritage and decorative luminaires, opening a path for smart retrofits in districts with preservation mandates. TALQ-certified projects in Brussels and along major highways demonstrate that standardized interfaces allow utilities to mix controllers and luminaires while maintaining a single central management system. Common data models promote condition-based maintenance and scheduled interventions that reduce mean time to repair when integrated with back-office systems. These developments support lifetime extension and avoid full fixture swaps, strengthening economics in the smart street lighting management systems market.
Restraints Impact Analysis of Connected Street Lighting Market*
| Restraint | (~) % Impact on CAGR Forecast | Geographic Relevance | Impact Timeline |
|---|---|---|---|
| High Upfront Costs, Complex Tendering and Financing | -1.8% | Latin America, Africa, smaller EU municipalities | Medium term (2-4 years) |
| Legacy Infrastructure Integration and Interoperability Gaps | -1.3% | North America, Europe, Asia | Medium term (2-4 years) |
| Cybersecurity, Data Governance, and Sovereignty Concerns | -0.9% | Global, acute in EU, North America, Middle East | Short term (≤ 2 years) |
| Standards Fragmentation and Spectrum Constraints | -0.6% | Dense metros in APAC, North America, Europe | Long term (≥ 4 years) |
| Source: Mordor Intelligence | |||
High Upfront Costs, Complex Tendering and Financing Disproportionately Burden Smaller Municipalities
Network-ready luminaires and controller rollouts add capital intensity that is difficult for small cities to absorb within one budget cycle. Performance-based contracts and availability-payment PPPs move energy-savings risk to private operators, but they can extend procurement timelines due to verification and monitoring requirements. Municipalities evaluate Lighting-as-a-Service to eliminate upfront equipment costs and shift to predictable monthly fees backed by quantifiable O&M savings. Utility alignment around non-wires solutions makes adaptive lighting more attractive where network upgrades would otherwise be approved, although documentation needs and cross-department coordination can slow approvals. Even with long-term savings, smaller towns face elevated tendering overhead, which tempers near-term adoption in the smart street lighting management systems market.
Cybersecurity, Data Governance, and Sovereignty Concerns Elevate Compliance Overhead and Slow Vendor Selection
Manufacturers face lifecycle security obligations and data-access provisions that increase engineering and legal effort. The EU Data Act requires real-time access to device-generated data and ensures data portability without switching fees, changing how cities negotiate contracts and how vendors architect platforms. Many jurisdictions specify data residency or hybrid architectures that keep sensitive telemetry local while syncing anonymized aggregates to cloud analytics. Public-sector agencies acknowledge resource gaps in cybersecurity and consider targeted investments and labeling schemes to raise baseline protections for local governments. Vendor lock-in from legacy systems without modern encryption or over-the-air updates increases migration cost, which influences upgrade timing and supplier choice in the smart street lighting management systems market.
*Our forecasts treat driver/restraint impacts as directional, not additive. The impact forecasts reflect baseline growth, mix effects, and variable interactions.
Connected Street Lighting Market Segment Analysis
By Component:
Software Gains as Predictive Analytics Monetize Sensor DataHardware captured 62% of the smart street lighting management systems market in 2025, while software and services are growing at 13.65% CAGR as cities adopt central management systems that enable remote control, firmware updates, and carbon-accounting dashboards. City platforms such as Interact and similar SaaS offerings have shifted spending from upfront capital to per-endpoint fees, allowing integration with traffic signals, EV chargers, and public safety feeds through secure APIs. At scale, operators manage millions of telemetry messages per day, which supports digital-twin models of each luminaire and improves service planning and availability metrics across fleets. Software’s share expansion also reflects policy that favors revenue-grade metering and verifiable emissions reporting in city sustainability plans. As sockets standardize via ANSI C136.41 and Zhaga Book 18, hardware becomes more interchangeable, which pressures pricing and elevates the role of software differentiation in the smart street lighting management systems market.
Services remain substantial as turnkey PPP contracts bundle installation, commissioning, and multi-year performance obligations, though growth trails software as more value shifts to analytics and automation. Predictive maintenance drives measurable O&M savings, converting reactive truck rolls into scheduled interventions that consolidate tasks and reduce time to repair. These trends continue to draw spend toward SaaS and integration services as the smart street lighting management systems industry uses APIs and standardized data models to share insights across city departments. Over 2026 to 2031, software-led gains are reinforced by policy incentives tied to metering and carbon disclosure, which helps sustain premium pricing for analytics features. This mix strengthens recurring revenue and cushions vendors against hardware margin compression in the smart street lighting management systems market.

By Connectivity:
Cellular Plug-and-Play Economics Challenge Proprietary RF Mesh IncumbencyProprietary RF mesh, including Wi-SUN and IEEE 802.15.4g, held a 55.5% connectivity share in 2025, while cellular controls are forecast to grow at a 13.73% CAGR as cities value simpler rollouts and carrier-grade uptime. In Washington, D.C., 75,000 lamp-level cellular controllers reduced deployment complexity while enabling real-time monitoring, eliminating gateway installation and maintenance. Standard device-management frameworks like LwM2M improve reliability and lifecycle control for large distributed endpoint fleets. LoRaWAN remains favored where long-range, low-throughput links are sufficient, and spectrum management is practical, particularly in site-constrained corridors that need battery-friendly endpoints. Project owners weigh subscription fees against gateway overhead, with many choosing cellular when workforce constraints and timelines dominate decision criteria in the smart street lighting management systems market.
RF mesh retains a role in utilities that prefer privately managed networks with deterministic behavior and long operational experience. Niche use cases include power-line communication in conduits where wireless performance is impaired, and Wi-Fi or short-range variants for campus settings that do not require street-scale range. The mix of technologies persists across regions, but interoperability and certification reduce lock-in and allow mixed fleets to be managed via a single CMS. As standards mature, more cities adopt dual-socket controllers to preserve choice in vendor selection and lifecycle upgrades, which keeps procurement competitive in the smart street lighting management systems market. This balance ensures continuity for existing RF networks while enabling cellular-first scale-outs that deliver the best total cost of ownership.
By Application:
Smart Parking and Environmental Sensing Monetize Installed InfrastructureTraffic optimization accounted for 28% of 2025 deployments as cities applied pole-mounted cameras and sensors to improve signal timing and incident detection across busy corridors. Smart parking is the fastest-growing application at 13.89% CAGR by leveraging the same edge hardware to generate curbside analytics and operational insights that can offset controller costs. Energy analytics and asset management deliver core value through real-time kWh monitoring and fault localization that reduces truck rolls and shortens outage duration. Environmental monitoring and communications backhaul continue to expand, using lighting columns to host air quality, microclimate, and connectivity services through open interfaces. Adaptive lighting tied to presence sensing supports public safety and energy reduction, with guidance available to stage pilots before citywide expansion.
Multi-application designs optimize return on infrastructure by serving multiple departments from a common platform. Cities also tap analytics for resilience planning, improving visibility into outages, traffic patterns, and event-driven demand surges on roads and sidewalks. Software-defined features become key differentiators, and open APIs enable third-party application ecosystems to grow around the lighting backbone. As a result, application portfolios will continue to expand during 2026 to 2031, reinforcing adoption in the smart street lighting management systems market. The ability to monetize new services while meeting safety and compliance priorities solidifies the role of lighting as a neutral host for city data services.
By End User:
Industrial Parks and ESCOs Scale Fastest as Lighting-as-a-Service Transfers Energy RiskMunicipalities dominate with 63% share in 2025, supported by replacement mandates, rebates, and energy-accountability targets that reward connected controls. Industrial parks and private campuses are the fastest-growing customers at 14.04% CAGR as operators integrate lighting with security and building systems for tenant experience and sustainability credentials. ESCO-led performance contracts are prevalent, offering guaranteed outcomes and service-level monitoring delivered through the central management platform. LaaS models offer zero-capex options that spread costs over multi-year terms and are anchored in verified energy and maintenance savings. Where utility regulations call for non-wires solutions, luminaire-level controls serve peak shaving and demand response to defer grid upgrades, which creates joint funding opportunities.
Public-private concessionaires bring program management discipline, integrating procurement, deployment, and performance dashboards into a single agreement to meet service targets. This shared-risk approach is valuable in cities with constrained borrowing capacity where long-term savings need to be securitized for investor comfort. Industrial parks value campus-scale connectivity and smart parking, which leverage the same lighting poles and network backbones, boosting adoption in the smart street lighting management systems market. As policies align around data access and portability, buyers demand contractual rights that preserve the flexibility to switch vendors without forfeiting historical data. These factors support diversified end-user growth during the forecast window.
By Deployment Model:
Cloud Migration Accelerates as APIs Federate Siloed SystemsCloud deployments held a 45% share in 2025 and are growing at a 13.67% CAGR as cities shift from on-premises CMS to SaaS platforms that guarantee uptime, enable remote updates, and expose standardized APIs. TALQ-compliant interfaces enable central platforms to aggregate data across lighting, traffic, and sensing, creating shared dashboards for multi-departmental operations. In regions with data-residency mandates, hybrid deployments keep sensitive telemetry local while pushing analytics to the cloud, which balances policy and operational flexibility. Vendors that demonstrate long-term commitment to open standards and data portability are favored in tenders that demand future-proofing. Interoperability reduces the total cost of ownership and accelerates the time to value in the smart street lighting management systems market.
On-premises systems persist where policy prohibits the cloud storage of critical infrastructure data, although device-level security and edge processing can often satisfy many requirements. As cities modernize, service-level guarantees and analytics features encourage contract structures that reward uptime and savings rather than perpetual licensing. Vendors demonstrate the value of cloud-first architectures through ecosystem partnerships that integrate cellular connectivity, small cells, and third-party applications into the lamppost. This momentum supports steady cloud penetration in the smart street lighting management systems market over the forecast horizon as standard APIs become the default. Procurement language increasingly codifies data access and switching rights, which fortifies buyer leverage and mitigates lock-in risk.
Geography Analysis
Europe Connected Street Lighting Market
Europe held a 65% installed-base lead in 2025, reflecting a decade of coordinated retrofits and policy support that elevated connected controls as a compliance tool and operational backbone for utilities. This share underscores a significant portion of the smart street lighting management systems market, with buyers prioritizing TALQ certification to manage multi-vendor fleets over long asset lives. Projects in Brussels and on national highways demonstrate how standardized interfaces ensure CMS interoperability across controllers and luminaires, reducing integration complexity. Field results from European deployments show large and measurable energy savings and maintenance reductions as connected LED programs scale. Compliance with evolving cybersecurity and data access rules is shaping procurement, which favors platforms built on open standards.
APAC Connected Street Lighting Market
Asia-Pacific is the fastest-growing region at a projected 14.12% CAGR as governments align investment for urban upgrades and corridor illumination across expanding megacities. India’s Smart Cities Mission channels significant funding to connected lighting, which stimulates city-scale procurement and multi-application use cases. Australia and New Zealand continue utility-led rollouts, with major cities planning second-generation LED replacements combined with smart controls to deepen savings and improve operations. Vendors adapt product designs to local requirements by balancing cellular and LPWAN coverage with dual-socket controllers to preserve vendor choice. This policy and technology mix strengthens adoption in the smart street lighting management systems market across both retrofit and greenfield deployments.
North America and Middle East Connected Street Lighting Market
In North America, large municipal and utility programs focus on fault detection, truck-roll reduction, and analytics-driven maintenance while tapping P3 structures for megaprojects. Chicago’s multi-year program highlights energy and rebate outcomes alongside CO2 reductions, which reinforces the value proposition for other cities. Washington, D.C.’s citywide modernization uses cellular controls and expands digital services on top of the lighting backbone to improve equity and uptime. Off-grid solar systems are also part of the toolkit to deter copper theft and speed restoration in high-risk corridors. In the Middle East, street lighting upgrades anchor larger smart infrastructure programs, with new contracts specifying intelligent transportation features and AI-enabled asset management. Dubai’s multi-year district lighting plan demonstrates how standards-based LED and controls are applied at scale to deliver energy and reliability gains. These patterns together indicate a broadening base for the smart street lighting management systems market across varied funding models and policy environments.

Regulatory Landscape
Regulation for connected street lighting is increasingly shaped by energy-efficiency rules, smart-city pole specifications, and public-sector data governance requirements. In China, recent national standards add concrete compliance anchors for both smart pole infrastructure and roadway luminaires, including GB/T 44408-2024 for intelligent multi-function pole systems and updates to roadway-lighting performance and application requirements such as GB/T 24827-2026 and GB/T 31832-2025 (implemented from Feb 2026). Energy efficiency is also being tightened via GB 37478-2025 for LED road and tunnel lighting, with an implementation date cited for June 2026, which reinforces retrofit cycles and certification-oriented procurement.
Grid-connected public lighting is also facing more explicit utility-style oversight in some jurisdictions. In April 2026, the Puerto Rico Energy Bureau issued a draft regulation on municipal participation in public street lighting connected to the electric grid, explicitly framing smart street lighting as systems incorporating remote control, energy monitoring, or fault detection. Alongside standards adoption, such as IEC TR 63540:2024 for outdoor lighting systems in smart-city contexts, and road authority design manuals used in public works, these developments push tenders toward defined technical interfaces, verifiable energy performance, and clearer responsibilities for cybersecurity, data access, and operations.
Value Chain Analysis
The value chain spans luminaire and control hardware (LED luminaires, drivers, Zhaga/ANSI sockets, controllers, sensors), communications layers (RF mesh, LoRaWAN, and rising cellular NB-IoT/LTE-M), and central management software delivered via cloud, on-premises, or hybrid deployments. Installation and commissioning are typically delivered through electrical contractors, ESCOs, and PPP concessionaires, while value is captured through software subscriptions, device management, and maintenance services tied to uptime and measured savings. Carrier participation is increasing where cellular controllers reduce gateway footprint and help speed rollouts, bringing telecom operators and their device-management ecosystems into procurement decisions.
Standards bodies and certification programs play a coordinating role by reducing multi-vendor integration friction and enabling lifecycle upgrades without full fixture replacement. The DALI Alliance, TALQ Consortium, and Zhaga Consortium formalized collaboration (Oct 2024) and in 2026 published joint technical work, including new TALQ profiles aligned to DALI D4i and Zhaga, supporting a more modular ecosystem across luminaires, sensors, and CMS platforms. Recent projects show multi-party delivery models, such as NB-IoT deployments in Spain involving Telefonica with infrastructure partners (Ferrovial Energia and Iberdrola Clientes) and roadway modernization programs in Belgium bringing together Fluvius and multiple technology providers (including Itron, Flashnet, and inteliLIGHT) around standardized interfaces and carrier-grade connectivity.
Competitive Landscape
Competition centers on interoperability, lifecycle services, and the breadth of platform features that monetize the lighting backbone. Signify’s acquisition of Telensa expanded access to a large installed base and strengthened its connected lighting software stack and street-level device portfolio. Itron advances IPv6-based networks and SaaS, while multi-vendor certification through TALQ reduces customer lock-in concerns and supports mixed fleets over long asset lives. Flashnet emphasizes ANSI-Zhaga dual-socket controllers to serve North American and European retrofit needs. Many suppliers frame the pole as a service platform for connectivity, sensing, and future apps, which aligns with small-cell partnerships and neutral-host models. This competitive angle reinforces the smart street lighting management systems market as an anchor for city data services.
Companies differentiate with AI-driven maintenance, edge compute attachments, and data-sharing guarantees that support multi-application operations. Ubicquia’s recent platform updates add AI video accessories that run on existing infrastructure to provide curb analytics and adaptive lighting. Vendors position standard device models and management protocols to accelerate troubleshooting and reduce mean time to repair, which improves service-level performance. Partnerships between lighting firms and connectivity providers signal that neutral-host strategies will expand where poles can host small cells with minimal street clutter. Standards organizations continued to harmonize interfaces across controllers, luminaires, and CMS, which lowers integration risk and enables phased upgrades. This supports broader adoption in the smart street lighting management systems market as procurement criteria emphasize open architectures.
M&A and joint ventures are shaping regional footprints and local manufacturing strategies that serve policy goals and supply-chain resilience. Signify and Dixon Technologies formed a joint venture to expand LED and connected lighting manufacturing capacity in India, aligning with domestic production goals. Solar lighting specialists extend reach in theft-prone or power-scarce corridors by eliminating trenching and offering resilient alternatives that deploy quickly. City-led programs that center on measurable energy reductions and equity considerations further shape buying criteria, which favors platforms with verifiable savings and open interfaces. Collectively, these strategic moves help define competitive positions in the smart street lighting management systems market as it expands across varied urban and policy contexts.
Connected Street Lighting Industry Leaders
-
Signify N.V.
-
Itron, Inc.
-
Fonda Technology Co., Ltd.
-
Ubicquia, Inc.
-
Schréder S.A.
- *Disclaimer: Major Players sorted in no particular order
Connected Street Lighting Market Companies Covered in this Report
- Signify N.V.
- Itron, Inc.
- Fonda Technology Co., Ltd.
- Flashnet S.A. (Lucy Group)
- Ubicquia, Inc.
- Schrader S.A.
- Dimonoff Inc.
- LED Roadway Lighting Ltd.
- Rongwen Energy Technology Group Co., Ltd.
- ST Engineering Telematics Wireless Ltd.
- Lucy Zodion Ltd.
- Trilliant Networks, Inc.
- CIMCON Lighting, Inc.
- Sensus USA Inc. (Xylem)
- LACROIX Group SE (Citylone)
- Umpi S.r.l.
- Current Lighting Solutions, LLC
- Telensa Ltd.
- Tvilight B.V.
- Quantela Inc.
Market Opportunities and Future Outlook
Large-scale replacement and modernization programs remain a primary whitespace driver because they combine LED upgrades with controllability, metering, and operations software rather than basic illumination retrofits. Evidence of this shift includes utility and government-scale commitments in 2026: Georgia Power selected ST Engineering Telematics Wireless to deploy 50,000 cellular NB-IoT lighting control units, Delhi approved a plan to replace 96,000 streetlights with smart LED systems, and Emcali opened a tender in Cali, Colombia for 101,037 smart LED streetlights within a broader 186,000-light network target. These programs pull demand through the stack for interoperable controllers, CMS platforms, and field services, while also making procurement language more explicit around device management, reporting, and multi-year performance.
A second opportunity band is the shift from scheduled dimming to sensor-driven, multi-application operations that monetize the pole as a data and services platform. Signify and Liverpool City Council launched a traffic-adaptive lighting project using Interact City tied to traffic sensors, illustrating adoption of real-time control as a defined project deliverable rather than a pilot add-on. Meanwhile, clearer oversight frameworks for grid-connected municipal lighting, including the Puerto Rico Energy Bureau draft regulation (April 2026), and maturing interface standards (IEC TR 63540:2024 alongside DALI, TALQ, and Zhaga alignment) create room for vendors that can deliver auditable energy monitoring, data portability, and multi-vendor fleet management under public-sector governance constraints.
Recent Industry Developments in Connected Street Lighting Market
- May 2026: Signify and Liverpool City Council launched a traffic-adaptive street lighting project for the city's waterfront area using LumiStreet Gen2 luminaires and the Interact City central management system linked to traffic sensors. The project elevates connected lighting from remote control to real-time, sensor-driven operations, reinforcing the role of software and data integration in tender requirements.
- November 2025: Itron extended its collaboration footprint in smart street lighting by working with Connected Lighting Solutions to expand smart lighting infrastructure in Australia. The move broadens Itron's partner ecosystem and supports larger, end-to-end deployments that combine controllers, networks, and managed services.
- November 2024: Itron announced a 10-year contract extension with Cielis to manage approximately 200,000 smart streetlights in Paris, France. The long-term renewal underscores the importance of lifecycle operations, platform continuity, and performance-based management at city scale.
Connected Street Lighting Market Report Scope and Research Methodology
Market Definition and Coverage
The connected street lights market covers networked outdoor street lighting that can be remotely monitored and controlled through a central management platform, usually to improve energy savings, uptime, and maintenance planning. Revenues are counted across the solution stack that enables connectivity and control.
Scope exclusions: Traditional standalone street lights without any networking or remote-control capability are excluded, and civil works that are not directly tied to lighting connectivity are not counted.
Segments Covered in This Report
- By Component
- Hardware
- Software
- Services
- By Connectivity
- RF Mesh (Wi-SUN, IEEE 802.15.4g)
- Cellular (NB-IoT, LTE-M, 4G/5G)
- LoRaWAN
- Power-Line Communication (PLC)
- Wi-Fi and IEEE 802.15.4
- By Application
- Smart Dimming and Policy-Based Scheduling
- Adaptive and Autonomous Lighting (Sensor-Driven)
- Traffic and Safety Analytics Enablement
- Energy Analytics and Asset Management
- Environmental and Microclimate Monitoring
- Public Wi-Fi and Communications Backhaul
- By End User
- Municipalities and Local Governments
- Electric Utilities and Distribution System Operators
- Energy Service Companies (ESCOs)
- Public-Private Concessionaires (PPP Models)
- Private Campuses and Industrial Parks
- By Deployment Model
- Cloud
- On-Premises
- Geography
- North America
- United States
- Canada
- South America
- Brazil
- Argentina
- Rest of South America
- Europe
- Germany
- France
- United Kingdom
- Italy
- Spain
- Russia
- Rest of Europe
- Asia-Pacific
- China
- Japan
- India
- South Korea
- Australia
- Rest of Asia-Pacific
- Middle East
- Saudi Arabia
- United Arab Emirates
- Turkey
- Rest of Middle East
- Africa
- South Africa
- Egypt
- Kenya
- Rest of Africa
- North America
Data Sources, Market Sizing, and Validation
Desk Research
Desk research was used to frame the demand pool and keep the model tied to rollout signals that can be observed publicly. We reviewed smart city and energy-efficiency policy documents, such as city procurement portals, national energy agency publications, and standards bodies that publish lighting and wireless specifications.
To quantify adoption and replacement cycles, we referenced sources such as national and city open-data portals on streetlight inventories, trade and customs statistics for lighting equipment flows, technical papers in peer-reviewed journals on LED and control-node performance, and utilities or municipality annual reports that disclose capex programs. Company filings, investor presentations, and reputable press coverage were also used to track project timing and pricing direction. Paid subscriptions were then used selectively for company financials and intelligence, news and financials, patent databases, and an import-export shipment-level database. The examples of desk sources listed above are illustrative and not exhaustive, and many other sources were used to collect data, validate assumptions, and clarify gaps.
Primary Interviews and Surveys
Primary conversations were used to confirm what typically gets sold as a connected street lighting deployment and what is priced as an add-on (for example, sensors, gateways, and software subscriptions). We also stress-tested assumptions on retrofit cycles, node-per-luminaire configurations, and how projects are budgeted across municipalities, utilities, and delivery partners across APAC, EMEA, and the Americas.
Distribution of primary research fieldwork respondents
| Company type | Respondent position | Region |
|---|---|---|
| Top tier: 26% | CXOs: 15% | APAC: 45% |
| Mid tier: 56% | Functional/Unit leaders: 25% | EMEA: 30% |
| Smaller Players: 18% | Managers: 60% | Americas: 25% |
Market-Sizing & Forecasting
Market sizing was built using a top-down approach where installed streetlight bases, LED conversion rates, and smart control penetration were combined to reconstruct connected-node demand by region, and then converted to revenue using realistic pricing and service attach rates. Since project reporting is uneven, totals were checked against selective bottom-up approximations, such as sampling tender-awarded project counts, typical luminaires per project, and average selling prices for control nodes, gateways, and software subscriptions.
Inputs that shaped the model included municipal smart city budgets and tender timing, the pace of LED retrofit programs, connectivity choices used in deployments (RF mesh, cellular NB-IoT or LTE-M, PLC, and similar), average nodes per luminaire and gateway density, and the share of ongoing software and maintenance services. When project-level data was missing, conservative fill rates were used based on peer cities, and then the assumption was re-tested in follow-up calls. For forecasting, scenario analysis was used to reflect different funding and rollout speeds, and the scenarios were anchored to expert consensus on replacement cycles, energy cost sensitivity, and procurement momentum.
Data Validation & Update Cycle
Outputs were validated by comparing modeled results with independent signals, including the direction of public procurement awards, reported smart city program progress, and shifts in connectivity and control-node mix. Where values looked unusual, unit economics, currency timing, and regional adoption assumptions were rechecked, followed by an additional review before sign-off.
The report is refreshed annually, and interim updates are triggered when material events occur, such as major policy changes, large multi-city tenders, or sharp pricing shifts in lighting and controls. Before delivery, a fresh review pass is completed so clients receive the latest consistent view across the model and narrative.
Mordor Intelligence's Connected Street Lights Market Size Versus Other Published Estimates
Published numbers for connected street lights often vary because firms do not count the same items, and they also differ on how fast deployments scale over time. The gaps usually come from what is included in the solution stack, how services are treated, and how pricing and penetration are projected.
The main gap comes from whether adjacent smart city applications are bundled into the street lighting total and how control software subscriptions are annualized. Mordor Intelligence counts revenue only when it is tied to connected streetlight control hardware plus the associated platform and services. Some published figures also use a different base year and then extrapolate aggressively across regions, which can lift totals when procurement cycles slow or retrofit timing shifts.
Benchmark comparison
| Source | Market Size | Gaps in Research Methodology |
|---|---|---|
| Mordor Intelligence | USD 2.56 B (2026) | |
| Global Consultancy A | USD 4.87 B (2026) | This estimate appears to use a broader smart street lighting definition that can include more smart city feature value per pole, and it can assume faster uptake of advanced controls, which increases revenue per installed light. |
| Industry Research Publisher B | USD 5.32 B (2025) | This figure is reported for a different base year and is presented with a wider application set beyond lighting control, so the implied revenue per deployment can rise when surveillance, parking, or public messaging systems are included. |
Across the three values, the spread is mainly explained by scope and timing rather than small math differences. By keeping the model traceable to installed streetlight counts, retrofit and connectivity adoption rates, and realistic service attachment, the market value stays easier to reproduce and to re-check as new tenders and programs are announced.
Key Questions Answered in the Report
What is the current size and growth outlook of the smart street lighting management systems market?
The smart street lighting management systems market size is USD 2.56 Billion in 2026 and is projected to reach USD 4.82 Billion by 2031 at a 13.49% CAGR.
Which component category leads and which is growing fastest in this market?
Hardware leads with a 62% share in 2025, while software and services are growing fastest at a 13.65% CAGR as buyers prioritize analytics and remote operations.
Which connectivity approach is gaining momentum in smart street lighting?
Cellular options such as NB-IoT and LTE-M are expanding at a 13.73% CAGR due to plug-and-play deployment and reduced gateway overhead, challenging proprietary RF mesh incumbents.
Which applications are seeing the strongest uptake on smart lighting poles?
Traffic optimization led with 28% of deployments in 2025, while smart parking is the fastest-growing use case enabled by the same edge compute and sensors on poles.
Which regions are leading and which are expanding fastest?
Europe held a 65% installed-base lead in 2025, while Asia-Pacific is projected to be the fastest-growing region at a 14.12% CAGR over the forecast period.
What deployment model are cities preferring for management software?
Cloud models held a 45% share in 2025 and are gaining further traction due to open APIs, uptime guarantees, and easier integration with adjacent city systems.