
Connected Medical Device Market Size and Share
Market Overview
| Study Period | 2020 - 2031 |
|---|---|
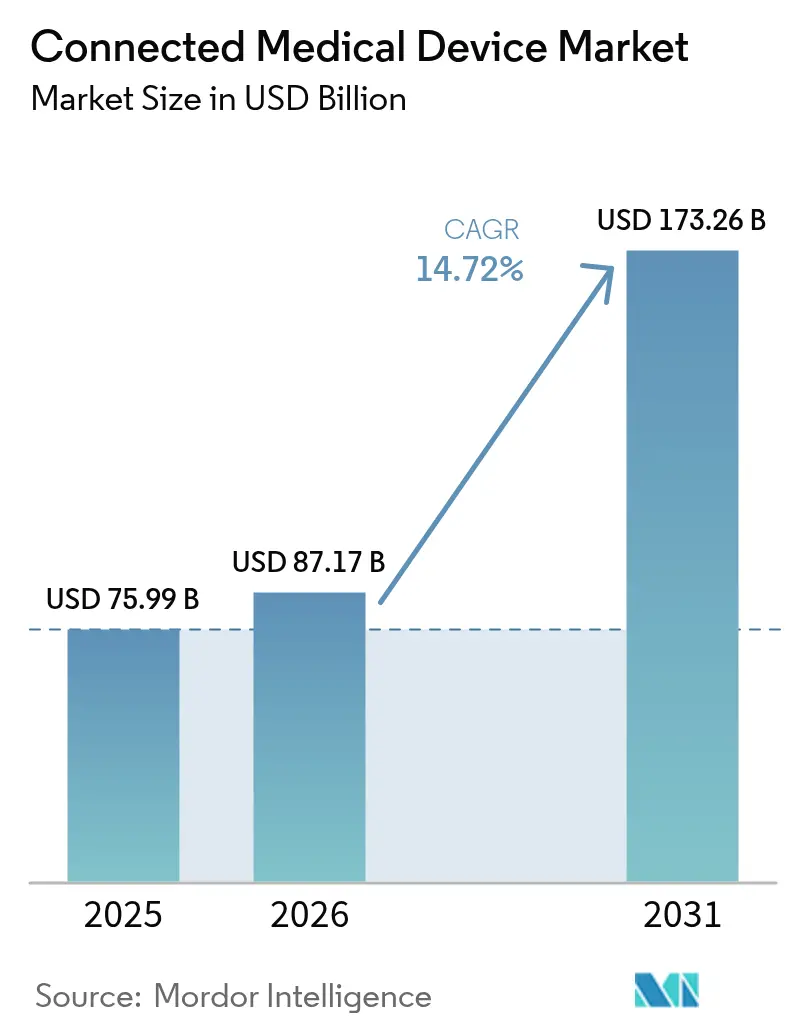
| Market Size (2026) | USD 87.17 Billion |
| Market Size (2031) | USD 173.26 Billion |
| Growth Rate (2026 - 2031) | 14.72% CAGR |
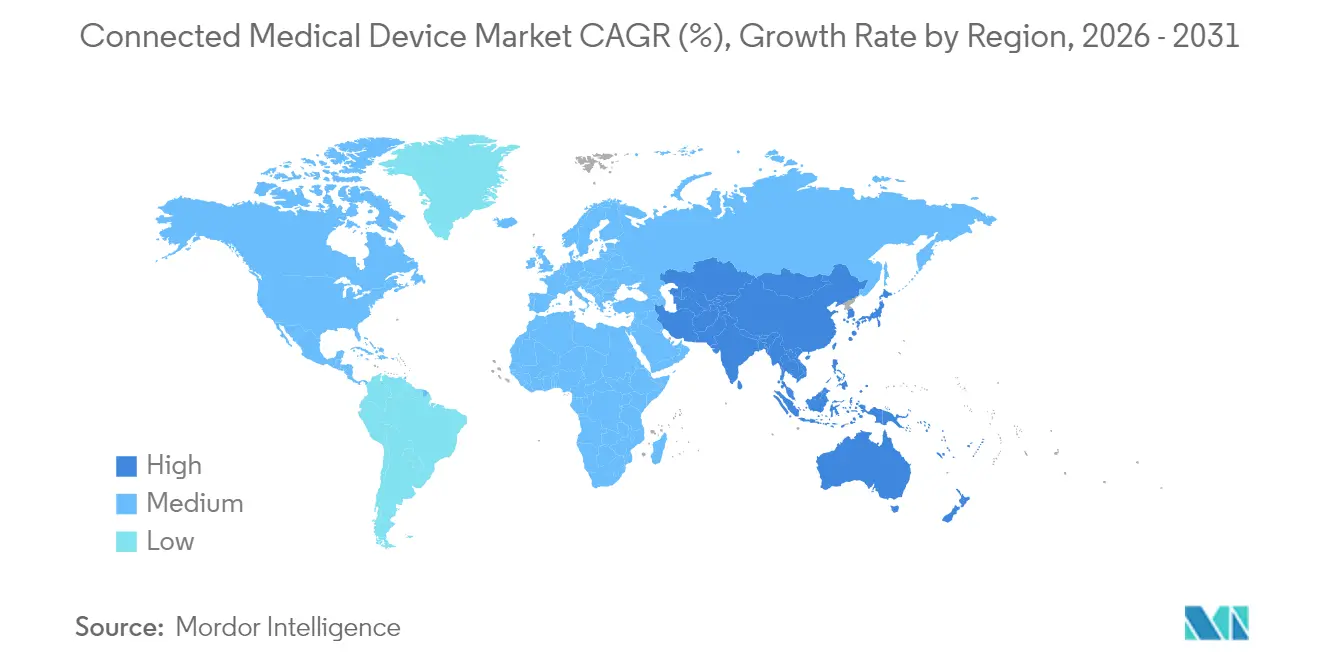
| Fastest Growing Market | Asia Pacific |
| Largest Market | North America |
| Market Concentration | Low |
Major Players *Disclaimer: Major Players sorted in no particular order Image © Mordor Intelligence. Reuse requires attribution under CC BY 4.0. | |
Connected Medical Device Market Analysis by Mordor Intelligence
The Connected Medical Devices market size was valued at USD 75.99 billion in 2025 and estimated to grow from USD 87.17 billion in 2026 to reach USD 173.26 billion by 2031, at a CAGR of 14.72% during the forecast period (2026-2031). Continuous reimbursement expansion, rapid 5G roll-outs, and aggressive AI integration are reshaping purchase criteria, accelerating the shift from episodic encounters to longitudinal care relationships. Component miniaturization and falling sensor costs have lowered entry barriers for new form factors, giving providers economically viable options for monitoring chronic conditions outside hospital walls. Meanwhile, major manufacturers are embedding cybersecurity-by-design features that pre-empt emerging regulations, helping buyers satisfy institutional risk-management requirements without delaying deployment. Intensifying ecosystem partnerships between device makers, telecom operators, and analytics vendors are fostering bundled service models that generate stickier recurring revenue streams and reinforce first-mover advantages in the Connected Medical Devices market.
Key Report Takeaways
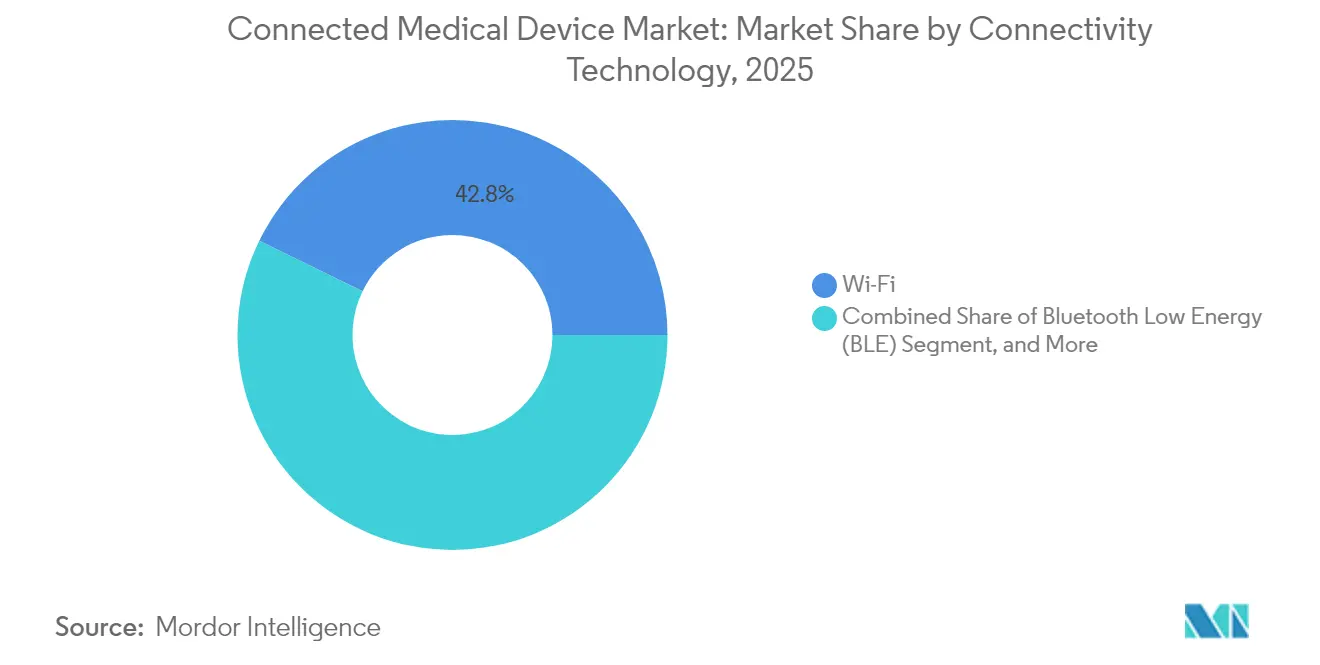
- By connectivity technology, Wi-Fi held a 42.78% share of the market in 2025, while 5G Cellular is projected to post a 26.95% CAGR through 2031.
- By device type, Wearable External Devices accounted for a 62.88% share in 2025, while Implantable Smart Pumps are expected to grow at a CAGR of 18.12% through 2031.
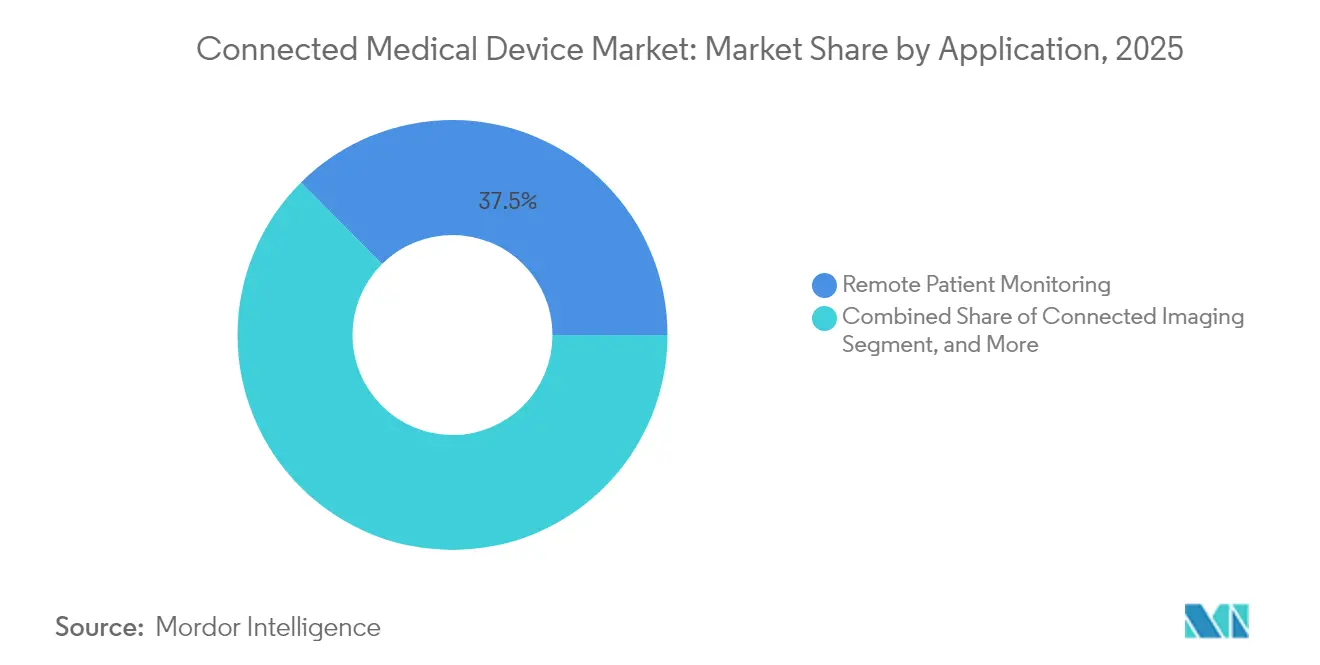
- By application, Remote Patient Monitoring captured a 37.45% market share in 2025, while Tele-ICU / Interactive Medicine is forecasted to expand at a 26.68% CAGR through 2031.
- By end user, Hospitals & Health Systems dominated with a 64.92% share in 2025, while Home-care Settings are anticipated to grow at a CAGR of 20.58% through 2031.
- By geography, North America led with a 40.42% market share in 2025, while Asia-Pacific is expected to post a 26.58% CAGR through 2031.
Note: Market size and forecast figures in this report are generated using Mordor Intelligence’s proprietary estimation framework, updated with the latest available data and insights as of 2026.
Global Connected Medical Device Market Trends and Insights
Drivers Impact Analysis*
| Driver | (%) Impact on CAGR Forecast | Geographic Relevance | Impact Timeline |
|---|---|---|---|
| Real-time patient monitoring reimbursement | +3.2% | North America and spillover to EU | Medium term (2-4 years) |
| Falling sensor and connectivity costs | +2.8% | Global with early gains in APAC manufacturing hubs | Long term (≥ 4 years) |
| 5G and LPWAN deployment | +4.1% | Global led by North America and APAC core markets | Medium term (2-4 years) |
| AI-powered predictive analytics | +3.5% | Global with regulatory leadership in North America | Long term (≥ 4 years) |
| Shift to home-based chronic care | +2.7% | Global, accelerated in North America and Europe | Short term (≤ 2 years) |
| Institutional demand for interoperable data | +2.1% | Global with early adoption in North America and EU | Medium term (2-4 years) |
| Source: Mordor Intelligence | |||


Expansion of Real-Time Patient Monitoring via RPM Reimbursement
Medicare’s 2024 decision to widen billing codes 99453-99458 created a dependable revenue path that convinced health systems to scale continuous monitoring programs for high-risk chronic cohorts.[1]Abbott Press Center, “FreeStyle Libre 3 Miniaturization Milestone,” abbott.comDevice makers that can document reduced readmissions now enjoy accelerated value-analysis approvals, especially for diabetes and cardiac applications where outcomes are easily quantified. Pay-for-performance incentives are cascading to private payers, further boosting unit demand as providers seek turnkey platforms that integrate devices, dashboards, and clinical services. The resulting uptick in Connected Medical Devices market orders is strongest among integrated delivery networks that bear shared savings risk.
Falling Sensor and Connectivity Costs Enabling Device Miniaturization
MEMS component prices have declined roughly 15-20% a year since 2020, allowing suppliers to pack multiple sensing modalities into postage-stamp-sized packages and still protect margins. Abbott’s FreeStyle Libre 3 sensor, currently one of the smallest mass-produced devices in its class, illustrates how suppliers are translating cost curves into discreet wearables with 14-day battery life. Lower bill-of-materials costs expand eligibility in public procurement tenders across Asia-Pacific, where cost-effectiveness benchmarks remain stringent. Smaller footprints also drive adherence gains because patients can wear devices unobtrusively during daily routines, reinforcing long-term retention in subscription monitoring programs.
5G and LPWAN Deployment Unlocking Ultra-Low-Latency Clinical Use Cases
Commercial 5G networks now achieve sub-10 millisecond latency in tier-one markets, letting surgeons receive haptic feedback during remote procedure guidance, while LPWAN protocols ensure weeks-long battery life for rural maternal-health monitors. The FDA’s Software-as-a-Medical-Device guidance explicitly references network-dependent algorithms, giving vendors predictable documentation templates for their 5G-ready devices. Countries funding nationwide 5G backbones, notably Japan and South Korea, are embedding clinical quality-of-service targets into telecom licenses, thereby aligning carrier economics with healthcare performance goals and indirectly accelerating Connected Medical Devices market rollout.
AI-Powered Predictive Analytics Improving Device Value Proposition
Boston Scientific’s DIRECTSENSE technology shows how impedance-based AI models can steer ablation catheters in real time to cut arrhythmia recurrence without increasing procedure time. The FDA’s Predetermined Change Control Plan lets manufacturers update inference models post-clearance, shrinking iteration cycles and sustaining competitive differentiation. Health systems strained by specialist shortages are now piloting algorithmic triage that flags device data outside personalized thresholds, freeing clinicians to manage growing caseloads. Predictive insights also feed insurer risk-scoring engines, enabling premium discounts that spur broader patient enrollment in connected monitoring pathways.
Restraints Impact Analysis*
| Restraint | (%) Impact on CAGR Forecast | Geographic Relevance | Impact Timeline |
|---|---|---|---|
| Legacy proprietary platforms | -2.3% | Global with acute challenges in North America and EU | Long term (≥ 4 years) |
| Rising cybersecurity breaches | -1.8% | Global with regulatory focus in EU and North America | Medium term (2-4 years) |
| Regulatory complexity for new device classes | -1.5% | Global with highest barriers in EU and North America | Long term (≥ 4 years) |
| Bandwidth constraints in underserved areas | -1.2% | Global with acute challenges in emerging markets | Medium term (2-4 years) |
| Source: Mordor Intelligence | |||
Legacy Proprietary Platforms Hindering Interoperability
Hospitals that still run siloed bedside monitors face double-entry workflow and steep integration fees whenever a new connected module is introduced. Although HL7 FHIR promises data liquidity, uneven vendor adoption forces providers to rely on middleware that drives up total cost of ownership and slows refresh cycles. Procurement teams, wary of stranded-asset risk, often restrict tenders to suppliers with proven open-API roadmaps, limiting market access for niche innovators and tempering broader Connected Medical Devices market growth.
Rising Cybersecurity Breaches Targeting IoMT Endpoints
Successful ransomware exploits against infusion pumps and cardiology monitors in 2024 heightened board-level scrutiny of IoMT risk management. The European MDR now obliges manufacturers to submit software bill-of-materials documentation, increasing pre-market expenses for startups without dedicated security engineering teams. Hospitals are imposing stringent device-hardening checklists that lengthen evaluation cycles, delaying revenue recognition for suppliers even when clinical value is demonstrated. Vendors that can show ISO 27001 certification and routine penetration-test results are gaining procurement preference but must absorb higher ongoing compliance costs.
*Our forecasts treat driver/restraint impacts as directional, not additive. The impact forecasts reflect baseline growth, mix effects, and variable interactions.
Segment Analysis
By Connectivity Technology: 5G Extends Clinical Reach
In 2025, Wi-Fi accounted for 42.78% of the Connected Medical Devices market share because most acute-care facilities already possess enterprise WLAN architectures. The same year, 5G began its breakout trajectory, fueled by telecom capital spending that reached USD 140 billion across Asia-Pacific. Ultra-low latency gives electrophysiology labs confidence to stream HD cardiac mapping data for off-site consultation, while LPWAN modules shrink battery packs in neonatal monitors to fit inside wearable swaddles. Satellite IoT backfills outages during disaster-response missions, ensuring 99.999% uptime mandated in trauma-center service-level agreements.
Accelerated 5G adoption signals a structural pivot in the Connected Medical Devices market from fixed stations toward location-agnostic analytics platforms. As spectrum licenses migrate to open-RAN frameworks, device makers gain flexibility to embed carrier-agnostic SIMs that auto-provision in multiple jurisdictions, streamlining global product launches. Regulatory alignment under ITU guidelines curbs custom radio-frequency testing, trimming certification lead times by up to three months and expediting entry in the fastest-growing export markets.


By Device Type: Wearables Anchor Volume While Implantables Scale Value
Wearable external devices controlled 62.88% of the Connected Medical Devices market share in 2025, underpinned by consumer familiarity with smartwatch interfaces. Implantable smart pumps, however, are on track for an 18.12% CAGR as wireless charging pads lengthen replacement intervals and bioresorbable casings ease surgical removal anxiety. Disposable ingestibles occupy a tactical niche for short-horizon infection surveillance during chemotherapy cycles, whereas stationary monitors remain indispensable for telemetry wards that demand waveform fidelity exceeding consumer-grade specifications.
Implantables appeal to payers because continuous dose-adjusting algorithms can cut drug wastage by double digits, delivering quantifiable savings that justify higher upfront capital outlays. Wearable makers, meanwhile, are scaling cloud subscription tiers that bundle algorithm updates, secure storage, and multilingual coaching to lock in annuity revenue. Over time, miniaturization advances are expected to blur category boundaries, birthing semi-implantable patches that combine the self-administration ease of wearables with the adherence benefits of fully embedded systems.
By Application: Tele-ICU Spurs Critical-Care Transformation
Remote patient monitoring held a commanding 37.45% of the Connected Medical Devices market in 2025 because it demonstrated fast ROI by cutting readmissions for COPD and heart-failure cohorts. Tele-ICU and interactive medicine platforms, projected to rise at a 26.68% CAGR, help regional hospitals access critical-care specialists without relocating patients, addressing staffing gaps that expanded during the pandemic. Medication-management modules using NFC-tagged blister packs show double-digit adherence uplift, translating into fewer adverse drug events and lower payer penalties.
In parallel, connected imaging suites now transmit near-lossless 3D reconstructions to cloud AI engines that pre-classify findings for radiologist review, shaving minutes off average report turnaround time. Workflow-automation dashboards overlay device telemetry on bed-availability maps, letting charge nurses redeploy assets in real time, which enhances patient throughput and staff satisfaction. The pipeline also includes preventive-care apps that nudge high-BMI users toward lifestyle interventions, illustrating how the application mix is migrating upstream into wellness and downstream into acute intervention zones.
By End User: Home Care Gains Momentum
Hospitals and health systems still represent 64.92% of the Connected Medical Devices market orders because capital budgets and cybersecurity policies align with large enterprise purchasing processes. Yet home-care environments are predicted to log a 20.58% CAGR as aging populations demand chronic-condition support that avoids costly readmissions. Ambulatory surgical centers deploy connected monitors to extend post-procedure vigilance without prolonging inpatient stays, unlocking more room turnover per day while maintaining safety metrics. Research laboratories, meanwhile, integrate device APIs into data lakes that feed real-world evidence studies required for post-market surveillance.
Payers in North America now reimburse home-based cardiac telemetry for post-TAVR patients, validating remote monitoring’s cost-avoidance thesis. Defense agencies are piloting ruggedized biosensors that track soldier vitals during extended field deployments, a use case that offers suppliers stable long-term contracts while advancing edge analytics maturity. As digital therapeutics coalesce with monitoring hardware, direct-to-consumer channels will likely open another front in the Connected Medical Devices market, further broadening the end-user spectrum.
Geography Analysis
North America commanded 40.42% of 2025 revenue thanks to Medicare coverage expansion and FDA fast-track pathways that lowered approval times for AI-enabled devices. High EHR penetration and robust private-payer reimbursement let providers integrate new sensors without complex interface redevelopment, reinforcing regional adoption speed. The region also hosts the largest installed base of 5G-ready hospital campuses, giving suppliers an ideal launchpad for low-latency applications such as robotic bronchoscopy guidance.
Asia-Pacific is the fastest-growing territory, registering a 26.58% CAGR through 2031 on the back of USD 140 billion in healthcare digitization programs and regulatory harmonization under the International Medical Device Regulators Forum. China’s streamlined priority-review channel has slashed approval timelines for innovative cardiology devices, stimulating domestic R and D investment and luring multinational joint ventures. In India, public-private partnerships are underwriting tele-ICU pilots across tier-2 cities, validating Connected Medical Devices market economics in value-constrained settings.
Europe shows steady expansion as the Medical Device Regulation enforces a single conformity framework, allowing vendors to amortize compliance costs over a larger addressable base. However, tougher clinical-evidence thresholds elongate dossier preparation, prompting many SMEs to seek notified-body slots two years in advance to avoid bottlenecks. Middle East and Africa and South America still trail on absolute spending but are fast upgrading telecom infrastructure, particularly in oil-funded Gulf states and Brazil’s primary-care revamp, creating emerging pockets of high growth for telemetry solutions.

Regulatory Landscape
Connected medical devices are governed by medical-device rules, with layered requirements for software, cybersecurity, and clinical data handling. In the United States, the FDA updated its guidance, "Cybersecurity in Medical Devices: Quality System Considerations and Content of Premarket Submissions" on February 3, 2026, reinforcing cybersecurity controls as part of the Quality Management System and reflecting statutory expectations for connected "cyber devices" under Section 524B of the FD&C Act. These requirements place more weight on secure development, disclosure processes, and premarket cybersecurity documentation for networked devices used in RPM, Tele-ICU, and hospital monitoring.
In Europe, MDR conformity assessment and notified-body operations continue to tighten. Commission Delegated Regulation (EU) 2026/1359 (adopted March 20, 2026) amends elements of MDR related to class IIb implantable-device documentation exemptions, while Commission Implementing Regulation (EU) 2026/977 (adopted May 4, 2026) sets uniform quality management and procedural requirements for notified-body assessments under MDR and IVDR. Globally, the IMDRF published the "Playbook for Medical Device Regulatory Reliance Programs" (IMDRF/GRRP WG/N89 FINAL: 2026) on February 26, 2026, signaling momentum for reliance-based approaches that can reduce duplicative assessments across jurisdictions for multinational connected-device portfolios.
Value Chain Analysis
The connected medical device value chain begins with sensor, semiconductor, and connectivity-module suppliers (Wi-Fi, BLE, cellular/LPWAN, and increasingly 5G), then moves to OEM design and manufacturing under medical-device QMS controls. From there, software development covers device firmware, cloud platforms, analytics, and integration middleware. Distribution and deployment are typically routed through hospital purchasing organizations, channel partners, and service providers that support provisioning, onboarding, and clinical workflow integration, with reimbursement pathways (notably RPM programs) shaping which device-plus-software bundles scale.
Because connected devices span multiple care settings, interoperability layers (EHR integration, APIs, and data models) and ongoing lifecycle support (patching, monitoring, and remote diagnostics) are key value-adding steps alongside hardware production. Bottlenecks increasingly appear in regulated software operations and post-market change management rather than in physical logistics. Cybersecurity-by-design expectations and OTA update governance link suppliers, OEMs, and software vendors to shared documentation and quality processes, pushing firms to align regulatory and product data management across PLM, eQMS, ERP, and RIMS to preserve traceability (including UDI and certificates where applicable). The 2026 shift toward QMS-aligned cybersecurity and more standardized conformity-assessment practices raises the role of compliant contract manufacturers, validated software toolchains, and integration partners that can reduce deployment friction for hospitals and home-care programs.
Competitive Landscape
Top Companies in Connected Medical Device Market
The Connected Medical Devices market remains moderately fragmented, with the top five suppliers controlling well under 40% of global revenue, a distribution that continues to invite specialist entrants. Medtronic, Abbott, and Philips leverage decades of clinical trial data and deep regulatory benches to defend core franchises while partnering with telecom carriers for managed-service add-ons. Abbott and Medtronic’s 2024 integration pact that weds FreeStyle Libre sensors with automated insulin pumps underscores a trend toward coopetition aimed at delivering seamless patient journeys. [2]Abbott, “Global CGM Partnership with Medtronic,” abbott.com
Tech-adjacent firms such as GE HealthCare and Cisco are exporting cloud orchestration and network-security prowess to carve niches in imaging analytics and Zero-Trust medical LANs. Edge-computing startups focus on inference-at-sensor designs that lower cloud bandwidth costs and address data-sovereignty rules in Europe and the Middle East. Boston Scientific’s SMART Pass algorithm upgrade for its S-ICD platform illustrates how software refreshes can generate new clinical claims without hardware redesign, prolonging product lifecycles and protecting share against monitor-agnostic wearable entrants.[3]Boston Scientific, “SMART Pass Clinical Data,” bostonscientific.com
M&A appetite is expected to rise as interoperability standards mature and MDR cyber clauses escalate compliance overhead, tilting the advantage toward players that can amortize certification expense across multiple product lines. Valuations now increasingly factor in AI talent pools and proprietary datasets, making data-rich startups attractive bolt-on targets for incumbents seeking to reinforce algorithm development pathways.
Connected Medical Device Industry Leaders
Honeywell International Inc.
GE HealthCare Technologies Inc.
Abbott Laboratories
Medtronic plc
Koninklijke Philips N.V.
- *Disclaimer: Major Players sorted in no particular order


Market Opportunities and Future Outlook
Interoperability and platform integration remain a significant whitespace area, since providers continue to incur costs and delays when onboarding new connected endpoints into clinical workflows. HL7 International launched the Caliper FHIR Accelerator on May 24, 2026 to support standardized, real-time medical device data interoperability across clinical and home settings, which reinforces buyer preference for device ecosystems that reduce integration burden and improve data portability. Vendors that bundle connected devices with FHIR-aligned data pipelines, device identity management, and enterprise-grade security controls can differentiate in hospital and health-system tenders that emphasize open interfaces over legacy proprietary stacks.
A second opportunity sits in connected therapy and decision-support adjacencies where device data, imaging, and procedural systems are being linked into longitudinal care pathways. In 2026, multiple in-scope moves reflect this direction: Medtronic expanded its alliance with GE HealthCare to integrate monitoring technologies into broader platforms, and Philips emphasized connecting patient monitoring and diagnostics into platform-based care intelligence. As cybersecurity and quality requirements continue to formalize, suppliers that operationalize secure post-market updates, fleet management, and real-world evidence generation can shorten buyer evaluation cycles and support broader deployment across home-care settings, Tele-ICU programs, and high-acuity hospital monitoring.
Recent Industry Developments
- July 2026: Philips introduced the Alturion ultrasound system with AI-powered workflows after receiving U.S. FDA 510(k) clearance and CE mark. The launch strengthens AI-enabled connected imaging workflows in high-volume clinical environments and supports platform strategies that tie diagnostics into broader connected-care pathways.
- May 2026: Medtronic announced its intent to acquire SPR Therapeutics for USD 650 million, adding temporary percutaneous peripheral nerve stimulation capabilities used in chronic pain management. The deal broadens Medtronic's connected therapy footprint and adds another data-generating modality that can be integrated into longitudinal patient management platforms.
- November 2024: Siemens Healthineers committed EUR 250 million to a new magnet-manufacturing site in North Oxfordshire to secure MRI component supply. This investment supports resilience in diagnostic hardware supply chains that underpin connected imaging fleets and associated workflow connectivity across hospitals.


Research Methodology Framework and Report Scope
Market Definition and Coverage
This market covers medical devices that capture patient or device data and transmit it through a wired or wireless link for monitoring, diagnosis support, therapy support, or clinical workflow use in healthcare and home-care settings.
Scope exclusions: We exclude pure telehealth software, general consumer wellness apps with no medical device role, and standalone network infrastructure that is not sold as part of a connected medical device offering.
Segmentation Overview
- By Connectivity Technology
- Wi-Fi
- Bluetooth Low Energy (BLE)
- Near-Field Communication (NFC)
- Zigbee
- Cellular (3G/4G/5G and LPWAN)
- Other LPWAN
- Satellite IoT
- By Device Type
- Wearable External Devices
- Implantable Devices
- Stationary Devices
- Disposable / Ingestible Sensors
- Portable Diagnostic Tools
- By Application
- Remote Patient Monitoring
- Clinical Operations and Workflow Management
- Connected Imaging
- Medication Management
- Tele-ICU / Interactive Medicine
- Preventive and Wellness Programs
- By End User
- Hospitals and Health Systems
- Ambulatory Surgical Centers
- Home-Care Settings
- Patients/Consumers
- Research and Diagnostic Laboratories
- Payers/Insurance Providers
- Government and Defense Institutions
- Other End Users
- By Geography
- North America
- United States
- Canada
- South America
- Brazil
- Argentina
- Rest of South America
- Europe
- Germany
- United Kingdom
- France
- Italy
- Spain
- Russia
- Rest of Europe
- Asia Pacific
- China
- Japan
- India
- South Korea
- Australia and New Zealand
- Rest of Asia Pacific
- Middle East and Africa
- Middle East
- GCC
- Turkey
- Israel
- Rest of Middle East
- Africa
- South Africa
- Nigeria
- Kenya
- Rest of Africa
- Middle East
- North America
Data Sources, Market Sizing, and Validation
Desk Research
Desk research was used to set the market context, align definitions, and build the first set of demand and supply indicators before we moved to primary checks. We referred to public sources such as the US FDA device databases and guidance notes, the US CDC for chronic disease burden signals, the World Health Organization for health system indicators, and OECD health statistics to understand care delivery patterns.
We also used sources such as UN Comtrade for trade direction checks on relevant device categories, peer reviewed journals for adoption and outcomes evidence in remote monitoring, and annual reports and investor presentations to identify product mix and revenue exposure to connected features. For company level context and event tracking, we additionally used paid subscriptions focused on company financials and intelligence, and patents to map connectivity and sensing trends. The sources noted above are illustrative, and many other public references were used for collection, cross-checks, and clarification.
Primary Interviews and Surveys
Primary work focused on validating what is actually monetized as a connected medical device versus adjacent software and services, and how pricing is structured across channels. We spoke with a mix of device manufacturers, component and connectivity solution stakeholders, distributors, providers, and digital health decision makers across APAC, EMEA, and the Americas, then used follow up calls when gaps appeared in device mix or usage assumptions.
Distribution of primary research fieldwork respondents
| Company type | Respondent position | Region |
|---|---|---|
| Top tier: 30% | CXOs: 16% | APAC: 45% |
| Mid tier: 48% | Functional/Unit leaders: 26% | EMEA: 37% |
| Smaller Players: 22% | Managers: 58% | Americas: 18% |
Market-Sizing & Forecasting
Sizing starts with a top-down build where healthcare device demand is reconstructed using connected device adoption indicators across care settings, then filtered through what is sold as a medical device product in each region. The totals are corroborated with selective bottom-up approximations, such as sampled volume by major device groups multiplied by realistic average selling prices, along with channel checks that flag any over-counting between device hardware and connectivity add-ons.
Key inputs used in the model include the installed base and replacement cycles for monitoring and therapeutic devices, remote patient monitoring enrollment and utilization signals, chronic disease prevalence and aging mix by region, regulatory and reimbursement momentum for monitored care pathways, and the mix shift toward wearable and internally embedded formats. Where bottom-up visibility is thinner, gaps are handled by using proxy ratios from comparable device categories and then stress-tested with interview feedback so the final totals stay explainable. Forecasting is done using multivariate regression with scenario checks, where variables like chronic disease burden, reimbursement expansion pace, and connectivity penetration are moved within realistic bands and reconciled back to supply-side product availability and pricing direction.
Data Validation & Update Cycle
Outputs are validated through multiple checks, including year over year variance tests, region share sanity checks, and comparisons against independent indicators like device shipment direction, health spending signals, and reported connected product mix trends. When a large swing is observed in a device group or region, we re-check definitions, revisit key assumptions, and re-contact select interviewees to confirm whether the change is real or model-driven.
Before sign-off, the model and write-up go through multi-step analyst review so calculations, units, and scope handling remain consistent across sections. The report is refreshed annually, and interim updates are triggered when material events occur, followed by a final pre-delivery pass to ensure clients receive the latest view.
Mordor Intelligence's Connected Medical Device Market Size Compared Against Other Published Estimates
Published market values for connected medical devices often do not match because the scope line can move in small ways, and then the pricing and adoption assumptions amplify the difference. Differences also show up when one publisher uses a different start year, applies a faster connectivity penetration curve, or converts currencies using a different timing.
In this study, the main gap driver is whether adjacent categories like broad connected healthcare devices, consumer fitness wearables, and non-device digital platforms are counted, plus how fast ASPs are assumed to rise for connected features and bundled monitoring. Some estimates also lean heavily on a single growth rate through the forecast window, even when reimbursement uptake and provider workflow adoption typically moves in steps. In those cases, the device-only revenue scope and staged adoption logic explain the spread versus Mordor Intelligence.
Benchmark comparison
| Source | Market Size | Gaps in Research Methodology |
|---|---|---|
| Mordor Intelligence | USD 75.99 B (2025) | |
| Regional Consultancy A | USD 57.56 B (2025) | Uses a narrower monetization view where several connected device categories are treated as consumer wellness, and it applies a steeper penetration driven growth path without as many staged reimbursement and provider workflow checks. |
| Trade Journal B | USD 48.68 B (2024) | Anchors on a 2024 base and appears to include fewer clinical device group roll-ups, with limited visibility into how ASP uplift and replacement cycles are normalized across regions. |
The comparison shows that the spread is mainly created by what gets counted as a medical device revenue stream, and how quickly adoption and pricing are stepped forward year to year. By tying the build to device-level demand signals like replacement cycles and monitored care uptake, then cross-checking totals with sampled ASP-by-volume math, we keep the estimate repeatable and easier to audit when assumptions change.


Key Questions Answered in the Report
What is the projected value of the Connected Medical Devices market by 2031?
The market is forecast to reach USD 173.26 billion by 2031, reflecting a 14.72% CAGR.
Which connectivity technology is growing fastest in connected devices?
5G is expected to advance at a 26.95% CAGR through 2031 as ultra-low latency use cases mature.
Why are home-care settings critical for future device adoption?
Home monitoring supports aging populations and cuts readmissions, driving a 20.58% CAGR for the segment.
Which region will add the most incremental revenue through 2031?
Asia-Pacific, propelled by USD 140 billion in digitization spending and regulatory harmonization, shows the highest regional CAGR at 26.58%.
Which region has the biggest share in Connected Medical Device Market?
In 2025, the North America accounts for the largest market share in Connected Medical Device Market.
How are AI features changing connected device value propositions?
Predictive analytics turn passive monitors into decision support tools, improving outcomes and easing clinician workload, which boosts purchasing appeal.
Page last updated on:






