
Connected Logistics Market Size and Share
Market Overview
| Study Period | 2020 - 2031 |
|---|---|
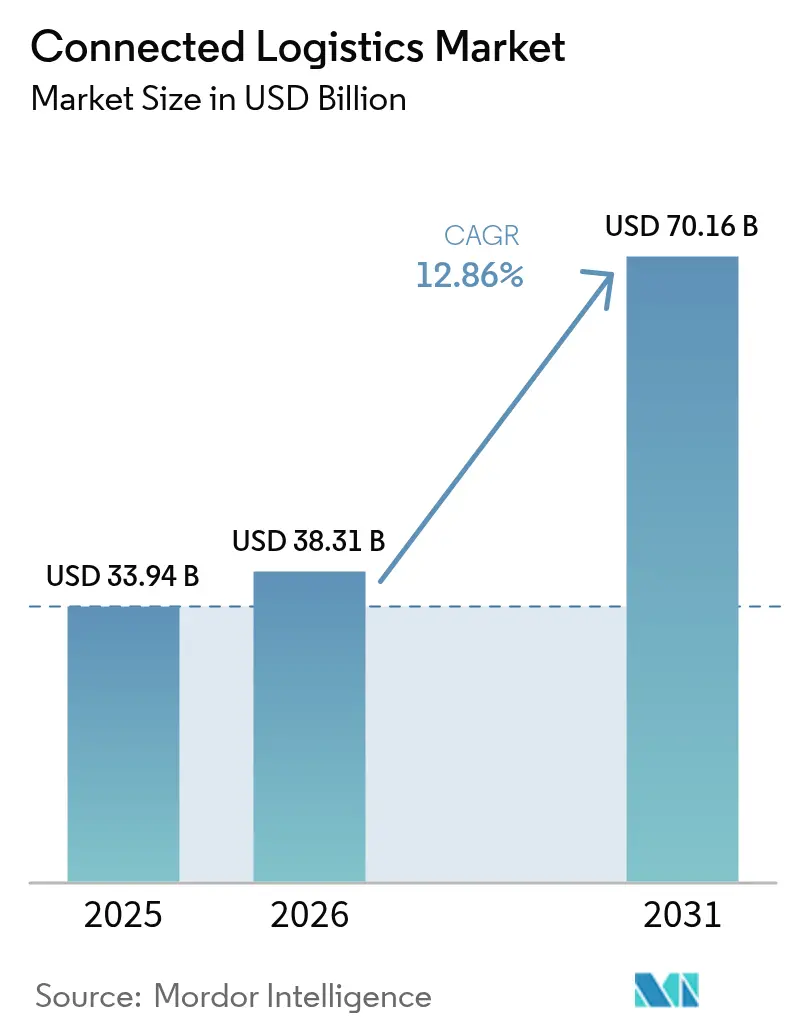
| Market Size (2026) | USD 38.31 Billion |
| Market Size (2031) | USD 70.16 Billion |
| Growth Rate (2026 - 2031) | 12.86% CAGR |
| Fastest Growing Market | Asia Pacific |
| Largest Market | North America |
| Market Concentration | Medium |
Major Players *Disclaimer: Major Players sorted in no particular order Image © Mordor Intelligence. Reuse requires attribution under CC BY 4.0. | |
Connected Logistics Market Analysis by Mordor Intelligence
The connected logistics market size was valued at USD 33.94 billion in 2025 and estimated to grow from USD 38.31 billion in 2026 to reach USD 70.16 billion by 2031, at a CAGR of 12.86% during the forecast period (2026-2031). Shippers’ insistence on end-to-end freight transparency, the rapid roll-out of IoT sensors, and the rise of 5G private networks in ports and yards underpin this expansion. Platform vendors are merging asset tracking, real-time visibility, and predictive analytics into unified suites that lower total cost of ownership for carriers and shippers alike. Cyber-resilience and data-sovereignty compliance remain central design criteria, nudging providers toward zero-trust architectures and regional data-processing nodes. The race to de-risk supply chains through digital twins accelerates pilot investments in AI-driven disruption forecasting, especially in manufacturing hubs and export-oriented economies.
Key Report Takeaways
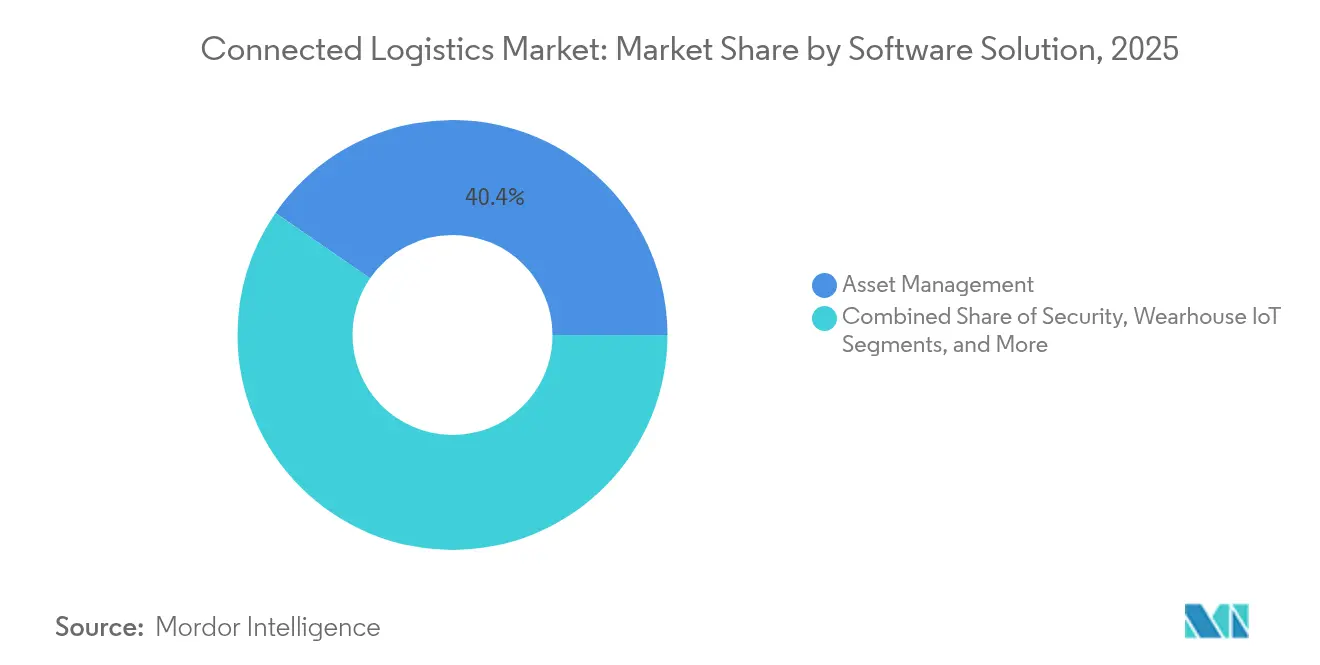
- By software solution, Asset Management led with 40.40% revenue share in 2025, while Streaming Analytics is projected to advance at a 16.07% CAGR to 2031.
- By product type, Device Management held 43.30% of the connected logistics market share in 2025; Connectivity Management is on track for a 15.25% CAGR through 2031.
- By transportation mode, Roadways commanded 38.10% of the connected logistics market size in 2025; Seaways is poised for a 14.72% CAGR during 2026-2031.
- By end-user industry, Manufacturing captured 26.70% share in 2025, whereas Healthcare is forecast to expand at 16.45% CAGR to 2031.
- By service type, Managed Services accounted for 53.40% share of the connected logistics market size in 2025; Consulting and Integration services are rising at 15.55% CAGR.
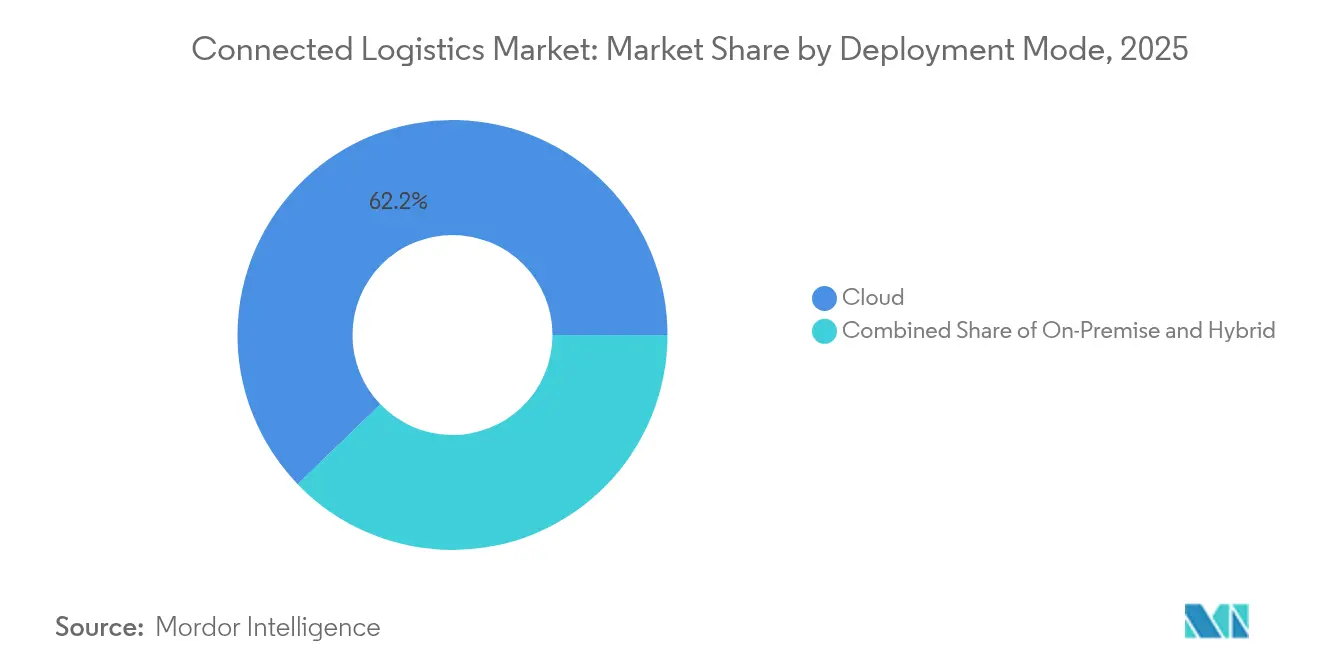
- By deployment mode, Cloud deployments made up 62.20% share in 2025, with Hybrid models growing at 14.55% CAGR.
- By organization size, Large Enterprises represented 66.10% share in 2025, while SMEs are progressing at 13.58% CAGR.
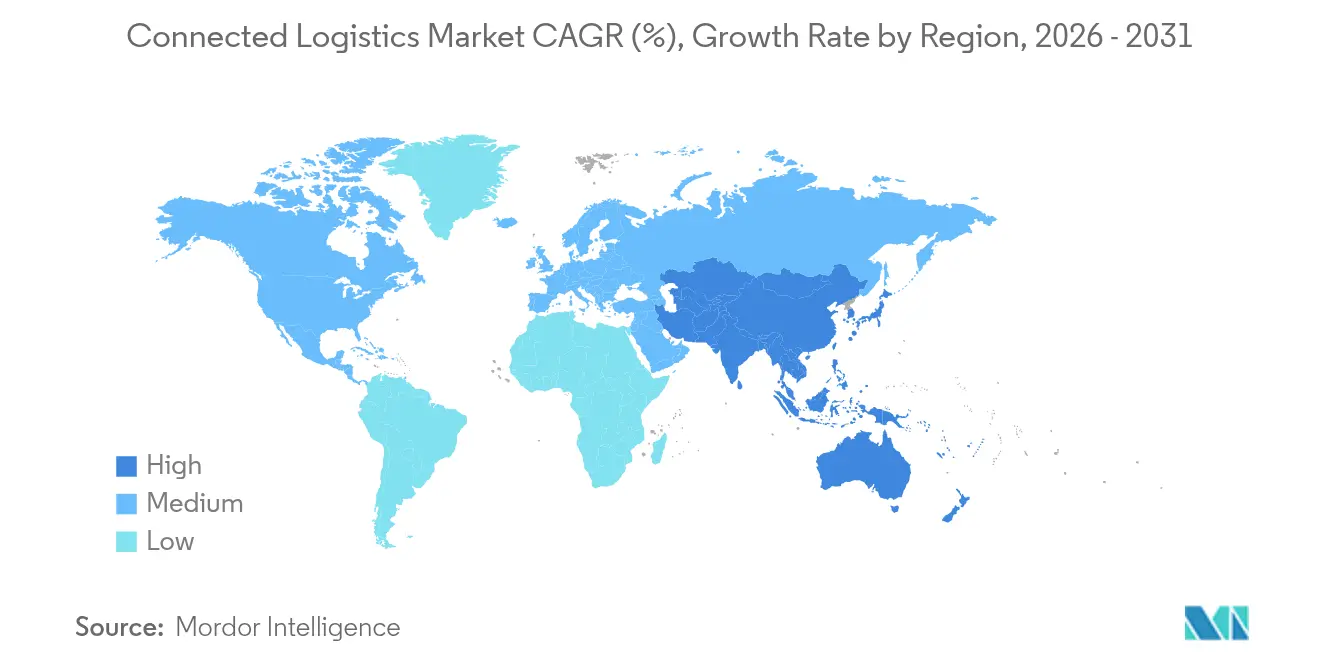
- By geography, North America held 34.90% market share in 2025; Asia Pacific exhibits the fastest growth at 13.12% CAGR through 2031.
Note: Market size and forecast figures in this report are generated using Mordor Intelligence’s proprietary estimation framework, updated with the latest available data and insights as of 2026.
Global Connected Logistics Market Trends and Insights
Drivers Impact Analysis*
| Driver | (~)% Impact on CAGR Forecast | Geographic Relevance | Impact Timeline |
|---|---|---|---|
| Surge in IoT-enabled asset tracking | +3.2% | Global; APAC and North America leading | Medium term (2–4 years) |
| Real-time freight visibility mandates from shippers | +2.8% | North America and EU expanding to APAC | Short term (≤ 2 years) |
| M&A-driven platform consolidation | +2.1% | Global; strongest in North America and Europe | Medium term (2–4 years) |
| 5G private networks in yards and ports | +1.9% | APAC core; spill-over to North America and Europe | Long term (≥ 4 years) |
| De-risking supply chains via digital twins | +1.4% | Global; early adoption in manufacturing hubs | Long term (≥ 4 years) |
| Source: Mordor Intelligence | |||
Surge in IoT-enabled asset tracking
Low-power sensors and global LPWAN coverage let companies monitor location, temperature, and shock in real time, extending battery life to a decade in some LoRaWAN deployments.[1]Semtech Corp., “Semtech and Traxmate Enable Global Asset Tracking,” semtech.com BMW’s use of Bluetooth beacons to trace vehicles across warehouses cut search times dramatically.[2]Inpixon, “BMW Implements INTRANAV Inventory Manager,” inpixon.com Cardinal Health’s smart-sensor pilots improve expiry management in hospital supply rooms. Converging AI analytics transform historical data into predictive maintenance alerts, shifting fleets from reactive to proactive coordination.
Real-time freight visibility mandates from shippers
FourKites’ purchase of TrackX Yard Solutions pairs yard-management data with over-the-road visibility, giving shippers sub-hourly updates on trailer locations. RFID deployments in automotive finishing centers stream live status to OEM ERP systems, satisfying strict just-in-time metrics. Life-science consignors deploy multi-sensor tags to meet continuous-temperature logging rules under Good Distribution Practice. Visibility feeds generative-AI route optimization portals expected to handle one-quarter of logistics KPI reporting by 2028.
M&A-driven platform consolidation
DSV’s EUR 14.3 billion acquisition of DB Schenker creates the largest freight forwarder and streamlines connected-logistics orchestration across 90 countries. RXO absorbed Coyote Logistics for USD 1.025 billion to scale tech-centric brokerage services. Körber’s move for MercuryGate adds TMS depth, bringing asset visibility and execution into one interface. The buying spree highlights the premium investors place on unified data models that collapse historically siloed functions.
5G private networks in yards and ports
Associated British Ports activated private 5G across multiple terminals, supporting autonomous guided vehicles with sub-millisecond latency abports.co.uk. The Port of Oakland reports 15% shorter container-handling times after similar roll-outs. EUROGATE’s edge-enabled networks allow on-equipment predictive maintenance, curbing unplanned crane downtime. Proposed long-distance automated logistics corridors, such as Japan’s 500-kilometer conveyor concept, depend on nationwide 5G coverage
Restraints Impact Analysis*
| Restraint | (~)% Impact on CAGR Forecast | Geographic Relevance | Impact Timeline |
|---|---|---|---|
| Cyber-security liabilities across multi-tenant fleets | -2.4% | Global, acute in North America and Europe | Short term (≤ 2 years) |
| Fragmented global data-sovereignty laws | -1.8% | Global, especially cross-border operations | Medium term (2–4 years) |
| Scarcity of interoperable APIs for brown-field assets | -1.3% | Global, most evident in mature markets | Medium term (2–4 years) |
| Margin pressure from “ship-for-free” e-commerce models | -1.1% | Global, led by North America and Europe | Short term (≤ 2 years) |
| Source: Mordor Intelligence | |||
Cyber-security liabilities across multi-tenant fleets
Reported breaches in transport rose 181% in 2024, with ransomware targeting fleet telematics and electronic logging devices. Cargo theft hit USD 455 million, often via broker impersonation that reroutes entire truckloads. Logistics CISOs now budget double-digit growth in security spend, mirroring Maersk’s forecast of USD 36.6 billion by 2037. Multi-tenant SaaS platforms complicate isolation-of-tenants, elevating lateral-movement risks
Fragmented global data-sovereignty laws
GDPR and region-specific residency mandates force providers to host mirrored databases within multiple jurisdictions, inflating compliance overhead. Freight forwarders juggle controller versus processor roles under overlapping statutes, stretching legal and IT resources. Divergent Asian frameworks further fragment architectures, nudging vendors toward hybrid edge-cloud models that localize processing while syncing anonymized data globally.
*Our forecasts treat driver/restraint impacts as directional, not additive. The impact forecasts reflect baseline growth, mix effects, and variable interactions.
Segment Analysis
By Software Solution: Asset Management Dominates While Analytics Accelerate
Asset Management represented 40.40% of the connected logistics market size in 2025 thanks to the immediate ROI firms gain by trimming idle time and improving container turns. Enterprises mesh RFID, GNSS, and environmental sensors into unified dashboards that flag under-utilized trailers and temperature excursions in real time. Streaming Analytics is advancing at 16.07% CAGR as organizations demand sub-second insight into truck ETA variance and dwell-time hot spots, fueling predictive rerouting engines.Evolving warehouse IoT overlays expand use cases from picker guidance to climate optimization, cutting spoilage rates for cold-chain SKUs. Security analytics suites analyze atypical data-packet flows to detect early indicators of device compromise. As Microsoft extends edge AI toolkits into logistics gateways, providers stitch asset health and traffic forecasts into single recommendation engines.


By Product Type: Device Management Leads Connectivity Revolution
Device Management captured 43.30% share in 2025, reflecting the complexity of patching firmware and certifying thousands of truck, pallet, and yard sensors. Zero-touch onboarding tools reduce truck-dock activation times, supporting large-scale refresh cycles. Connectivity Management is rising at a 15.25% CAGR as private 5G and satellite links multiply subscription profiles that must be orchestrated per asset.Application Management platforms move workloads between cloud regions and edge gateways to honor latency budgets and data-residency constraints. Patent filings by Tencent and Samsung illustrate new traffic-prioritization algorithms that adapt radio parameters by vehicle speed. Blockchain-enabled devices now embed cryptographic modules, raising the bar for device-lifecycle orchestration
By Transportation Mode: Roadways Dominate While Seaways Surge
Roadways held 38.10% of the connected logistics market share in 2025 due to dense last-mile networks and mature telematics retrofits. Camera-based ADAS and ELD mandates fuel data flows that improve driver safety and regulatory compliance. Seaways is expected to post a 14.72% CAGR, propelled by smart-container telemetry and automated terminal operations.Railways modernize with wayside-sensor arrays that predict wheel-flat defects, reducing line-haul interruptions. Airways integrate ULD trackers and AI-driven slot-management tools at cargo hubs. Eurotainer’s tank-container telemetry cut supply-chain costs 40% by shrinking heating cycles. Aurora Innovation’s driverless freight corridor between Dallas and Houston logged 1,200 miles without a human operator
By End-user Industry: Manufacturing Leads, Healthcare Accelerates
Manufacturing made up 26.70% of the connected logistics market size in 2025, anchored by just-in-time workflows that penalize even minor part delays. Digital twins marry production schedules to inbound logistics events, letting planners reorder mixed-model assembly lines on the fly. Healthcare is forecast to grow 16.45% CAGR as biologics and cell-therapy products require GPS-stamped temperature chains. Automotive plants deploy Bosch’s asset-tracking suite to coordinate sequenced part arrivals, avoiding line stoppages. Retail and e-commerce brands pilot factory-direct fulfillment schemes that bypass regional DCs and count on shipment-level tracking to reassure consumers
By Service Type: Managed Services Dominate, Integration Accelerates
Managed Services held 53.40% share in 2025 because carriers prefer subscription models that bundle device leases, connectivity, and analytics into SLA-bound offerings. Vendors guarantee uptime, letting logistics teams focus on core haulage operations. Consulting and Integration services are expanding at 15.55% CAGR as brown-field retrofits demand custom API bridges. CartonCloud’s tie-up with Rose Rocket merges WMS and TMS data, slashing manual double-key workloads. Integration-platform-as-a-service tools from SnapLogic auto-map EDI feeds into RESTful endpoints, shortening project timelines for SMEs
By Deployment Mode: Cloud Leads, Hybrid Grows
Cloud options retained 62.20% share in 2025 by delivering global scale, elastic compute, and rapid feature releases. Logistics majors replicate single codebases across regions, simplifying governance. Hybrid deployments are growing 14.55% CAGR as latency-critical yard apps remain on-premise while analytics reside in hyperscale clouds.Edge nodes at ports use Kubernetes-based micro-clouds to keep crane telemetry local, pushing summarized event streams to the cloud for historical trend mining. Digital twin engines rely on hybrid patterns to sync real-time OT data with cloud simulation clusters
By Organization Size: Large Enterprises Lead, SME Adoption Broadens
Large Enterprises controlled 66.10% share in 2025, leveraging capital depth to trial autonomous trucks and AI network optimization. SMEs, aided by SaaS pricing and pay-as-you-go device rentals, are expanding at 13.58% CAGR.Low-code dashboards let SME dispatchers configure multi-stop routes without specialist IT skills. Enterprise pilots often seed vendor roadmaps, and once stabilized these features cascade into SME-targeted editions, fueling broader connected logistics market adoption.
Geography Analysis
North America retained 34.90% share in 2025, buoyed by robust highway networks and supportive innovation sandboxes for autonomous vehicle pilots. Amazon is investing USD 4 billion to extend next-day coverage to 4,000 rural communities, underscoring the scale of infrastructure spend. UPS’s purchase of Andlauer Healthcare Group deepens cold-chain specialization in the region. Cyber-risk remains acute, yet venture funding and public-private testbeds accelerate technology diffusion. Asia Pacific is projected to lead growth at a 13.12% CAGR through 2031. Japan’s transport ministry is evaluating a 500-kilometer automated freight link between Tokyo and Osaka. Australia’s logistics-automation outlays exceed USD 4 billion, spanning warehouse robotics and yard automation. GEODIS is extending GPS-tracked road corridors from Singapore to China in anticipation of a USD 4.5 trillion regional logistics sector. Vietnam positions itself as an ASEAN logistics pivot by hosting the 2025 FIATA World Congress. Europe balances stringent data-protection rules with decarbonization mandates that push fleets toward EVs and sustainable aviation fuels. CEVA added 23 electric trucks, raising its low-carbon fleet beyond 1,100 vehicles cevalogistics.com. DHL collaborates with Neste on SAF supply models, supporting the EU’s net-zero transport goal. The European Commission estimates the regional logistics economy at EUR 878 billion and continues harmonizing rules to cut cross-border paperwork

Regulatory Landscape
Connected logistics deployments are increasingly shaped by requirements for standardized, electronic data exchange and by tighter rules on access to device-generated data. In the European Union, the eFTI Regulation (EU) 2020/1056 requires electronic freight transport information sharing across authorities and operators, with functional specifications set via Regulation (EU) 2025/2243. In parallel, the EU Data Act (Regulation 2023/2854) applied since 12 September 2025, affecting how telematics, sensors, and platform vendors design data access, portability, and interfaces for shippers and ecosystem partners.
Interoperability and modal-specific telematics standards are also progressing, which increases the need for common semantics across fleets and corridors. Commission Implementing Regulation (EU) 2026/253 (published in 2026) introduces a new technical specification for interoperability for rail telematics applications, consolidating prior requirements and shaping the offerings of providers supporting multimodal visibility. At the documentation layer, ISO 5909:2026 standardizes business processes and data interchange for electronic bills of lading using distributed ledger technology, while in the United States the USDOT announced the American Supply Chain Sovereignty Initiative in June 2026 to seek legislative authority to expand FLOW toward a centralized national freight visibility platform.
Value Chain Analysis
The connected logistics value chain starts with device and connectivity layers (telematics units, rugged sensors, gateways, LPWAN/cellular/5G private networks, and satellite links), then moves into device management and data ingestion, followed by integration and orchestration across cloud and hybrid environments. Application layers include asset management, yard and warehouse IoT, network management, and streaming analytics that turn raw telemetry into ETA, dwell time, condition monitoring, and exception workflows used by shippers, carriers, ports, and 3PLs. Managed services and systems integrators sit between technology vendors and end users, packaging devices, connectivity, and analytics into SLA-bound offerings and supporting brown-field retrofits across fleets and facilities.
Value creation is concentrated in data normalization, identity and security, and cross-enterprise interoperability, because connected logistics outcomes depend on linking IoT telemetry with TMS/WMS/ERP, port-community systems, and partner data feeds. Industry and advisory publications also point to integration debt and legacy data silos as key bottlenecks for scaling connected execution across enterprise boundaries, which increases the importance of integration platforms, API governance, and shared data semantics. As decision orchestration becomes a bigger part of operations, providers with data fabric capabilities, edge-to-cloud observability, and established partner networks capture more of the stack by embedding recommendations into execution systems, rather than limiting value to standalone visibility.
Competitive Landscape
The connected logistics market shows moderate fragmentation with a tilt toward consolidation. Mega-freight integrators such as DHL, UPS, and FedEx exploit scale advantages, while technology-first players like Trimble, Descartes, and Project44 win deals on data-integration agility. DSV’s takeover of DB Schenker boosts its multi-modal reach to 160,000 employees across 90 countries, signaling investor appetite for asset-rich models.
Technology differentiation now hinges on AI orchestration, edge analytics, and open-API ecosystems that collapse modal silos. FourKites and Project44 embed predictive dwell-time scores directly into TMS workflows, improving dock-scheduling efficiency. Hardware-software synergies intensify: EUROGATE bundles sensorized cranes with analytics SLAs, and Aurora pairs autonomous-vehicle IP with fleet-management portals.
Patent data suggests sustained innovation in ultra-wideband discovery, 5G traffic shaping, and blockchain-rooted identity services. Newcomers focusing on ruggedized sensor form factors and satellite-link optimization can still carve niches, particularly in oil-field, mining, and remote-agriculture lanes where cellular coverage is sparse.
Connected Logistics Industry Leaders
IBM Corporation
Intel Corporation
Robert Bosch GmbH
Cisco Systems, Inc.
AT&T Inc.
- *Disclaimer: Major Players sorted in no particular order


Recent Industry Developments
- July 2026: IBM selected five organizations for the 2025 cohort of the IBM Impact Accelerator, providing AI and data platform technology (including watsonx.ai) to modernize supply chains. The program-level deployment focus pushes applied AI into operational workflows, reinforcing vendor differentiation around end-to-end visibility, data integration, and decision automation.
- June 2025: Amazon announced a USD 4 billion investment to extend Prime delivery to 4,000 rural US communities and expand its delivery-station footprint. The buildout increases the need for connected last-mile operations, including real-time route execution, asset visibility, and capacity orchestration across distributed nodes.
- April 2024: RXO completed the acquisition of Coyote Logistics for USD 1.025 billion to expand its tech-enabled brokerage scale. Consolidation at the brokerage and forwarding layer increases the pull for unified data models and integrated visibility across shipper, carrier, and yard ecosystems.


Research Methodology Framework and Report Scope
Market Definition and Coverage
For this study, the connected logistics market covers digital solutions and related services that connect shipment movement, assets, fleets, and warehouses through sensors, networks, and software, so logistics decisions can be made in near real time.
Scope exclusions: We do not count general IT spending that is not directly used for logistics execution, visibility, tracking, or logistics network management.
Segmentation Overview
- By Software Solution
- Asset Management
- Warehouse IoT
- Security
- Data Management
- Network Management
- Streaming Analytics
- By Product Type
- Device Management
- Application Management
- Connectivity Management
- By Transportation Mode
- Roadways
- Railways
- Airways
- Seaways
- By End-user Industry
- Automotive
- Manufacturing
- Oil and Gas
- IT and Telecom
- Healthcare
- Retail and E-commerce
- Food and Beverage
- Other Industries
- By Service Type
- Consulting and Integration
- Managed Services
- Support and Maintenance
- By Deployment Mode
- Cloud
- On-Premise
- Hybrid
- By Organisation Size
- Large Enterprises
- Small and Medium Enterprises (SMEs)
- By Geography
- North America
- United States
- Canada
- Mexico
- South America
- Brazil
- Argentina
- Chile
- Rest of South America
- Europe
- Germany
- United Kingdom
- France
- Italy
- Spain
- Netherlands
- Russia
- Rest of Europe
- Asia Pacific
- China
- India
- Japan
- South Korea
- ASEAN
- Rest of Asia Pacific
- Middle East and Africa
- Middle East
- GCC (Saudi Arabia, UAE, Qatar, etc.)
- Turkey
- Rest of Middle East
- Africa
- South Africa
- Rest of Africa
- Middle East
- North America
Data Sources, Market Sizing, and Validation
Desk Research
Desk research was used to set the market boundaries, build the first demand map, and choose realistic input ranges before we moved to interviews. Public sources were reviewed for adoption signals and freight activity context, including US DOT and Bureau of Transportation Statistics releases, Eurostat transport datasets, UN Comtrade trade flows, World Bank logistics indicators, and OECD digital economy statistics.
We also reviewed company annual reports, earnings decks, product literature, and credible press coverage to understand how connected logistics is packaged across visibility, asset tracking, warehouse connectivity, and network management. Patent databases were selectively checked to see where activity is rising in tracking, sensor fusion, and logistics analytics, and a paid subscription for company financials and news was used to reconcile revenue mix and corporate reporting changes. The sources listed here are illustrative, and many other references were used for data collection, validation, and clarification during the study.
Primary Interviews and Surveys
Primary work was done through expert interviews and structured questionnaires with logistics service providers, shippers, technology integrators, and domain specialists who track fleet, warehouse, and freight visibility programs. These discussions helped confirm what is actually being purchased, typical pricing behavior, and whether adoption is accelerating or slowing across APAC, EMEA, and the Americas.
Distribution of primary research fieldwork respondents
| Company type | Respondent position | Region |
|---|---|---|
| Top tier: 32% | CXOs: 13% | APAC: 52% |
| Mid tier: 54% | Functional/Unit leaders: 31% | EMEA: 30% |
| Smaller Players: 14% | Managers: 56% | Americas: 18% |
Market-Sizing & Forecasting
Sizing starts with a top-down build where logistics digitization spend is reconstructed by region, then filtered to connected logistics use cases across transport modes and key industries, followed by a split into software and services. When the scope is fixed, we apply inputs that move the model in ways clients can sanity check, including connected-fleet penetration, share of shipments needing real-time visibility, installed base of trackable assets, warehouse IoT adoption, and typical subscription and services mix.
To keep the totals realistic, we corroborate them with selective bottom-up approximations, such as sampled vendor revenue patterns, channel checks with integrators, and a simple ASP times volume logic for tracking and visibility deployments where volumes can be reasonably inferred. When data is thin in smaller countries or niche verticals, we use proxy indicators like freight volumes, trade intensity, and smartphone and network readiness, and then normalize back to interview feedback.
Forecasts are built using multivariate regression, where demand growth is explained through freight activity, e-commerce intensity, connectivity rollout, and security driven upgrades, then adjusted through scenario analysis for macro swings and supply chain disruption cycles. Inputs are reviewed with experts so the forward path aligns with how budgets are actually planned, rather than how a single curve would project it.
Data Validation & Update Cycle
Outputs are checked against independent signals such as freight and trade series, reported logistics IT investment direction, and observed rollout pace of connected tracking and visibility programs. When a variance appears, the assumptions are re-opened and rechecked, and follow-up calls are triggered if pricing, bundling, or service mix has shifted.
Before sign-off, the model and key assumptions pass through multi-step analyst reviews that look for outliers across regions, modes, and end-user industries. The report is refreshed annually, and interim updates are made when there are material events such as regulatory changes affecting data transfer, major technology shifts, or sharp freight market moves. Right before delivery, a final review pass is done so clients receive the most current view available.
Mordor Intelligence's Connected Logistics Market Sizing Compared With Other Published Estimates
Published market sizes for connected logistics can look far apart even when the topic sounds the same, because each publisher draws the line around different solution buckets and treats pricing and adoption timing differently. We also see differences when a study anchors to a different base year, or when regional coverage is uneven across APAC, EMEA, and the Americas.
By tracking shipment-visibility and asset-tracking use cases separately and refreshing pricing and services mix assumptions each cycle, Mordor Intelligence keeps the model focused on connected logistics spend tied to execution and real-time logistics decisions, rather than broader digital transformation budgets. Gaps can also come from how currency conversion timing is handled, whether professional services are counted fully or only partially, and whether the forecast assumes an aggressive jump in penetration or a steadier ramp based on freight activity indicators.
Benchmark comparison
| Source | Market Size | Gaps in Research Methodology |
|---|---|---|
| Mordor Intelligence | USD 33.94 B (2025) | |
| Global Consultancy A | USD 43.28 B (2025) | Uses a broader definition that folds in more end-to-end logistics process digitization, which can pull in adjacent spend beyond connected tracking, visibility, and network management. The base year setup differs, and the growth path is linked to a faster penetration curve through 2030. |
| Industry Publisher B | USD 44.21 B (2025) | Likely includes a wider bundle of integrated digital supply chain initiatives and optimization platforms, which can overlap with general supply chain software budgets. The forecast window and CAGR assumptions are more aggressive, and services attachment can be treated at a higher ratio. |
The comparison shows that most of the spread is explained by scope boundaries and how fast penetration and pricing are assumed to move, not by a single data point. Our approach stays traceable to freight activity and adoption signals, so users can see what is included, what is excluded, and which inputs drive the total.


Key Questions Answered in the Report
How big is the Connected Logistics Market?
The Connected Logistics Market size is expected to reach USD 38.31 billion in 2026 and grow at a CAGR of 12.86% to reach USD 70.16 billion by 2031.
What is the current size and growth outlook of the connected logistics market?
The connected logistics market stands at USD 38.31 billion in 2026 and is projected to reach USD 70.16 billion by 2031, registering a 12.86% CAGR.
Which region contributes the largest share to the connected logistics market?
North America leads with 34.90% share, supported by advanced infrastructure and early technology adoption.
Which software solution holds the highest share in the connected logistics market?
Asset Management leads with 40.40% share as firms prioritize real-time tracking and utilization of trucks, containers, and equipment.
Why are 5G private networks important for connected logistics?
Private 5G delivers ultra-low latency and dedicated bandwidth, enabling autonomous vehicles, real-time crane control, and high-density sensor deployments in ports and yards
What is the main cybersecurity concern for connected logistics providers?
Multi-tenant fleet platforms face rising ransomware and cargo-theft attacks, with reported breaches in transport increasing 181% in 2024.
How are SMEs adopting connected logistics solutions?
Cloud-based SaaS platforms and managed services lower upfront costs, allowing SMEs to add GPS tracking, delivery optimization, and customer-notification tools without large IT teams.
Page last updated on:






