| Study Period | 2017 - 2030 |
| Base Year For Estimation | 2024 |
| Forecast Data Period | 2025 - 2030 |
| Market Size (2025) | USD 214.1 Billion |
| Market Size (2030) | USD 280.8 Billion |
| CAGR (2025 - 2030) | 5.57 % |
| Market Concentration | Medium |
Major Players*Disclaimer: Major Players sorted in no particular order |

Confectionery Market Analysis
The Confectionery Market size is estimated at 214.1 billion USD in 2025, and is expected to reach 280.8 billion USD by 2030, growing at a CAGR of 5.57% during the forecast period (2025-2030).
The confectionery industry is experiencing a significant transformation in its retail landscape, with supermarkets and hypermarkets emerging as the dominant distribution channels. Major retail chains are strategically positioning confectionery products at checkout counters to drive impulse purchases while expanding their store networks to enhance accessibility. For instance, as of 2023, Lidl operates over 3,000 stores in Germany and 1,500 stores in France, while Carrefour maintains approximately 2,869 supermarkets across Europe. The convenience store sector has also witnessed substantial growth, with chains like 7-Eleven expanding their global presence to over 77,711 stores by 2022, offering a wide range of confectionery products with innovative promotional strategies.
Consumer preferences in the confectionery market are increasingly shifting towards healthier alternatives and premium products. This trend is particularly evident in mature markets, where consumers are demanding products with natural ingredients, reduced sugar content, and organic certifications. The industry has responded by developing sugar-free, vegan, and organic variants to cater to health-conscious consumers. In North America, this shift is reflected in consumption patterns, with recent data showing that while 49% of US consumers prefer milk chocolate, a significant 34% now opt for dark chocolate, which is perceived as a healthier alternative.
The market is witnessing a notable trend towards premiumization and product innovation, particularly in established markets. Manufacturers are introducing artisanal chocolates, unique flavor combinations, and luxury confectionery products to meet evolving consumer preferences. Canadian consumers, for instance, demonstrate a strong appetite for premium chocolate products, with an average per capita consumption of 6.4 kg in 2022, and households spending an average of USD 88 annually on chocolate bars. This trend is driving manufacturers to invest in product development and premium packaging to differentiate their offerings in an increasingly competitive market, thereby influencing the confectionery market size.
The digital transformation of retail channels is reshaping the confectionery market's distribution landscape. E-commerce platforms are emerging as crucial sales channels, offering consumers convenient access to a wider range of products and personalized shopping experiences. Online retailers are leveraging data analytics and artificial intelligence to understand consumer preferences and optimize their product offerings. The trend towards digital retail is particularly evident in the rapid growth of online confectionery sales, with the segment projected to maintain strong momentum through 2030, supported by increasing internet penetration and evolving consumer shopping habits. This digital shift is a key factor in the confectionery market growth.
Global Confectionery Market Trends
Strong demand during festive seasons and special occasions positively impacts the confectionery market worldwide
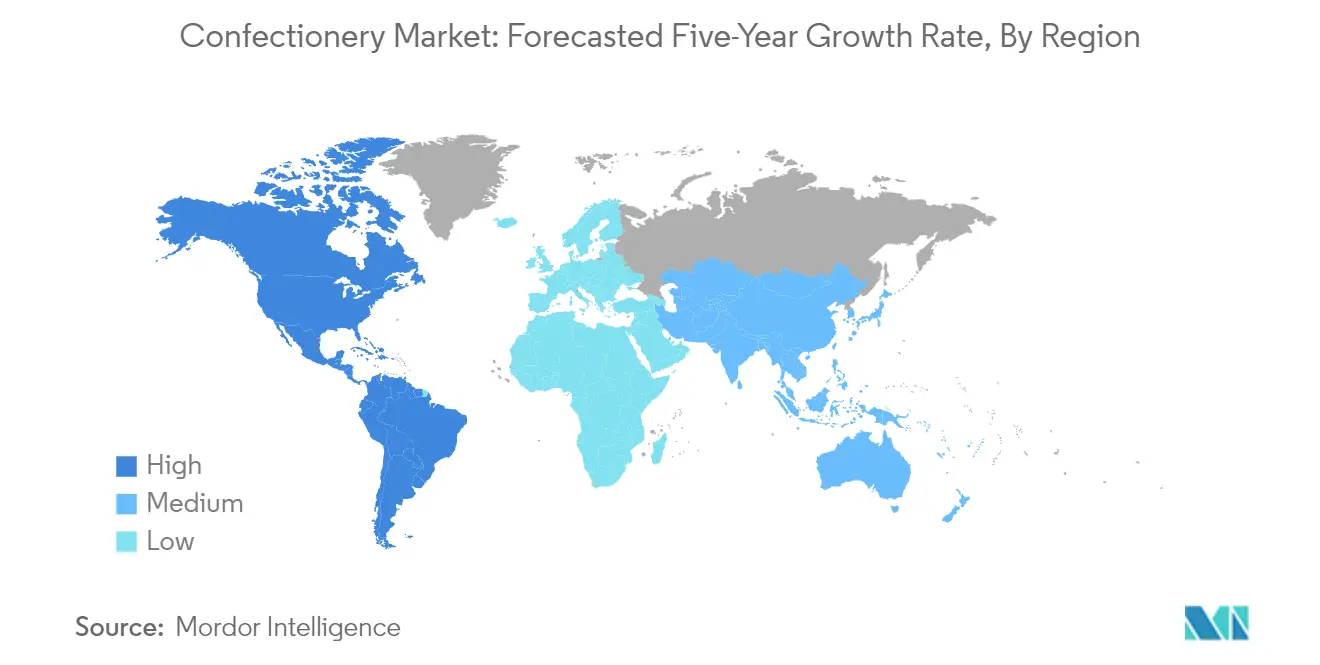
- Europe and Asia-Pacific are the leading confectionery-consuming regions, followed by North America. The consumption of confectionery products in Europe is majorly associated with celebrations, holidays, and gift-giving, leading to consistent demand throughout the year. In North America, one-fifth of consumers bought candy weekly, and slightly more (22%) bought candy multiple times per week in 2022.
- Organic, Fairtrade-certified, and Rainforest Alliance/UTZ-certified confectionery are gaining significant traction across European countries. Germany, the UK, and the Netherlands are the largest markets for chocolates made with Fairtrade-certified cocoa beans. Also, consumer preferences are influenced by the taste, texture, and format of the confectionery.
- In 2023, confectionery products witnessed a hike in their sales. The sales growth was linked to the changing eating habits of consumers. In 2023, under the confectionery segment, snack bars gained a significant volume of popularity as people preferred them over oily-stuffed snacks. On average, the Y-o-Y growth of the prices of chocolate products was valued at USD 2.34 in 2023, which was also a hike of 2.1%.
- Under the confectionery segment, chocolate is a popular treat enjoyed by individuals. There are considerations regarding its health benefits and potential drawbacks. Chocolates were consumed by 92% of the global population in 2023. Across the globe, there are a few additional factors to consider in the context of confectionery consumption from a health perspective, such as their health significance.
Understand The Key Trends Shaping This Market
Download PDF
OTHER KEY INDUSTRY TRENDS COVERED IN THE REPORT
- The demand for fortified confectionery products, and products incorporated with ingredients with functional benefits boost the growth
Segment Analysis: Confections
Chocolate Segment in Global Confectionery Market
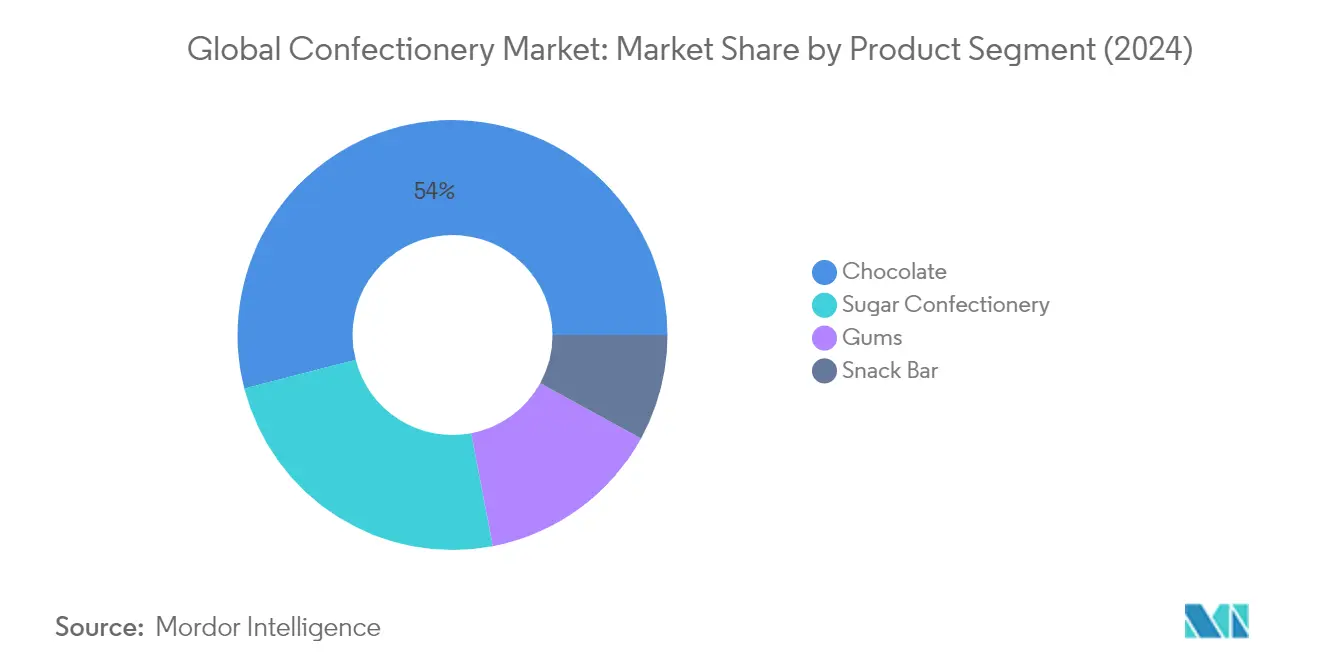
Chocolate continues to dominate the global chocolate confectionery market, commanding approximately 54% of the total market value in 2024. This significant market share is driven by the product's multisensory and chemosensory appeal, including attributes like color, mouthfeel, and complexity of flavors and aromas. Milk and white chocolate variants remain preferred choices over dark chocolate, primarily due to taste preferences, with the addition of milk, a lower percentage of cocoa, and higher sugar content creating a taste profile that appeals much more to the general population than the bitter profile of dark chocolates. The segment's strong position is further reinforced by growing consumer awareness of dark chocolate's health benefits, as scientific studies have found it to be harmless when consumed by people suffering from cardiac diseases, diabetes, and obesity.
Snack Bar Segment in Global Confectionery Market
The snack bar segment is projected to exhibit the strongest growth trajectory in the global confectionery industry, with an anticipated growth rate of approximately 8% during 2024-2029. This remarkable growth is primarily driven by increasing consumer preference for healthier and wholesome snacks, especially among younger demographics. The segment's expansion is supported by manufacturers increasingly launching new products with natural and organic claims, such as "no artificial additives," "non-GMO," and "reduced sugar." The rising number of sports enthusiasts and fitness enthusiasts globally has particularly fueled snack bar sales, with health-conscious consumers increasingly choosing these products as meal replacements or nutritious snacking options. The segment's growth is further bolstered by the development of innovative flavors and healthy varieties to supplement eating habits.
Remaining Segments in Global Confectionery Market
The global confectionery market segmentation includes gums and sugar confectionery, each playing vital roles in the industry's diversity. The gums segment encompasses both bubble gum and chewing gum variants, with manufacturers focusing on sugar-free alternatives and functional benefits such as dental health and breath freshening. The sugar confectionery segment comprises various products including hard candies, lollipops, mints, pastilles, gummies, jellies, toffees, and nougats, catering to different consumer preferences and occasions. These segments continue to evolve with innovations in flavors, textures, and healthier formulations, responding to changing consumer preferences and health consciousness trends.
Segment Analysis: Distribution Channel
Supermarket/Hypermarket Segment in Global Confectionery Market
Supermarkets and hypermarkets dominate the global candy market distribution landscape, commanding approximately 47% of the market share in 2024. This channel's dominance is attributed to its ability to offer a comprehensive range of sweets market products under one roof, coupled with strategic product positioning and merchandising strategies. These retail formats leverage their widespread networks and strong relationships with candy industry manufacturers to provide consumers with diverse product choices at competitive prices. The segment's strength is further enhanced by the implementation of loyalty programs and regular promotional activities that drive consumer engagement. Major global chains like Walmart, Carrefour, and Tesco have been instrumental in maintaining this channel's market leadership through their extensive geographical presence and sophisticated supply chain management systems.
Online Retail Store Segment in Global Confectionery Market
The online retail channel is experiencing remarkable growth in the confectionery market, projected to expand at approximately 6% CAGR from 2024 to 2029. This growth trajectory is primarily driven by the increasing adoption of e-commerce platforms and changing consumer shopping preferences. The segment's expansion is supported by the rising number of smartphone users and widespread internet penetration across key regions. Online retailers are capitalizing on this trend by offering exclusive deals, subscription services, and personalized shopping experiences. The convenience of home delivery, coupled with the ability to compare prices and access a wider product range, has made this channel particularly attractive to modern consumers. Additionally, the integration of advanced technologies in online platforms, such as artificial intelligence for personalized recommendations and improved user interfaces, is further accelerating this segment's growth.
Remaining Segments in Distribution Channel
The convenience store and other retail formats continue to play vital roles in the global confectionery distribution landscape. Convenience stores serve as crucial points of impulse purchases, particularly benefiting from their strategic locations and extended operating hours. These stores excel in capturing spontaneous buying decisions through effective checkout counter displays and quick-service offerings. The 'Others' category, which includes specialty stores, vending machines, and direct selling channels, provides unique value propositions to specific consumer segments. These alternative channels often focus on premium or niche confectionery products, creating distinct market positions through specialized product offerings and personalized customer service approaches.
Confectionery Market Geography Segment Analysis
Confectionery Market in Africa
The African confectionery market demonstrates significant growth potential, driven by changing consumer preferences and increasing urbanization across the region. South Africa, Nigeria, and Egypt represent the key markets, each contributing distinctively to the regional confectionery landscape. The region shows particular strength in chocolate consumption and sugar confectionery products, with increasing demand for premium confectionery and international brands. Local manufacturers are also gaining prominence, especially in Nigeria's cocoa processing sector, while Egypt's market is characterized by strong seasonal demand patterns and festive consumption.Confectionery Market in South AfricaSouth Africa maintains its position as the dominant force in Africa's confectionery sector, holding approximately 34% market share in 2024. The country's market is characterized by a strong presence of both international and local manufacturers, with a particularly robust chocolate segment. South African consumers show an increasing preference for premium products, especially in urban areas, while the country's well-developed retail infrastructure facilitates widespread product distribution.Confectionery Market in EgyptEgypt emerges as the fastest-growing confectionery market in Africa, with an anticipated growth rate of nearly 7% between 2024 and 2029. The market benefits from a large youth population and growing middle class, driving increased consumption of various confectionery products. Egyptian consumers show particular interest in seasonal confectionery products, especially during religious festivals and celebrations, while the country's strategic location facilitates distribution across the Middle East and North Africa region.
Confectionery Market in Asia-Pacific
The Asia-Pacific confectionery market showcases dynamic growth patterns, influenced by diverse consumer preferences and varying economic conditions across different countries. The region encompasses major markets including China, Japan, India, and Australia, each with distinct consumption patterns and market characteristics. Innovation in product development, particularly in healthy and functional confectionery products, drives market expansion across the region. The market also benefits from increasing disposable incomes and the westernization of dietary habits in many countries.Confectionery Market in ChinaChina dominates the Asia-Pacific confectionery landscape, commanding approximately 40% of the regional market share in 2024. The country's vast consumer base and growing urban population drive significant demand for various confectionery products. Chinese consumers show an increasing preference for premium and international brands, while local manufacturers continue to innovate with products that cater to traditional tastes and preferences.Confectionery Market in IndiaIndia stands out as the fastest-growing market in the Asia-Pacific region, with a projected growth rate of around 20% between 2024 and 2029. The country's large young population and increasing disposable incomes drive market expansion. Indian consumers show particular interest in innovative flavors and formats, while the growing organized retail sector facilitates better product distribution and availability.
Confectionery Market in Europe
Europe maintains its position as a global leader in the confectionery market, characterized by strong traditions in chocolate production and innovation in product development. The region encompasses major markets including Germany, the United Kingdom, France, and Switzerland, each contributing unique strengths to the overall market. Consumer preferences in Europe increasingly lean toward premium, organic, and artisanal confectionery products, while sustainability and ethical sourcing remain key focus areas.Confectionery Market in GermanyGermany leads the European confectionery market, holding approximately 39% of the regional market share in 2024. The country's strong manufacturing base and innovation in product development drive market growth. German consumers show particular appreciation for high-quality chocolate products, while the country's efficient distribution networks ensure widespread product availability.Confectionery Market in TurkeyTurkey emerges as Europe's fastest-growing confectionery market, with an expected growth rate of about 6% between 2024 and 2029. The country's strategic location between Europe and Asia influences its diverse confectionery offerings. Turkish consumers show a strong preference for traditional confectionery products, while the market benefits from increasing modernization of retail channels.
Confectionery Market in Middle East
The Middle Eastern confectionery market demonstrates robust growth potential, driven by changing consumer preferences and increasing westernization of food habits. Saudi Arabia leads the regional market, while the United Arab Emirates shows the fastest growth trajectory. The region's confectionery market benefits from high disposable incomes and a strong preference for premium products, particularly in the Gulf Cooperation Council (GCC) countries. Traditional and international flavors coexist in the market, with seasonal demand peaks during religious festivals and celebrations. The market also sees increasing innovation in product development, particularly in healthy and functional confectionery products, while modern retail channels facilitate better product distribution and availability.
Confectionery Market in North America
The North American confectionery market showcases mature market characteristics with continuous innovation in product development and marketing strategies. The United States dominates the regional market, while Mexico demonstrates the fastest growth potential. The region's market is characterized by strong consumer preference for premium and innovative products, particularly in the chocolate and snack bar segments. Health-conscious consumers drive demand for sugar-free and functional confectionery products, while seasonal celebrations significantly influence consumption patterns. The well-developed retail infrastructure and e-commerce channels facilitate efficient product distribution, while manufacturers focus on product innovation to meet evolving consumer preferences.
Confectionery Market in South America
The South American confectionery market demonstrates significant growth potential, influenced by changing consumer preferences and economic conditions. Brazil leads the regional market, while Argentina shows the fastest growth trajectory. The region's confectionery market benefits from a strong tradition of chocolate consumption and increasing demand for premium products. Local manufacturers play a significant role in market development, while international brands continue to expand their presence. The market shows particular strength in seasonal confectionery products, while increasing modernization of retail channels facilitates better product distribution and availability.
Get Analysis on Important Geographic Markets
Download PDF
Confectionery Industry Overview
Top Companies in Confectionery Market
The global confectionery market is characterized by continuous product innovation and strategic expansion initiatives by major players. Companies are heavily investing in research and development to launch new flavors, healthier variants, and sustainable product offerings to meet evolving consumer preferences. Operational agility is demonstrated through the establishment of new manufacturing facilities, modernization of existing plants, and optimization of supply chain networks. Strategic moves predominantly include partnerships with local distributors, acquisitions of regional brands, and collaborations with technology providers to enhance digital capabilities. Confectionery market leaders are expanding their geographical presence through both organic growth and strategic acquisitions while simultaneously focusing on strengthening their distribution networks in emerging markets. The industry also witnesses significant investments in sustainable sourcing practices and eco-friendly packaging solutions to align with global sustainability goals.
Fragmented Market with Strong Regional Players
The global confectionery industry exhibits a fragmented structure with a mix of multinational corporations and strong regional players. Major global conglomerates dominate the premium segments, while local specialists maintain a significant presence in specific regional markets through their understanding of local tastes and preferences. The market is characterized by the presence of well-established companies with diverse product portfolios alongside numerous smaller manufacturers focusing on niche segments. These regional players often compete effectively through specialized product offerings, local distribution networks, and strong brand recognition in their respective markets.
The industry has witnessed significant merger and acquisition activities as larger companies seek to expand their geographical footprint and product portfolio. Global players are actively acquiring local brands to penetrate new markets and gain access to established distribution networks. Vertical integration strategies are being adopted by major players to ensure control over raw material supply and quality standards. The market also sees strategic partnerships between manufacturers and retail chains to enhance product visibility and market reach, while cross-border collaborations are becoming increasingly common to leverage complementary strengths.
Innovation and Sustainability Drive Future Growth
Success in the confectionery market increasingly depends on companies' ability to innovate while maintaining sustainability throughout their operations. Market leaders are focusing on developing premium products with clean labels, organic ingredients, and functional benefits to capture health-conscious consumers. Companies are investing in advanced manufacturing technologies to improve production efficiency and product quality while reducing environmental impact. The development of direct-to-consumer channels and digital marketing strategies has become crucial for building brand loyalty and reaching younger consumers.
For contenders looking to gain market share, differentiation through unique product offerings and strong regional presence remains key. Companies must focus on building efficient distribution networks while maintaining flexibility to adapt to changing consumer preferences. Success factors include developing sustainable sourcing practices, implementing transparent supply chains, and creating innovative packaging solutions. Regulatory compliance, particularly regarding sugar content and labeling requirements, continues to shape product development strategies. The ability to manage raw material costs while maintaining product quality will be crucial for maintaining competitive advantage in the market.
Confectionery Market Leaders
-
Ferrero International SA
-
Mars Incorporated
-
Mondelēz International Inc.
-
Nestlé SA
-
The Hershey Company
- *Disclaimer: Major Players sorted in no particular order

Need More Details on Market Players and Competiters?
Download PDF
Confectionery Market News
- August 2023: Ferrero North America, in the United States, revealed new products and seasonal offerings, including Kinder Chocolate, at the Annual Sweets & Snacks Expo in Chicago.
- July 2023: HARIBO® officially began gummi production at its first-ever North American manufacturing facility, located in Pleasant Prairie, Wis. The brand-new, state-of-the-art factory was created to meet the growing demand by US consumers of the beloved gummi brand, which produces over 25 varieties of gummi treats in the US and more than 1,200 types globally.
- July 2023: Ferrero's sister company, Ferrara Candy Co., announced the acquisition of Brazilian snacks company Dori Alimentos, which sells a variety of chocolate and sugar confectionery brands, including Dori, Pettiz, and Jubes.
Free With This Report
We provide a comprehensive and exhaustive set of data pointers for global, regional, and country-level metrics that illustrate the fundamentals of the confectionery industry. With the help of 45+ free charts, clients can access in-depth market analysis based on price trend analysis of confectionery ingredients and per capita consumption of confections, through granular-level segmental information supported by a repository of market data, trends, and expert analysis. Data and analysis on confections, confectionery variants, sugar content, insights into consumer preferences and purchasing patterns, an overview of key market players, etc., are available in the form of comprehensive reports as well as excel-based data worksheets.


Confectionery Market Report - Table of Contents
1. EXECUTIVE SUMMARY & KEY FINDINGS
2. REPORT OFFERS
3. INTRODUCTION
- 3.1 Study Assumptions & Market Definition
- 3.2 Scope of the Study
- 3.3 Research Methodology
4. KEY INDUSTRY TRENDS
- 4.1 Regulatory Framework
- 4.2 Consumer Buying Behavior
- 4.3 Ingredient Analysis
- 4.4 Value Chain & Distribution Channel Analysis
5. MARKET SEGMENTATION (includes market size in Value in USD and Volume, Forecasts up to 2030 and analysis of growth prospects)
-
5.1 Confections
- 5.1.1 Chocolate
- 5.1.1.1 By Confectionery Variant
- 5.1.1.1.1 Dark Chocolate
- 5.1.1.1.2 Milk and White Chocolate
- 5.1.2 Gums
- 5.1.2.1 By Confectionery Variant
- 5.1.2.1.1 Bubble Gum
- 5.1.2.1.2 Chewing Gum
- 5.1.2.1.2.1 By Sugar Content
- 5.1.2.1.2.1.1 Sugar Chewing Gum
- 5.1.2.1.2.1.2 Sugar-free Chewing Gum
- 5.1.3 Snack Bar
- 5.1.3.1 By Confectionery Variant
- 5.1.3.1.1 Cereal Bar
- 5.1.3.1.2 Fruit & Nut Bar
- 5.1.3.1.3 Protein Bar
- 5.1.4 Sugar Confectionery
- 5.1.4.1 By Confectionery Variant
- 5.1.4.1.1 Hard Candy
- 5.1.4.1.2 Lollipops
- 5.1.4.1.3 Mints
- 5.1.4.1.4 Pastilles, Gummies, and Jellies
- 5.1.4.1.5 Toffees and Nougats
- 5.1.4.1.6 Others
-
5.2 Distribution Channel
- 5.2.1 Convenience Store
- 5.2.2 Online Retail Store
- 5.2.3 Supermarket/Hypermarket
- 5.2.4 Others
-
5.3 Region
- 5.3.1 Africa
- 5.3.1.1 By Country
- 5.3.1.1.1 Egypt
- 5.3.1.1.2 Nigeria
- 5.3.1.1.3 South Africa
- 5.3.1.1.4 Rest of Africa
- 5.3.2 Asia-Pacific
- 5.3.2.1 By Country
- 5.3.2.1.1 Australia
- 5.3.2.1.2 China
- 5.3.2.1.3 India
- 5.3.2.1.4 Indonesia
- 5.3.2.1.5 Japan
- 5.3.2.1.6 Malaysia
- 5.3.2.1.7 New Zealand
- 5.3.2.1.8 South Korea
- 5.3.2.1.9 Rest of Asia-Pacific
- 5.3.3 Europe
- 5.3.3.1 By Country
- 5.3.3.1.1 Belgium
- 5.3.3.1.2 France
- 5.3.3.1.3 Germany
- 5.3.3.1.4 Italy
- 5.3.3.1.5 Netherlands
- 5.3.3.1.6 Russia
- 5.3.3.1.7 Spain
- 5.3.3.1.8 Switzerland
- 5.3.3.1.9 Turkey
- 5.3.3.1.10 United Kingdom
- 5.3.3.1.11 Rest of Europe
- 5.3.4 Middle East
- 5.3.4.1 By Country
- 5.3.4.1.1 Bahrain
- 5.3.4.1.2 Kuwait
- 5.3.4.1.3 Oman
- 5.3.4.1.4 Qatar
- 5.3.4.1.5 Saudi Arabia
- 5.3.4.1.6 United Arab Emirates
- 5.3.4.1.7 Rest of Middle East
- 5.3.5 North America
- 5.3.5.1 By Country
- 5.3.5.1.1 Canada
- 5.3.5.1.2 Mexico
- 5.3.5.1.3 United States
- 5.3.5.1.4 Rest of North America
- 5.3.6 South America
- 5.3.6.1 By Country
- 5.3.6.1.1 Argentina
- 5.3.6.1.2 Brazil
- 5.3.6.1.3 Rest of South America
6. COMPETITIVE LANDSCAPE
- 6.1 Key Strategic Moves
- 6.2 Market Share Analysis
- 6.3 Company Landscape
-
6.4 Company Profiles
- 6.4.1 August Storck KG
- 6.4.2 Chocoladefabriken Lindt & Sprüngli AG
- 6.4.3 Ferrero International SA
- 6.4.4 General Mills Inc.
- 6.4.5 HARIBO Holding GmbH & Co. KG
- 6.4.6 Kellogg Company
- 6.4.7 Lotte Corporation
- 6.4.8 Mars Incorporated
- 6.4.9 Meiji Holdings Company Ltd
- 6.4.10 Mondelēz International Inc.
- 6.4.11 Nestlé SA
- 6.4.12 PepsiCo Inc.
- 6.4.13 Perfetti Van Melle BV
- 6.4.14 The Hershey Company
- 6.4.15 Yıldız Holding AS
- *List Not Exhaustive
7. KEY STRATEGIC QUESTIONS FOR CONFECTIONERY CEOS
8. APPENDIX
-
8.1 Global Overview
- 8.1.1 Overview
- 8.1.2 Porter’s Five Forces Framework
- 8.1.3 Global Value Chain Analysis
- 8.1.4 Market Dynamics (DROs)
- 8.2 Sources & References
- 8.3 List of Tables & Figures
- 8.4 Primary Insights
- 8.5 Data Pack
- 8.6 Glossary of Terms
You Can Purchase Parts Of This Report. Check Out Prices For Specific Sections
Get Price Break-up Now
List of Tables & Figures
- Figure 1:
- VOLUME OF CONFECTIONERY MARKET, METRIC TONNES, GLOBAL, 2018 - 2030
- Figure 2:
- VALUE OF CONFECTIONERY MARKET, USD, GLOBAL, 2018 - 2030
- Figure 3:
- VOLUME OF CONFECTIONERY MARKET BY CONFECTIONS, METRIC TONNES, GLOBAL, 2018 - 2030
- Figure 4:
- VALUE OF CONFECTIONERY MARKET BY CONFECTIONS, USD, GLOBAL, 2018 - 2030
- Figure 5:
- VOLUME SHARE OF CONFECTIONERY MARKET BY CONFECTIONS, %, GLOBAL, 2018 VS 2024 VS 2030
- Figure 6:
- VALUE SHARE OF CONFECTIONERY MARKET BY CONFECTIONS, %, GLOBAL, 2018 VS 2024 VS 2030
- Figure 7:
- VOLUME OF CHOCOLATE MARKET BY CONFECTIONERY VARIANT, METRIC TONNES, GLOBAL, 2018 - 2030
- Figure 8:
- VALUE OF CHOCOLATE MARKET BY CONFECTIONERY VARIANT, USD, GLOBAL, 2018 - 2030
- Figure 9:
- VOLUME SHARE OF CHOCOLATE MARKET BY CONFECTIONERY VARIANT, %, GLOBAL, 2018 VS 2024 VS 2030
- Figure 10:
- VALUE SHARE OF CHOCOLATE MARKET BY CONFECTIONERY VARIANT, %, GLOBAL, 2018 VS 2024 VS 2030
- Figure 11:
- VOLUME OF DARK CHOCOLATE MARKET, METRIC TONNES, GLOBAL, 2018 - 2030
- Figure 12:
- VALUE OF DARK CHOCOLATE MARKET, USD, GLOBAL, 2018 - 2030
- Figure 13:
- VALUE SHARE OF DARK CHOCOLATE MARKET BY DISTRIBUTION CHANNEL, %, GLOBAL, 2023 VS 2030
- Figure 14:
- VOLUME OF MILK AND WHITE CHOCOLATE MARKET, METRIC TONNES, GLOBAL, 2018 - 2030
- Figure 15:
- VALUE OF MILK AND WHITE CHOCOLATE MARKET, USD, GLOBAL, 2018 - 2030
- Figure 16:
- VALUE SHARE OF MILK AND WHITE CHOCOLATE MARKET BY DISTRIBUTION CHANNEL, %, GLOBAL, 2023 VS 2030
- Figure 17:
- VOLUME OF GUMS MARKET BY CONFECTIONERY VARIANT, METRIC TONNES, GLOBAL, 2018 - 2030
- Figure 18:
- VALUE OF GUMS MARKET BY CONFECTIONERY VARIANT, USD, GLOBAL, 2018 - 2030
- Figure 19:
- VOLUME SHARE OF GUMS MARKET BY CONFECTIONERY VARIANT, %, GLOBAL, 2018 VS 2024 VS 2030
- Figure 20:
- VALUE SHARE OF GUMS MARKET BY CONFECTIONERY VARIANT, %, GLOBAL, 2018 VS 2024 VS 2030
- Figure 21:
- VOLUME OF BUBBLE GUM MARKET, METRIC TONNES, GLOBAL, 2018 - 2030
- Figure 22:
- VALUE OF BUBBLE GUM MARKET, USD, GLOBAL, 2018 - 2030
- Figure 23:
- VALUE SHARE OF BUBBLE GUM MARKET BY DISTRIBUTION CHANNEL, %, GLOBAL, 2023 VS 2030
- Figure 24:
- VOLUME OF CHEWING GUM MARKET BY SUGAR CONTENT, METRIC TONNES, GLOBAL, 2018 - 2030
- Figure 25:
- VALUE OF CHEWING GUM MARKET BY SUGAR CONTENT, USD, GLOBAL, 2018 - 2030
- Figure 26:
- VOLUME SHARE OF CHEWING GUM MARKET BY SUGAR CONTENT, %, GLOBAL, 2018 VS 2024 VS 2030
- Figure 27:
- VALUE SHARE OF CHEWING GUM MARKET BY SUGAR CONTENT, %, GLOBAL, 2018 VS 2024 VS 2030
- Figure 28:
- VOLUME OF SUGAR CHEWING GUM MARKET, METRIC TONNES, GLOBAL, 2018 - 2030
- Figure 29:
- VALUE OF SUGAR CHEWING GUM MARKET, USD, GLOBAL, 2018 - 2030
- Figure 30:
- VALUE SHARE OF SUGAR CHEWING GUM MARKET BY DISTRIBUTION CHANNEL, %, GLOBAL, 2023 VS 2030
- Figure 31:
- VOLUME OF SUGAR-FREE CHEWING GUM MARKET, METRIC TONNES, GLOBAL, 2018 - 2030
- Figure 32:
- VALUE OF SUGAR-FREE CHEWING GUM MARKET, USD, GLOBAL, 2018 - 2030
- Figure 33:
- VALUE SHARE OF SUGAR-FREE CHEWING GUM MARKET BY DISTRIBUTION CHANNEL, %, GLOBAL, 2023 VS 2030
- Figure 34:
- VOLUME OF SNACK BAR MARKET BY CONFECTIONERY VARIANT, METRIC TONNES, GLOBAL, 2018 - 2030
- Figure 35:
- VALUE OF SNACK BAR MARKET BY CONFECTIONERY VARIANT, USD, GLOBAL, 2018 - 2030
- Figure 36:
- VOLUME SHARE OF SNACK BAR MARKET BY CONFECTIONERY VARIANT, %, GLOBAL, 2018 VS 2024 VS 2030
- Figure 37:
- VALUE SHARE OF SNACK BAR MARKET BY CONFECTIONERY VARIANT, %, GLOBAL, 2018 VS 2024 VS 2030
- Figure 38:
- VOLUME OF CEREAL BAR MARKET, METRIC TONNES, GLOBAL, 2018 - 2030
- Figure 39:
- VALUE OF CEREAL BAR MARKET, USD, GLOBAL, 2018 - 2030
- Figure 40:
- VALUE SHARE OF CEREAL BAR MARKET BY DISTRIBUTION CHANNEL, %, GLOBAL, 2023 VS 2030
- Figure 41:
- VOLUME OF FRUIT & NUT BAR MARKET, METRIC TONNES, GLOBAL, 2018 - 2030
- Figure 42:
- VALUE OF FRUIT & NUT BAR MARKET, USD, GLOBAL, 2018 - 2030
- Figure 43:
- VALUE SHARE OF FRUIT & NUT BAR MARKET BY DISTRIBUTION CHANNEL, %, GLOBAL, 2023 VS 2030
- Figure 44:
- VOLUME OF PROTEIN BAR MARKET, METRIC TONNES, GLOBAL, 2018 - 2030
- Figure 45:
- VALUE OF PROTEIN BAR MARKET, USD, GLOBAL, 2018 - 2030
- Figure 46:
- VALUE SHARE OF PROTEIN BAR MARKET BY DISTRIBUTION CHANNEL, %, GLOBAL, 2023 VS 2030
- Figure 47:
- VOLUME OF SUGAR CONFECTIONERY MARKET BY CONFECTIONERY VARIANT, METRIC TONNES, GLOBAL, 2018 - 2030
- Figure 48:
- VALUE OF SUGAR CONFECTIONERY MARKET BY CONFECTIONERY VARIANT, USD, GLOBAL, 2018 - 2030
- Figure 49:
- VOLUME SHARE OF SUGAR CONFECTIONERY MARKET BY CONFECTIONERY VARIANT, %, GLOBAL, 2018 VS 2024 VS 2030
- Figure 50:
- VALUE SHARE OF SUGAR CONFECTIONERY MARKET BY CONFECTIONERY VARIANT, %, GLOBAL, 2018 VS 2024 VS 2030
- Figure 51:
- VOLUME OF HARD CANDY MARKET, METRIC TONNES, GLOBAL, 2018 - 2030
- Figure 52:
- VALUE OF HARD CANDY MARKET, USD, GLOBAL, 2018 - 2030
- Figure 53:
- VALUE SHARE OF HARD CANDY MARKET BY DISTRIBUTION CHANNEL, %, GLOBAL, 2023 VS 2030
- Figure 54:
- VOLUME OF LOLLIPOPS MARKET, METRIC TONNES, GLOBAL, 2018 - 2030
- Figure 55:
- VALUE OF LOLLIPOPS MARKET, USD, GLOBAL, 2018 - 2030
- Figure 56:
- VALUE SHARE OF LOLLIPOPS MARKET BY DISTRIBUTION CHANNEL, %, GLOBAL, 2023 VS 2030
- Figure 57:
- VOLUME OF MINTS MARKET, METRIC TONNES, GLOBAL, 2018 - 2030
- Figure 58:
- VALUE OF MINTS MARKET, USD, GLOBAL, 2018 - 2030
- Figure 59:
- VALUE SHARE OF MINTS MARKET BY DISTRIBUTION CHANNEL, %, GLOBAL, 2023 VS 2030
- Figure 60:
- VOLUME OF PASTILLES, GUMMIES, AND JELLIES MARKET, METRIC TONNES, GLOBAL, 2018 - 2030
- Figure 61:
- VALUE OF PASTILLES, GUMMIES, AND JELLIES MARKET, USD, GLOBAL, 2018 - 2030
- Figure 62:
- VALUE SHARE OF PASTILLES, GUMMIES, AND JELLIES MARKET BY DISTRIBUTION CHANNEL, %, GLOBAL, 2023 VS 2030
- Figure 63:
- VOLUME OF TOFFEES AND NOUGATS MARKET, METRIC TONNES, GLOBAL, 2018 - 2030
- Figure 64:
- VALUE OF TOFFEES AND NOUGATS MARKET, USD, GLOBAL, 2018 - 2030
- Figure 65:
- VALUE SHARE OF TOFFEES AND NOUGATS MARKET BY DISTRIBUTION CHANNEL, %, GLOBAL, 2023 VS 2030
- Figure 66:
- VOLUME OF OTHERS MARKET, METRIC TONNES, GLOBAL, 2018 - 2030
- Figure 67:
- VALUE OF OTHERS MARKET, USD, GLOBAL, 2018 - 2030
- Figure 68:
- VALUE SHARE OF OTHERS MARKET BY DISTRIBUTION CHANNEL, %, GLOBAL, 2023 VS 2030
- Figure 69:
- VOLUME OF CONFECTIONERY MARKET BY DISTRIBUTION CHANNEL, METRIC TONNES, GLOBAL, 2018 - 2030
- Figure 70:
- VALUE OF CONFECTIONERY MARKET BY DISTRIBUTION CHANNEL, USD, GLOBAL, 2018 - 2030
- Figure 71:
- VOLUME SHARE OF CONFECTIONERY MARKET BY DISTRIBUTION CHANNEL, %, GLOBAL, 2018 VS 2024 VS 2030
- Figure 72:
- VALUE SHARE OF CONFECTIONERY MARKET BY DISTRIBUTION CHANNEL, %, GLOBAL, 2018 VS 2024 VS 2030
- Figure 73:
- VOLUME OF CONFECTIONERY MARKET SOLD VIA CONVENIENCE STORE, METRIC TONNES, GLOBAL, 2018 - 2030
- Figure 74:
- VALUE OF CONFECTIONERY MARKET SOLD VIA CONVENIENCE STORE, USD, GLOBAL, 2018 - 2030
- Figure 75:
- VALUE SHARE OF CONFECTIONERY MARKET SOLD VIA CONVENIENCE STORE BY CONFECTION, %, GLOBAL, 2023 VS 2030
- Figure 76:
- VOLUME OF CONFECTIONERY MARKET SOLD VIA ONLINE RETAIL STORE, METRIC TONNES, GLOBAL, 2018 - 2030
- Figure 77:
- VALUE OF CONFECTIONERY MARKET SOLD VIA ONLINE RETAIL STORE, USD, GLOBAL, 2018 - 2030
- Figure 78:
- VALUE SHARE OF CONFECTIONERY MARKET SOLD VIA ONLINE RETAIL STORE BY CONFECTION, %, GLOBAL, 2023 VS 2030
- Figure 79:
- VOLUME OF CONFECTIONERY MARKET SOLD VIA SUPERMARKET/HYPERMARKET, METRIC TONNES, GLOBAL, 2018 - 2030
- Figure 80:
- VALUE OF CONFECTIONERY MARKET SOLD VIA SUPERMARKET/HYPERMARKET, USD, GLOBAL, 2018 - 2030
- Figure 81:
- VALUE SHARE OF CONFECTIONERY MARKET SOLD VIA SUPERMARKET/HYPERMARKET BY CONFECTION, %, GLOBAL, 2023 VS 2030
- Figure 82:
- VOLUME OF CONFECTIONERY MARKET SOLD VIA OTHERS, METRIC TONNES, GLOBAL, 2018 - 2030
- Figure 83:
- VALUE OF CONFECTIONERY MARKET SOLD VIA OTHERS, USD, GLOBAL, 2018 - 2030
- Figure 84:
- VALUE SHARE OF CONFECTIONERY MARKET SOLD VIA OTHERS BY CONFECTION, %, GLOBAL, 2023 VS 2030
- Figure 85:
- VOLUME OF CONFECTIONERY MARKET BY REGION, METRIC TONNES, GLOBAL, 2018 - 2030
- Figure 86:
- VALUE OF CONFECTIONERY MARKET BY REGION, USD, GLOBAL, 2018 - 2030
- Figure 87:
- VOLUME SHARE OF CONFECTIONERY MARKET BY REGION, %, GLOBAL, 2018 VS 2024 VS 2030
- Figure 88:
- VALUE SHARE OF CONFECTIONERY MARKET BY REGION, %, GLOBAL, 2018 VS 2024 VS 2030
- Figure 89:
- VOLUME OF CONFECTIONERY MARKET BY COUNTRY, METRIC TONNES, AFRICA, 2018 - 2030
- Figure 90:
- VALUE OF CONFECTIONERY MARKET BY COUNTRY, USD, AFRICA, 2018 - 2030
- Figure 91:
- VOLUME SHARE OF CONFECTIONERY MARKET BY COUNTRY, %, AFRICA, 2018 VS 2024 VS 2030
- Figure 92:
- VALUE SHARE OF CONFECTIONERY MARKET BY COUNTRY, %, AFRICA, 2018 VS 2024 VS 2030
- Figure 93:
- VOLUME OF CONFECTIONERY MARKET, METRIC TONNES, EGYPT, 2018 - 2030
- Figure 94:
- VALUE OF CONFECTIONERY MARKET, USD, EGYPT, 2018 - 2030
- Figure 95:
- VALUE SHARE OF CONFECTIONERY MARKET BY CONFECTION, %, EGYPT, 2023 VS 2030
- Figure 96:
- VOLUME OF CONFECTIONERY MARKET, METRIC TONNES, NIGERIA, 2018 - 2030
- Figure 97:
- VALUE OF CONFECTIONERY MARKET, USD, NIGERIA, 2018 - 2030
- Figure 98:
- VALUE SHARE OF CONFECTIONERY MARKET BY CONFECTION, %, NIGERIA, 2023 VS 2030
- Figure 99:
- VOLUME OF CONFECTIONERY MARKET, METRIC TONNES, SOUTH AFRICA, 2018 - 2030
- Figure 100:
- VALUE OF CONFECTIONERY MARKET, USD, SOUTH AFRICA, 2018 - 2030
- Figure 101:
- VALUE SHARE OF CONFECTIONERY MARKET BY CONFECTION, %, SOUTH AFRICA, 2023 VS 2030
- Figure 102:
- VOLUME OF CONFECTIONERY MARKET, METRIC TONNES, REST OF AFRICA, 2018 - 2030
- Figure 103:
- VALUE OF CONFECTIONERY MARKET, USD, REST OF AFRICA, 2018 - 2030
- Figure 104:
- VALUE SHARE OF CONFECTIONERY MARKET BY CONFECTION, %, REST OF AFRICA, 2023 VS 2030
- Figure 105:
- VOLUME OF CONFECTIONERY MARKET BY COUNTRY, METRIC TONNES, ASIA-PACIFIC, 2018 - 2030
- Figure 106:
- VALUE OF CONFECTIONERY MARKET BY COUNTRY, USD, ASIA-PACIFIC, 2018 - 2030
- Figure 107:
- VOLUME SHARE OF CONFECTIONERY MARKET BY COUNTRY, %, ASIA-PACIFIC, 2018 VS 2024 VS 2030
- Figure 108:
- VALUE SHARE OF CONFECTIONERY MARKET BY COUNTRY, %, ASIA-PACIFIC, 2018 VS 2024 VS 2030
- Figure 109:
- VOLUME OF CONFECTIONERY MARKET, METRIC TONNES, AUSTRALIA, 2018 - 2030
- Figure 110:
- VALUE OF CONFECTIONERY MARKET, USD, AUSTRALIA, 2018 - 2030
- Figure 111:
- VALUE SHARE OF CONFECTIONERY MARKET BY CONFECTION, %, AUSTRALIA, 2023 VS 2030
- Figure 112:
- VOLUME OF CONFECTIONERY MARKET, METRIC TONNES, CHINA, 2018 - 2030
- Figure 113:
- VALUE OF CONFECTIONERY MARKET, USD, CHINA, 2018 - 2030
- Figure 114:
- VALUE SHARE OF CONFECTIONERY MARKET BY CONFECTION, %, CHINA, 2023 VS 2030
- Figure 115:
- VOLUME OF CONFECTIONERY MARKET, METRIC TONNES, INDIA, 2018 - 2030
- Figure 116:
- VALUE OF CONFECTIONERY MARKET, USD, INDIA, 2018 - 2030
- Figure 117:
- VALUE SHARE OF CONFECTIONERY MARKET BY CONFECTION, %, INDIA, 2023 VS 2030
- Figure 118:
- VOLUME OF CONFECTIONERY MARKET, METRIC TONNES, INDONESIA, 2018 - 2030
- Figure 119:
- VALUE OF CONFECTIONERY MARKET, USD, INDONESIA, 2018 - 2030
- Figure 120:
- VALUE SHARE OF CONFECTIONERY MARKET BY CONFECTION, %, INDONESIA, 2023 VS 2030
- Figure 121:
- VOLUME OF CONFECTIONERY MARKET, METRIC TONNES, JAPAN, 2018 - 2030
- Figure 122:
- VALUE OF CONFECTIONERY MARKET, USD, JAPAN, 2018 - 2030
- Figure 123:
- VALUE SHARE OF CONFECTIONERY MARKET BY CONFECTION, %, JAPAN, 2023 VS 2030
- Figure 124:
- VOLUME OF CONFECTIONERY MARKET, METRIC TONNES, MALAYSIA, 2018 - 2030
- Figure 125:
- VALUE OF CONFECTIONERY MARKET, USD, MALAYSIA, 2018 - 2030
- Figure 126:
- VALUE SHARE OF CONFECTIONERY MARKET BY CONFECTION, %, MALAYSIA, 2023 VS 2030
- Figure 127:
- VOLUME OF CONFECTIONERY MARKET, METRIC TONNES, NEW ZEALAND, 2018 - 2030
- Figure 128:
- VALUE OF CONFECTIONERY MARKET, USD, NEW ZEALAND, 2018 - 2030
- Figure 129:
- VALUE SHARE OF CONFECTIONERY MARKET BY CONFECTION, %, NEW ZEALAND, 2023 VS 2030
- Figure 130:
- VOLUME OF CONFECTIONERY MARKET, METRIC TONNES, SOUTH KOREA, 2018 - 2030
- Figure 131:
- VALUE OF CONFECTIONERY MARKET, USD, SOUTH KOREA, 2018 - 2030
- Figure 132:
- VALUE SHARE OF CONFECTIONERY MARKET BY CONFECTION, %, SOUTH KOREA, 2023 VS 2030
- Figure 133:
- VOLUME OF CONFECTIONERY MARKET, METRIC TONNES, REST OF ASIA-PACIFIC, 2018 - 2030
- Figure 134:
- VALUE OF CONFECTIONERY MARKET, USD, REST OF ASIA-PACIFIC, 2018 - 2030
- Figure 135:
- VALUE SHARE OF CONFECTIONERY MARKET BY CONFECTION, %, REST OF ASIA-PACIFIC, 2023 VS 2030
- Figure 136:
- VOLUME OF CONFECTIONERY MARKET BY COUNTRY, METRIC TONNES, EUROPE, 2018 - 2030
- Figure 137:
- VALUE OF CONFECTIONERY MARKET BY COUNTRY, USD, EUROPE, 2018 - 2030
- Figure 138:
- VOLUME SHARE OF CONFECTIONERY MARKET BY COUNTRY, %, EUROPE, 2018 VS 2024 VS 2030
- Figure 139:
- VALUE SHARE OF CONFECTIONERY MARKET BY COUNTRY, %, EUROPE, 2018 VS 2024 VS 2030
- Figure 140:
- VOLUME OF CONFECTIONERY MARKET, METRIC TONNES, BELGIUM, 2018 - 2030
- Figure 141:
- VALUE OF CONFECTIONERY MARKET, USD, BELGIUM, 2018 - 2030
- Figure 142:
- VALUE SHARE OF CONFECTIONERY MARKET BY CONFECTION, %, BELGIUM, 2023 VS 2030
- Figure 143:
- VOLUME OF CONFECTIONERY MARKET, METRIC TONNES, FRANCE, 2018 - 2030
- Figure 144:
- VALUE OF CONFECTIONERY MARKET, USD, FRANCE, 2018 - 2030
- Figure 145:
- VALUE SHARE OF CONFECTIONERY MARKET BY CONFECTION, %, FRANCE, 2023 VS 2030
- Figure 146:
- VOLUME OF CONFECTIONERY MARKET, METRIC TONNES, GERMANY, 2018 - 2030
- Figure 147:
- VALUE OF CONFECTIONERY MARKET, USD, GERMANY, 2018 - 2030
- Figure 148:
- VALUE SHARE OF CONFECTIONERY MARKET BY CONFECTION, %, GERMANY, 2023 VS 2030
- Figure 149:
- VOLUME OF CONFECTIONERY MARKET, METRIC TONNES, ITALY, 2018 - 2030
- Figure 150:
- VALUE OF CONFECTIONERY MARKET, USD, ITALY, 2018 - 2030
- Figure 151:
- VALUE SHARE OF CONFECTIONERY MARKET BY CONFECTION, %, ITALY, 2023 VS 2030
- Figure 152:
- VOLUME OF CONFECTIONERY MARKET, METRIC TONNES, NETHERLANDS, 2018 - 2030
- Figure 153:
- VALUE OF CONFECTIONERY MARKET, USD, NETHERLANDS, 2018 - 2030
- Figure 154:
- VALUE SHARE OF CONFECTIONERY MARKET BY CONFECTION, %, NETHERLANDS, 2023 VS 2030
- Figure 155:
- VOLUME OF CONFECTIONERY MARKET, METRIC TONNES, RUSSIA, 2018 - 2030
- Figure 156:
- VALUE OF CONFECTIONERY MARKET, USD, RUSSIA, 2018 - 2030
- Figure 157:
- VALUE SHARE OF CONFECTIONERY MARKET BY CONFECTION, %, RUSSIA, 2023 VS 2030
- Figure 158:
- VOLUME OF CONFECTIONERY MARKET, METRIC TONNES, SPAIN, 2018 - 2030
- Figure 159:
- VALUE OF CONFECTIONERY MARKET, USD, SPAIN, 2018 - 2030
- Figure 160:
- VALUE SHARE OF CONFECTIONERY MARKET BY CONFECTION, %, SPAIN, 2023 VS 2030
- Figure 161:
- VOLUME OF CONFECTIONERY MARKET, METRIC TONNES, SWITZERLAND, 2018 - 2030
- Figure 162:
- VALUE OF CONFECTIONERY MARKET, USD, SWITZERLAND, 2018 - 2030
- Figure 163:
- VALUE SHARE OF CONFECTIONERY MARKET BY CONFECTION, %, SWITZERLAND, 2023 VS 2030
- Figure 164:
- VOLUME OF CONFECTIONERY MARKET, METRIC TONNES, TURKEY, 2018 - 2030
- Figure 165:
- VALUE OF CONFECTIONERY MARKET, USD, TURKEY, 2018 - 2030
- Figure 166:
- VALUE SHARE OF CONFECTIONERY MARKET BY CONFECTION, %, TURKEY, 2023 VS 2030
- Figure 167:
- VOLUME OF CONFECTIONERY MARKET, METRIC TONNES, UNITED KINGDOM, 2018 - 2030
- Figure 168:
- VALUE OF CONFECTIONERY MARKET, USD, UNITED KINGDOM, 2018 - 2030
- Figure 169:
- VALUE SHARE OF CONFECTIONERY MARKET BY CONFECTION, %, UNITED KINGDOM, 2023 VS 2030
- Figure 170:
- VOLUME OF CONFECTIONERY MARKET, METRIC TONNES, REST OF EUROPE, 2018 - 2030
- Figure 171:
- VALUE OF CONFECTIONERY MARKET, USD, REST OF EUROPE, 2018 - 2030
- Figure 172:
- VALUE SHARE OF CONFECTIONERY MARKET BY CONFECTION, %, REST OF EUROPE, 2023 VS 2030
- Figure 173:
- VOLUME OF CONFECTIONERY MARKET BY COUNTRY, METRIC TONNES, MIDDLE EAST, 2018 - 2030
- Figure 174:
- VALUE OF CONFECTIONERY MARKET BY COUNTRY, USD, MIDDLE EAST, 2018 - 2030
- Figure 175:
- VOLUME SHARE OF CONFECTIONERY MARKET BY COUNTRY, %, MIDDLE EAST, 2018 VS 2024 VS 2030
- Figure 176:
- VALUE SHARE OF CONFECTIONERY MARKET BY COUNTRY, %, MIDDLE EAST, 2018 VS 2024 VS 2030
- Figure 177:
- VOLUME OF CONFECTIONERY MARKET, METRIC TONNES, BAHRAIN, 2018 - 2030
- Figure 178:
- VALUE OF CONFECTIONERY MARKET, USD, BAHRAIN, 2018 - 2030
- Figure 179:
- VALUE SHARE OF CONFECTIONERY MARKET BY CONFECTION, %, BAHRAIN, 2023 VS 2030
- Figure 180:
- VOLUME OF CONFECTIONERY MARKET, METRIC TONNES, KUWAIT, 2018 - 2030
- Figure 181:
- VALUE OF CONFECTIONERY MARKET, USD, KUWAIT, 2018 - 2030
- Figure 182:
- VALUE SHARE OF CONFECTIONERY MARKET BY CONFECTION, %, KUWAIT, 2023 VS 2030
- Figure 183:
- VOLUME OF CONFECTIONERY MARKET, METRIC TONNES, OMAN, 2018 - 2030
- Figure 184:
- VALUE OF CONFECTIONERY MARKET, USD, OMAN, 2018 - 2030
- Figure 185:
- VALUE SHARE OF CONFECTIONERY MARKET BY CONFECTION, %, OMAN, 2023 VS 2030
- Figure 186:
- VOLUME OF CONFECTIONERY MARKET, METRIC TONNES, QATAR, 2018 - 2030
- Figure 187:
- VALUE OF CONFECTIONERY MARKET, USD, QATAR, 2018 - 2030
- Figure 188:
- VALUE SHARE OF CONFECTIONERY MARKET BY CONFECTION, %, QATAR, 2023 VS 2030
- Figure 189:
- VOLUME OF CONFECTIONERY MARKET, METRIC TONNES, SAUDI ARABIA, 2018 - 2030
- Figure 190:
- VALUE OF CONFECTIONERY MARKET, USD, SAUDI ARABIA, 2018 - 2030
- Figure 191:
- VALUE SHARE OF CONFECTIONERY MARKET BY CONFECTION, %, SAUDI ARABIA, 2023 VS 2030
- Figure 192:
- VOLUME OF CONFECTIONERY MARKET, METRIC TONNES, UNITED ARAB EMIRATES, 2018 - 2030
- Figure 193:
- VALUE OF CONFECTIONERY MARKET, USD, UNITED ARAB EMIRATES, 2018 - 2030
- Figure 194:
- VALUE SHARE OF CONFECTIONERY MARKET BY CONFECTION, %, UNITED ARAB EMIRATES, 2023 VS 2030
- Figure 195:
- VOLUME OF CONFECTIONERY MARKET, METRIC TONNES, REST OF MIDDLE EAST, 2018 - 2030
- Figure 196:
- VALUE OF CONFECTIONERY MARKET, USD, REST OF MIDDLE EAST, 2018 - 2030
- Figure 197:
- VALUE SHARE OF CONFECTIONERY MARKET BY CONFECTION, %, REST OF MIDDLE EAST, 2023 VS 2030
- Figure 198:
- VOLUME OF CONFECTIONERY MARKET BY COUNTRY, METRIC TONNES, NORTH AMERICA, 2018 - 2030
- Figure 199:
- VALUE OF CONFECTIONERY MARKET BY COUNTRY, USD, NORTH AMERICA, 2018 - 2030
- Figure 200:
- VOLUME SHARE OF CONFECTIONERY MARKET BY COUNTRY, %, NORTH AMERICA, 2018 VS 2024 VS 2030
- Figure 201:
- VALUE SHARE OF CONFECTIONERY MARKET BY COUNTRY, %, NORTH AMERICA, 2018 VS 2024 VS 2030
- Figure 202:
- VOLUME OF CONFECTIONERY MARKET, METRIC TONNES, CANADA, 2018 - 2030
- Figure 203:
- VALUE OF CONFECTIONERY MARKET, USD, CANADA, 2018 - 2030
- Figure 204:
- VALUE SHARE OF CONFECTIONERY MARKET BY CONFECTION, %, CANADA, 2023 VS 2030
- Figure 205:
- VOLUME OF CONFECTIONERY MARKET, METRIC TONNES, MEXICO, 2018 - 2030
- Figure 206:
- VALUE OF CONFECTIONERY MARKET, USD, MEXICO, 2018 - 2030
- Figure 207:
- VALUE SHARE OF CONFECTIONERY MARKET BY CONFECTION, %, MEXICO, 2023 VS 2030
- Figure 208:
- VOLUME OF CONFECTIONERY MARKET, METRIC TONNES, UNITED STATES, 2018 - 2030
- Figure 209:
- VALUE OF CONFECTIONERY MARKET, USD, UNITED STATES, 2018 - 2030
- Figure 210:
- VALUE SHARE OF CONFECTIONERY MARKET BY CONFECTION, %, UNITED STATES, 2023 VS 2030
- Figure 211:
- VOLUME OF CONFECTIONERY MARKET, METRIC TONNES, REST OF NORTH AMERICA, 2018 - 2030
- Figure 212:
- VALUE OF CONFECTIONERY MARKET, USD, REST OF NORTH AMERICA, 2018 - 2030
- Figure 213:
- VALUE SHARE OF CONFECTIONERY MARKET BY CONFECTION, %, REST OF NORTH AMERICA, 2023 VS 2030
- Figure 214:
- VOLUME OF CONFECTIONERY MARKET BY COUNTRY, METRIC TONNES, SOUTH AMERICA, 2018 - 2030
- Figure 215:
- VALUE OF CONFECTIONERY MARKET BY COUNTRY, USD, SOUTH AMERICA, 2018 - 2030
- Figure 216:
- VOLUME SHARE OF CONFECTIONERY MARKET BY COUNTRY, %, SOUTH AMERICA, 2018 VS 2024 VS 2030
- Figure 217:
- VALUE SHARE OF CONFECTIONERY MARKET BY COUNTRY, %, SOUTH AMERICA, 2018 VS 2024 VS 2030
- Figure 218:
- VOLUME OF CONFECTIONERY MARKET, METRIC TONNES, ARGENTINA, 2018 - 2030
- Figure 219:
- VALUE OF CONFECTIONERY MARKET, USD, ARGENTINA, 2018 - 2030
- Figure 220:
- VALUE SHARE OF CONFECTIONERY MARKET BY CONFECTION, %, ARGENTINA, 2023 VS 2030
- Figure 221:
- VOLUME OF CONFECTIONERY MARKET, METRIC TONNES, BRAZIL, 2018 - 2030
- Figure 222:
- VALUE OF CONFECTIONERY MARKET, USD, BRAZIL, 2018 - 2030
- Figure 223:
- VALUE SHARE OF CONFECTIONERY MARKET BY CONFECTION, %, BRAZIL, 2023 VS 2030
- Figure 224:
- VOLUME OF CONFECTIONERY MARKET, METRIC TONNES, REST OF SOUTH AMERICA, 2018 - 2030
- Figure 225:
- VALUE OF CONFECTIONERY MARKET, USD, REST OF SOUTH AMERICA, 2018 - 2030
- Figure 226:
- VALUE SHARE OF CONFECTIONERY MARKET BY CONFECTION, %, REST OF SOUTH AMERICA, 2023 VS 2030
- Figure 227:
- MOST ACTIVE COMPANIES BY NUMBER OF STRATEGIC MOVES, COUNT, GLOBAL, 2018 - 2023
- Figure 228:
- MOST ADOPTED STRATEGIES, COUNT, GLOBAL, 2018 - 2023
- Figure 229:
- VALUE SHARE OF MAJOR PLAYERS, %, GLOBAL
Confectionery Industry Segmentation
Chocolate, Gums, Snack Bar, Sugar Confectionery are covered as segments by Confections. Convenience Store, Online Retail Store, Supermarket/Hypermarket, Others are covered as segments by Distribution Channel. Africa, Asia-Pacific, Europe, Middle East, North America, South America are covered as segments by Region.| Confections | Chocolate | By Confectionery Variant | Dark Chocolate | ||
| Milk and White Chocolate | |||||
| Gums | By Confectionery Variant | Bubble Gum | |||
| Chewing Gum | By Sugar Content | Sugar Chewing Gum | |||
| Sugar-free Chewing Gum | |||||
| Snack Bar | By Confectionery Variant | Cereal Bar | |||
| Fruit & Nut Bar | |||||
| Protein Bar | |||||
| Sugar Confectionery | By Confectionery Variant | Hard Candy | |||
| Lollipops | |||||
| Mints | |||||
| Pastilles, Gummies, and Jellies | |||||
| Toffees and Nougats | |||||
| Others | |||||
| Distribution Channel | Convenience Store | ||||
| Online Retail Store | |||||
| Supermarket/Hypermarket | |||||
| Others | |||||
| Region | Africa | By Country | Egypt | ||
| Nigeria | |||||
| South Africa | |||||
| Rest of Africa | |||||
| Asia-Pacific | By Country | Australia | |||
| China | |||||
| India | |||||
| Indonesia | |||||
| Japan | |||||
| Malaysia | |||||
| New Zealand | |||||
| South Korea | |||||
| Rest of Asia-Pacific | |||||
| Europe | By Country | Belgium | |||
| France | |||||
| Germany | |||||
| Italy | |||||
| Netherlands | |||||
| Russia | |||||
| Spain | |||||
| Switzerland | |||||
| Turkey | |||||
| United Kingdom | |||||
| Rest of Europe | |||||
| Middle East | By Country | Bahrain | |||
| Kuwait | |||||
| Oman | |||||
| Qatar | |||||
| Saudi Arabia | |||||
| United Arab Emirates | |||||
| Rest of Middle East | |||||
| North America | By Country | Canada | |||
| Mexico | |||||
| United States | |||||
| Rest of North America | |||||
| South America | By Country | Argentina | |||
| Brazil | |||||
| Rest of South America | |||||
Need A Different Region or Segment?
Customize Now
Market Definition
- Milk and White Chocolate - Milk chocolates is a solid chocolate made with milk (in the form of either milk powder, liquid milk, or condensed milk) and cocoa solids. White chocolate is made from cocoa butter and milk and contains no cocoa solids whatsoever. The scope includes regular chocolates, low-sugar, and sugar-free variants
- Toffees & Nougats - Toffees include hard, chewy, and small or one-bite candies marketed with labels as toffee or toffee-like confectionery. Nougat is a chewy confection with almond, sugar, and egg white as a basic ingredient; and it originated in Europe and Middle East countries.
- Cereals Bars - A snack composed of breakfast cereal that has been compressed into a bar shape and is held together with a form of edible adhesive. The scope includes snack bars made with cereals such as rice, oats, corn, etc. mixed with a binding syrup. These also include products labeled as cereal bars, cereal treat bars, or grain bars.
- Chewing Gum - This is a preparation for chewing, usually made of flavored and sweetened chicle or such substitutes as polyvinyl acetate. The types of chewing gums included in the scope are sugar-chewing gums and sugar-free chewing gums
| Keyword | Definition |
|---|---|
| Dark Chocolate | Dark chocolate is a form of chocolate containing cocoa solids and cocoa butter without the milk. |
| White Chocolate | White chocolate is the type of chocolate containing the highest percentage of milk solids, typically around or over 30 percent. |
| Milk Chocolate | Milk chocolate is made from dark chocolate that has a low cocoa solid content and higher sugar content, plus a milk product. |
| Hard Candy | A candy made of sugar and corn syrup boiled without crystallizing. |
| Toffees | A hard, chewy, often brown sweet that is made from sugar boiled with butter. |
| Nougats | A chewy or brittle candy containing almonds or other nuts and sometimes fruit. |
| Cereal bar | A cereal bar is a bar-shaped food product, made by pressing cereals and usually dried fruit or berries, which are in most cases held together by glucose syrup. |
| Protein bar | Protein bars are nutrition bars that contain a high proportion of protein to carbohydrates/fats. |
| Fruit & Nut bar | These are often based on dates with other dried fruit and nut additions and, in some cases, flavorings. |
| NCA | The National Confectioners Association is an American trade organization that promotes chocolate, candy, gum and mints, and the companies that make these treats. |
| CGMP | Current good manufacturing practices are those conforming to the guidelines recommended by relevant agencies. |
| Unstandardized foods | Unstandardized foods are those that do not have a standard of identity or that deviate from a prescribed standard in any manner. |
| GI | The glycemic index (GI) is a way of ranking carbohydrate-containing foods based on how slowly or quickly they are digested and increase blood glucose levels over a period of time |
| Skimmed milk powder | Skimmed milk powder is obtained by removing water from pasteurized skim milk by spray-drying. |
| Flavanols | Flavanols are a group of compounds found in cocoa, tea, apples, and many other plant-based foods and beverages. |
| WPC | Whey protein concentrate- the substance obtained by the removal of sufficient nonprotein constituents from pasteurized whey so that the finished dry product contains greater than 25% protein. |
| LDL | Low density Lipoprotein- the bad cholesterol |
| HDL | High density Lipoprotein- the good cholesterol |
| BHT | butylated Hydroxytoluene is a lab-made chemical that is added to foods as a preservative. |
| Carrageenan | Carrageenan is an additive used to thicken, emulsify, and preserve foods and drinks. |
| Free form | Not containing certain ingredients, such as gluten, dairy, or sugar. |
| Cocoa butter | It is a fatty substance obtained from cocoa beans, used in the manufacture of confectionery. |
| Pastellies | A type of of Brazilian candy made from sugar, eggs, and milk. |
| Draggees | Small, round candies that are coated with a hard sugar shell |
| CHOPRABISCO | Royal Belgian Association of the chocolate, pralines, biscuit, and confectionery industry- A trade association that represents the Belgian chocolate industry. |
| European Directive 2000/13 | A European Union directive that regulates the labeling of food products |
| Kakao-Verordnung | The German chocolate ordinance, a set of regulations that define what can be labeled as "chocolate" in Germany. |
| FASFC | Federal Agency for the Safety of the Food Chain |
| Pectin | A natural substance that is derived from fruits and vegetables. It is used in confectionery to create a gel-like texture. |
| Invert sugars | A type of sugar that is made up of glucose and fructose. |
| Emulsifier | A substance that helps to mix to liquids that does not mix together. |
| Anthocyanins | A type of flavonoid that is responsible for the red, purple, and blue colors of confectionery. |
| Functional Foods | Foods that have been modified to provide additional health benefits beyond basic nutrition. |
| Kosher certificate | This certification verifies that the ingredients, production process including all machinery, and/or food-service process complies with the standards of Jewish dietary law |
| Chicory root extract | A natural extract from the chicory root that is a good source of fiber, calcium, phosphorous, and folate |
| RDD | Recommended daily dose |
| Gummies | A chewy gelatin-based candy that is often flavored with fruit. |
| Nutraceuticals | Food or dietary supplements that are claimed to have health benefits. |
| Energy bars | Snack bars that are high in carbohydrates and calories are designed to provide energy on the go. |
| BFSO | Belgian Food Safety Organization for the food chain. |
Need More Details on Market Definition?
Ask a Question
Research Methodology
Mordor Intelligence follows a four-step methodology in all our reports.
- Step-1: Identify Key Variables: In order to build a robust forecasting methodology, the variables and factors identified in Step 1 are tested against available historical market numbers. Through an iterative process, the variables required for market forecast are set, and the model is built on the basis of these variables.
- Step-2: Build a Market Model: Market-size estimations for the forecast years are in nominal terms. Inflation is not a part of the pricing, and the average selling price (ASP) is kept constant throughout the forecast period for each country.
- Step-3: Validate and Finalize: In this important step, all market numbers, variables, and analyst calls are validated through an extensive network of primary research experts from the market studied. The respondents are selected across levels and functions to generate a holistic picture of the market studied.
- Step-4: Research Outputs: Syndicated Reports, Custom Consulting Assignments, Databases & Subscription Platforms

Get More Details On Research Methodology
Download PDF


