
Computer Aided Manufacturing Market Size and Share
Market Overview
| Study Period | 2020 - 2031 |
|---|---|
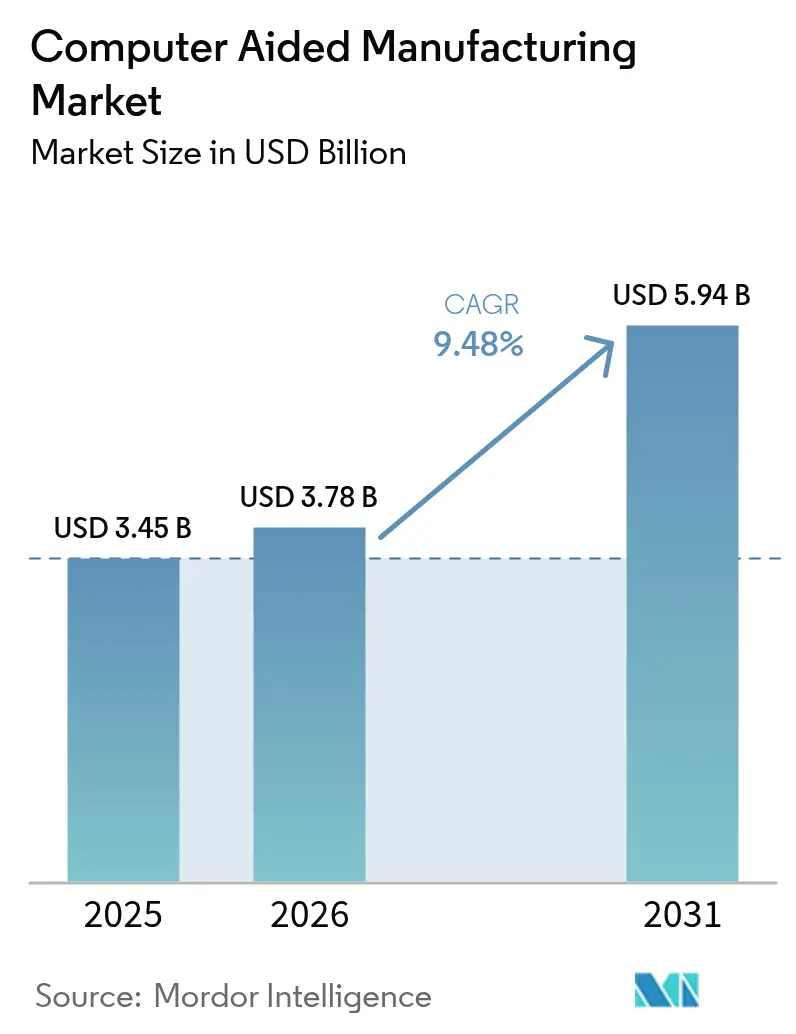
| Market Size (2026) | USD 3.78 Billion |
| Market Size (2031) | USD 5.94 Billion |
| Growth Rate (2026 - 2031) | 9.48% CAGR |
| Fastest Growing Market | Asia Pacific |
| Largest Market | Asia Pacific |
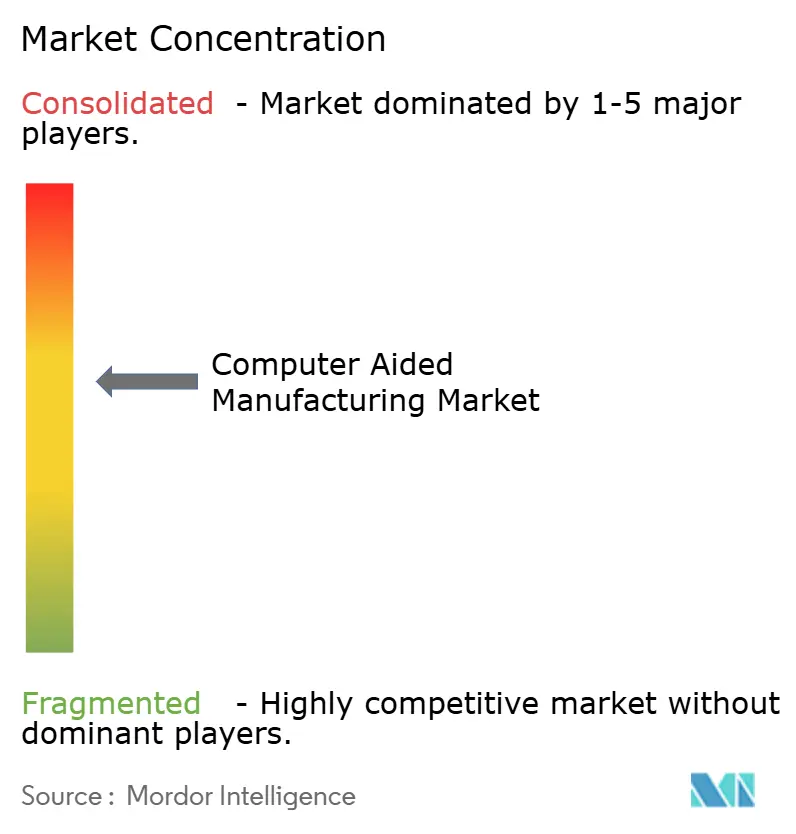
| Market Concentration | Medium |
Major Players *Disclaimer: Major Players sorted in no particular order Image © Mordor Intelligence. Reuse requires attribution under CC BY 4.0. | |
Computer Aided Manufacturing Market Analysis by Mordor Intelligence
The Computer Aided Manufacturing market size is expected to grow from USD 3.45 billion in 2025 to USD 3.78 billion in 2026 and is forecast to reach USD 5.94 billion by 2031 at 9.48% CAGR over 2026-2031. Growth stems from the shift to hybrid subtractive-plus-additive production cells, the fusion of artificial intelligence with tool-path generation, and government re-shoring incentives that favor domestic semiconductor packaging and electric-vehicle components. Vendors able to blend cloud-native collaboration with on-premises security benefit from aerospace programs that span multiple continents while respecting defense-grade intellectual-property protocols. Platform consolidation is intensifying as Siemens, Autodesk, and Dassault Systèmes embed real-time machine analytics inside their design-to-manufacturing suites, giving users predictive maintenance insight that trumps pure programming speed.[1]Source: Autodesk Investor Relations, “Autodesk Reports Fourth Quarter and Fiscal 2025 Results,” investors.autodesk.com
Key Report Takeaways
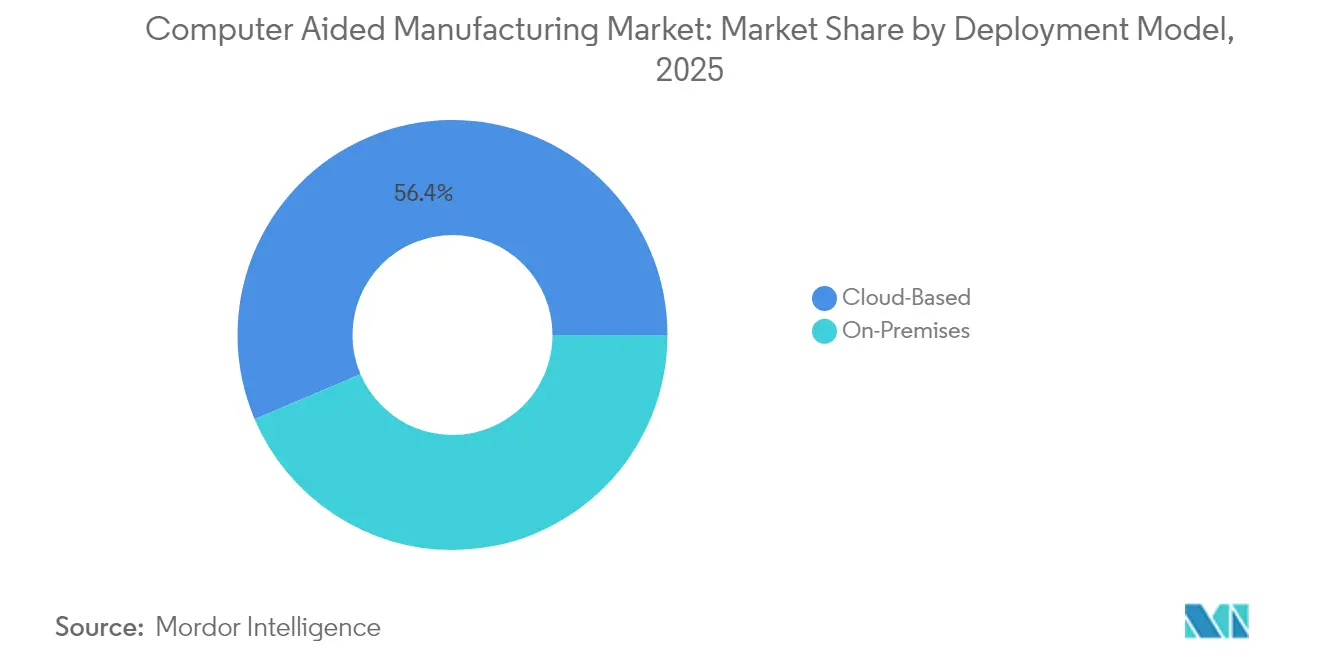
- By deployment model, on-premises solutions held 43.60% of the Computer Aided Manufacturing market share in 2025, whereas cloud platforms are projected to post a 10.72% CAGR through 2031.
- By end-user industry, automotive applications accounted for 35.85% of the Computer Aided Manufacturing market size in 2025; medical devices record the fastest uptake, but growth figures remain undisclosed in audited filings.
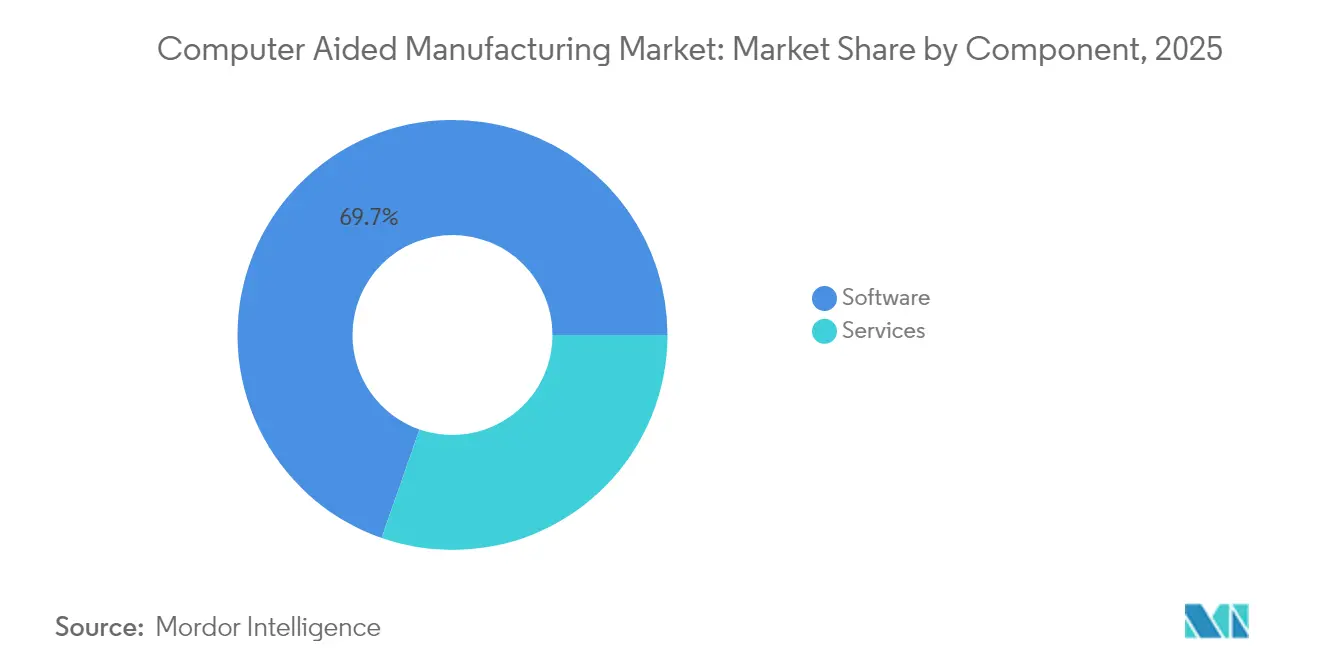
- By component, software captured 69.65% revenue share in 2025, while the services segment is advancing at a 9.92% CAGR thanks to outcome-based contracts.
- By manufacturing process, milling dominated with a 32.85% share in 2025, yet additive workflows are forecast to expand at a 10.02% CAGR as hybrid machines gain traction.
- By geography, Asia-Pacific led with a 46.75% share in 2025 and is set to grow at a 10.33% CAGR, propelled by expanded semiconductor packaging capacity in China, Taiwan, and South Korea.
Note: Market size and forecast figures in this report are generated using Mordor Intelligence’s proprietary estimation framework, updated with the latest available data and insights as of 2026.
Global Computer Aided Manufacturing Market Trends and Insights
Driver Imapct Analysis*
| DRIVER | (~) % IMPACT ON CAGR FORECAST | GEOGRAPHIC RELEVANCE | IMPACT TIMELINE |
|---|---|---|---|
| Rise in hybrid subtractive + additive machining centres | +1.8% | North America, Europe | Medium term (2-4 years) |
| Expanding Industry 4.0 digital threads | +2.1% | Asia-Pacific spill-over to North America | Long term (≥4 years) |
| Ultra-precision demand in semiconductor packaging lines | +1.4% | China, Taiwan, South Korea | Short term (≤2 years) |
| Agile production for local EV platforms | +1.7% | United States, European Union, China | Medium term (2-4 years) |
| Cloud-native CAM for multi-site collaboration | +1.2% | North America, European Union | Long term (≥4 years) |
| Government re-shoring incentives | +0.9% | United States, European Union | Medium term (2-4 years) |
| Source: Mordor Intelligence | |||
Rise in Hybrid Machining Centers Transforms Production Economics
Hybrid systems integrate laser or directed-energy deposition with high-speed finishing inside one enclosure, eliminating secondary setups and cutting raw-material waste by up to 40%. Siemens NX now automates bead-on-wall deposition and finishing toolpaths so manufacturers deposit material only where needed before achieving aerospace-grade surface finish, reducing overall cycle time for complex titanium parts by 25–30%.[2]Source: Siemens Digital Industries Software, “NX Manufacturing,” plm.automation.siemens.com Real-world rollouts still hinge on operators trained to synchronize additive and subtractive motions within microsecond windows, a skill set in short supply across most job shops.
Industry 4.0 Digital Threads Enable Predictive Manufacturing
Closed-loop platforms connect CAM programming parameters to real-time spindle power, vibration, and tool-wear sensors. Hexagon algorithms detect impending tool failure 15–20 minutes in advance and auto-adjust feed rates to hold surface quality within tolerance, mitigating scrap on fragile aerospace alloys.[3]Source: Hexagon Manufacturing Intelligence, “Safran Aircraft Engines Accelerates Training,” hexagon.com These solutions require dense sensor networks and high-throughput analytics, restricting adoption to plants where part value justifies the capital outlay.
Ultra-Precision Packaging Lines Drive CAM Innovation
Advanced fan-out wafer-level packages demand drilling tolerances tighter than 5 µm with via densities surpassing 10,000 interconnects per mm². Taiwan Semiconductor Manufacturing Company employs CAM modules that run thermal-distortion simulations on substrate stacks, then compensate toolpaths in-process to avoid warpage during 100,000-rpm micro-drilling.[4]Source: Taiwan Semiconductor Manufacturing Company, “Advanced Packaging Platform,” tsmc.com Traditional general-purpose CAM engines cannot meet these tolerances, prompting vendors to release niche physics-based add-ons for substrate machining.
EV Platform Localization Accelerates Precision Machining Demand
Battery housings machined to ±0.1 mm enable uniform thermal dissipation and crash safety across operating ranges from –40 °C to 85 °C. Tesla uses finite-element-augmented toolpaths to control residual stress in large aluminum castings, maintaining dimensional accuracy while halving finishing passes.[5]Source: Tesla, “Gigafactory 1,” tesla.com Localization compels CAM providers to tailor parameter libraries to regional alloys and heat-treatment specs, converting software from a programming utility to a safeguard for product integrity.
Restraints Impact Analysis*
| RESTRAINTS | (~) % IMPACT ON CAGR FORECAST | GEOGRAPHIC RELEVANCE | IMPACT TIMELINE |
|---|---|---|---|
| Proliferation of open-source or low-cost CAM | -1.1% | Global | Short term (≤2 years) |
| Persistent skills gap in NC programming | -1.6% | North America, Europe | Long term (≥4 years) |
| IP-security concerns in Défense cloud projects | -0.8% | United States, Europe | Medium term (2-4 years) |
| Fragmented machine-tool controller standards | -0.7% | Global | Long term (≥4 years) |
| Source: Mordor Intelligence | |||
Open-Source CAM Alternatives Challenge Commercial Pricing Models
FreeCAD PathWorkbench now outputs 2.5-axis G-code at no license cost, making it a credible entry-level choice for schools and micro-workshops. Commercial vendors counter by bundling AI-driven optimization and cloud collaboration, features that exceed the computing means of most community projects, yet must guard against basic modules edging toward commoditization.
Skills Gap in CNC Programming Constrains Market Expansion
Over 430,000 machining jobs in the United States remain open, prolonging CAM rollouts where post-processing know-how is as critical as software features. Digital-twin trainers shrink onboarding time by 40%, but their six-figure hardware cost puts them out of reach for many tier-two suppliers, sustaining the labor bottleneck well past 2028.
*Our forecasts treat driver/restraint impacts as directional, not additive. The impact forecasts reflect baseline growth, mix effects, and variable interactions.
Segment Analysis
By Deployment Model: Cloud Momentum Outpaces Security Doubts
Cloud-hosted suites still represent a minority of the overall Computer Aided Manufacturing market, but their 10.72% CAGR through 2031 underscores an irreversible direction. Aerospace groups with plants on three continents rely on browser-based toolpath editing to hand off jobs overnight, trimming lead times by 20–25%. Defense contractors resist full migration because ITAR rules demand onsite data sovereignty; consequently, hybrid stacks local post-processors linked to cloud solvers form the bridge. Edge gateways retrofit older machines lacking OPC-UA or MTConnect, letting them stream encrypted data without controller replacement. Subscription models shift costs from capital budgets to operating expenses, a boon for small shops that previously deferred software upgrades. Cloud analytics also enable vendors to benchmark spindle utilization across an anonymized fleet, feeding predictive-maintenance dashboards that slash unscheduled downtime. As zero-trust architectures mature, even conservative sectors plan pilot migrations by 2027, suggesting the Computer Aided Manufacturing market will cross a psychological cloud-adoption threshold within the next budget cycle.
The on-premises base nevertheless remains indispensable for plants with air-gapped networks and proprietary alloy formulations. Vendors court these accounts by licensing digital-thread modules that reside behind the firewall yet sync selected metadata to a cloud vault for remote experts. This twin-track strategy stabilizes license renewals while boosting recurring revenue as customers graduate to hybrid analytics. Over time, discrete pricing between deployment modes may vanish as platform subscription tiers simply toggle cloud compute credits on or off. With cyber-insurance premiums now reflecting machine-tool network exposure, CFOs increasingly factor security accreditation into total cost of ownership. Consequently, the Computer-Aided Manufacturing market is evolving toward flexible tenancy rather than binary cloud-versus-on-site choices.


By End-User Industry: Automotive Scale Hides Rapid Specialization
Automotive held 35.85% revenue in 2025, making it the anchor segment of the broader Compute Aided Manufacturing market. Yet the shift from internal-combustion machining to electric-vehicle parts challenges long-standing toolpath libraries. Battery tray milling demands thin-wall strategies that manage chatter while sustaining throughput in high-silicon aluminum. Meanwhile, aerospace and defense, though smaller, command premium licenses for 5-axis and composite machining. Medical-device firms adopt AI-assisted parameter tuning to meet ISO 13485 traceability, letting single-operator cells hit sub-10 µm tolerances without manual edits. Electronics and semiconductor packaging operators require thermal-aware drill sequencing to prevent copper delamination during 100,000-rpm via drilling, a niche that the latest CAM modules fulfill through physics solvers. Cross-pollination is rising: medical device shops replicate aerospace surface-finish routines, while automotive tiers import wafer-fab cleanliness protocols for battery modules, expanding the total addressable market of Computer Aided Manufacturing.
Diversification inside automaking is equally profound. Gigacasting of structural components eliminates dozens of stamped parts, but introduces massive CNC finishing of die-cast aluminum, requiring high material-removal rates and robust tool-life models. Suppliers investing in these cells demand software that auto-compensates for tool-wear drift across 20-hour unmanned shifts. In contrast, niche hypercar builders focus on carbon-fiber trim, using 5-axis routers and probe-based path updates each production cycle. Such divergence means one vertical now spans multiple CAM license tiers, ensuring that the Computer Aided Manufacturing market retains depth even if overall car volumes level off.
By Component: Services Mark the Path to Maturity
Software still fuels 69.65% of 2025 spending, but value is migrating to services that guarantee results rather than features. In an outcome-based contract, a vendor commits to a 15% cycle-time cut; fee triggers on verified spindle logs rather than seats sold. Remote monitoring, enabled by secure telemetry, lets service teams tweak strategies overnight, delivering continuous improvement without plant visits. Training remains the fastest-growing service subset. Multi-shift lines cannot afford week-long classroom sessions, so micro-learning modules inside the CAM UI deliver 5-minute videos keyed to the toolpath currently on screen, trimming ramp-up friction. Consulting engagements dive into fixturing, coolant chemistry, and insert selection, proving that modern CAM optimization is multidisciplinary. As license margins taper, vendors rely on this service layer to sustain R&D investment, supporting the long-run evolution of the Computer Aided Manufacturing industry.
Hardware service bundles are also emerging. Hybrid machine makers partner with CAM vendors to package post-processors, wear monitoring, and predictive-maintenance analytics into monthly machine-as-a-service fees. This bundling locks in ecosystem loyalty and smooths cash flow for both parties. Consequently, the Computer Aided Manufacturing market sees lines blur between software houses, machine OEMs, and tool suppliers, all vying to own the utilization-based revenue stream.
By Manufacturing Process: Additive Upsets Traditional Hierarchies
Milling’s 32.85% share remains secure for complex prismatic parts, yet hybrid deposition threatens to siphon work that once required five separate setups. Laser-powder or wire-arc heads build near-net shapes that finish in a single clamping, collapsing throughput time and conserving titanium billet stock. Turning lines adopt in-process probing so their own CAM routines auto-correct diameter drift through closed-loop offsets. Drilling benefits from peck-optimization algorithms that slice cycle time on 400-mm-deep holes for aerospace fuel manifolds. Multi-axis collision-avoidance modules now propose machine-head orientation in millisecond increments, reducing air-cut travel by 15%. Each of these gains reinforces the overall Computer Aided Manufacturing market trajectory by adding addressable complexity without new machine purchases.
Additive, clocking a 10.02% CAGR, forces CAM developers to store volumetric-build history alongside conventional toolpaths. That history later drives repair strategies where worn turbine blades receive additive cladding, then five-axis re-finishing. As deposition heads evolve, expect CAM kernels to incorporate variable-energy models to manage metallurgical gradients, confirming that the Computer Aided Manufacturing market size for process-agnostic platforms is likely to accelerate beyond current forecasts.
Geography Analysis
Asia-Pacific’s 46.75% share underscores its manufacturing heft, yet the region still wrestles with CNC protocol fragmentation that complicates plug-and-play interoperability. Chinese policy favors indigenous CAM algorithms tied to homegrown controllers, spurring parallel ecosystems that global vendors must bridge through dual-language post-processors and open-API tool libraries. Japan’s machine OEMs integrate CAM directly into control firmware, shortening toolpath load times but locking customers into proprietary stacks. India’s Production Linked Incentive schemes subsidize CAM licenses if tied to workforce upskilling, giving vendors a foothold in an emerging mid-market that could rival traditional giants by 2030.
North American users lead in cloud adoption, partly because the CHIPS Act funnels USD 52 billion into regional fabs that require distributed programming sooner than brick-and-mortar capacity is completed. Europe champions energy-efficient machining, mandating compressed-air reduction and tool reuse targets that CAM strategy simulators now model in kilowatt-hours per part. Data-sovereignty rules add friction, but tier-one suppliers accept localized data lakes in exchange for cross-plant optimization algorithms. These regional nuances ensure the Computer Aided Manufacturing market maintains broad diversification, cushioning it against localized downturns.


Regulatory Landscape
The regulatory environment shaping CAM adoption is increasingly linked to machinery safety, digital documentation, and cross-border trade compliance. In the European Union, the Machinery Regulation (EU) 2023/1230 has been finalized and becomes applicable from January 2027, increasing expectations around updated risk assessment and technical documentation, including digital functions such as software updates in connected machinery ecosystems.
Standards alignment also affects CAM-enabled equipment exports and interoperability. A near-term compliance anchor is the move to EN ISO 13849-1:2026 for functional safety verification for CNC machine tools and automated production lines exported to the EU, which adds documentation and validation workload across machine OEMs, integrators, and the CAM and post-processor ecosystem. In the United States, trade policy signals around industrial machinery have intensified, including a Section 232 investigation initiated in September 2025 into imports of robotics and industrial machinery and a January 2026 proclamation adjusting imports of semiconductor manufacturing equipment, both of which can influence sourcing decisions for automation hardware that CAM workflows depend on.
Value Chain Analysis
The CAM value chain starts with core software platform development (CAD/CAM kernels, simulation, post-processing, and increasingly AI-assisted toolpath automation), then extends to integrations with controllers and shopfloor connectivity layers (OPC-UA/MTConnect gateways, probing, and machine telemetry). It ultimately moves into deployment and monetization through direct sales and channel partners, subscriptions, and outcome-based services. Suite vendors such as Autodesk, Siemens, and Dassault Systèmes typically anchor the upstream platform layer, while specialists and ecosystem partners supply verification, probing, and machine connectivity components needed to convert toolpaths into production-ready NC programs.
Downstream, system integrators, machine-tool OEMs, and end users (automotive, aerospace and defense, medical devices, and electronics and semiconductor) translate CAM capability into productivity and quality outcomes, with services such as training, process optimization, and closed-loop monitoring acting as a key margin layer. Physical supply constraints in CNC ecosystems can still affect CAM-led modernization projects. In March 2026, industry reporting cited lead times for mission-critical CNC spare parts such as servo motor feedback encoders and spindle bearing assemblies doubling to roughly 12-16 weeks, which can delay commissioning, retrofits, and the rollout cadence of sensor-driven digital thread initiatives that depend on stable machine uptime and consistent hardware availability.
Competitive Landscape
The market’s top tier, Autodesk, Siemens Digital Industries, and Dassault Systèmes, leverages end-to-end CAD-CAM-CAE suites that embed simulation, tool-life analytics, and machine monitoring inside one license. Autodesk’s Make segment posted USD 176 million in Q4 FY 2025, a 28% jump over the prior year, evidencing the pull of integrated cloud offerings. Siemens complements its NX suite with edge-device agents that stream spindle-load curves to MindSphere for fleet-wide benchmarking, giving it an industrial IoT advantage. Dassault Systèmes’ 22% 3DEXPERIENCE revenue surge in 2024 reflects demand from electronics OEMs seeking uniform digital threads across PCB and mechanical plants.
Mid-market specialist Mastercam, acquired by Sandvik in 2024, retains dominance in small-to-medium job shops. Its 2026 release adds AI-assisted feature recognition that slices programming time by 30%, a vital capability where few programmers handle diverse part geometries. Hexagon focuses on digital-twin training systems, partnering with Safran Aircraft Engines to slash machinist onboarding time by 40%, reinforcing services-centric competition. FreeCAD and other open-source paths nibble at entry-level functions, forcing commercial vendors to launch lower-priced subscription tiers yet bundling advanced additive modules to defend margins. Overall, competition hinges on how quickly vendors can fuse predictive analytics with user-friendly automation without sacrificing human override, a balance that defines customer trust.
Computer Aided Manufacturing Industry Leaders
Autodesk Inc.
Siemens Digital Industries Software
Dassault Systèmes SE
Hexagon AB
CNC Software LLC (Mastercam)
- *Disclaimer: Major Players sorted in no particular order

Market Opportunities and Future Outlook
One opportunity area is the expansion from programming-only CAM into closed-loop, cross-domain workflows that link CAD/CAM with operations, verification, and shopfloor data. This is visible in vendor moves that broaden CAM into manufacturing execution and asset maintenance contexts. For example, Autodesk signed a definitive agreement in May 2026 to acquire MaintainX (about USD 3.6 billion), aiming for a more unified platform for operations workflows that can connect work orders, maintenance events, and production context to manufacturing engineering decisions.
Another opportunity is the tooling push for AI-assisted and autonomous manufacturing across both CNC and robotic machining. Siemens released NX for Manufacturing 2606 in June 2026, including background toolpath generation and enhanced on-machine probing for autonomous correction. In July 2026, RoboDK launched RoboDK CAM aimed at generating robotic machining programs directly from CAD. Platform-level integration between engineering and sourcing also creates whitespace for CAM-adjacent manufacturability intelligence. In May 2026, Siemens partnered with Xometry and committed a USD 50 million investment to embed AI-native manufacturability and sourcing intelligence within Siemens Xcelerator, connecting engineering intent to procurement and capacity decisions in a way that can influence CAM workflow standardization across multi-site manufacturing networks.
Recent Industry Developments
- May 2026: Autodesk entered a definitive agreement to acquire MaintainX for approximately USD 3.6 billion, targeting tighter integration of operations workflows into its platform. The move strengthens the bridge between engineering-driven manufacturing software and plant-level execution and maintenance data, expanding CAM-adjacent value in continuous improvement and asset availability.
- April 2026: Hexagon released an updated version of EDGECAM, adding capabilities such as RaceLineFinishing to speed CNC program preparation and verification. Faster verification and finishing-path automation supports shorter programming cycles and reduces the risk of scrap or rework when shops push higher spindle utilization.
- April 2025: Siemens Digital Industries Software acquired DownStream Technologies, adding PCB manufacturing CAM assets such as CAM350 to its portfolio. The acquisition broadens Siemens reach in electronics manufacturing workflows and reinforces convergence across mechanical and electronic production toolchains within a single digital thread strategy.


Research Methodology Framework and Report Scope
Market Definition and Coverage
For this methodology, the computer aided manufacturing (CAM) market includes software tools and related services that convert digital part designs into machine instructions and manufacturing workflows, including programming, simulation, and process planning used on the factory floor.
Scope exclusions: We exclude general-purpose CAD design tools that are not used for manufacturing programming, plus stand-alone machine tools and hardware sales unless bundled with CAM software or services value.
Segmentation Overview
- By Deployment Model
- On-Premises
- Cloud-Based
- By End-User Industry
- Aerospace and Defence
- Automotive
- Medical Devices
- Energy and Utilities
- Electronics and Semiconductor
- Industrial Machinery
- By Component
- Software
- Services
- By Manufacturing Process
- Milling
- Turning
- Drilling
- Multi-Axis / 5-Axis
- Additive Manufacturing
- By Geography
- North America
- United States
- Canada
- Mexico
- South America
- Brazil
- Argentina
- Rest of South America
- Europe
- Germany
- United Kingdom
- France
- Russia
- Rest of Europe
- Asia-Pacific
- China
- Japan
- India
- South Korea
- South-East Asia
- Rest of Asia-Pacific
- Middle East and Africa
- Middle East
- Saudi Arabia
- United Arab Emirates
- Rest of Middle East
- Africa
- South Africa
- Egypt
- Rest of Africa
- Middle East
- North America
Data Sources, Market Sizing, and Validation
Desk Research
Desk work started with mapping the demand side to real manufacturing activity, then linking it to CAM spending patterns by industry and region. Public references anchored model inputs, including US Census Bureau manufacturing statistics, Bureau of Labor Statistics productivity and employment series, Eurostat industrial production indicators, UN Comtrade trade flows for machinery and metalworking equipment, and OECD manufacturing and technology datasets.
We also reviewed company filings, earnings call commentary, product documentation, and reputable press coverage to understand pricing direction and deployment shifts between on-premises and cloud-based use. Where available, paid subscriptions for company financials and intelligence, patent databases, and global contracts and tenders were used to verify vendor exposure and adoption cues without relying on a single disclosure. The desk sources listed above are illustrative only, and many other public and subscription sources were also checked for collection, validation, and clarification.
Primary Interviews and Surveys
Field inputs came from interviews and structured surveys with CAM users, implementation partners, and industry specialists focused on machining, fabrication, and automation programs. Respondent input was used to confirm what gets counted as CAM spend, test adoption by end-user industry (such as automotive and aerospace), and align assumptions on license types, service attach rates, and regional buying cycles across APAC, EMEA, and the Americas.
Distribution of primary research fieldwork respondents
| Company type | Respondent position | Region |
|---|---|---|
| Top tier: 34% | CXOs: 13% | APAC: 39% |
| Mid tier: 48% | Functional/Unit leaders: 31% | EMEA: 36% |
| Smaller Players: 18% | Managers: 56% | Americas: 25% |
Market-Sizing & Forecasting
Sizing starts with a top-down build where manufacturing output, machine tool and automation investment signals, and the share of plants using digital machining workflows are used to reconstruct the addressable CAM demand pool by region. To keep totals realistic, we then corroborate results with selective bottom-up approximations, including sampled vendor revenue exposure, channel checks for typical deal sizes, and ASP times volume logic for CAM seats and services.
Key inputs that move the model include cloud-based deployment adoption versus on-premises renewal behavior, software-to-services mix, multi-axis machining penetration in high-precision industries, the pace of new CNC and robotics installations, and the typical upgrade cycle for post-processors and simulation modules. When bottom-up signals are missing for smaller countries, spend is inferred using comparable manufacturing intensity and installed base indicators, then adjusted during expert reviews.
Forecasting uses scenario analysis supported by multivariate regression. Manufacturing production outlook, capital spending expectations, and digitalization programs are treated as the main drivers. The final forecast path is only locked after assumptions on price progression, seat growth, and service attach are aligned with what industry respondents expect in their budget cycles.
Data Validation & Update Cycle
Validation is handled through repeated cross-checks between the model output and independent market signals, including regional manufacturing growth, automation investment trends, and the observed shift toward cloud subscriptions. Outliers are investigated at the country and end-user levels, and assumptions are revisited when a variance cannot be explained by a clear driver such as deployment mix or pricing.
Before sign-off, the model goes through multi-step analyst reviews where calculations, units, and currency timing are checked, followed by targeted re-contacts if key inputs look unstable. Reports are refreshed annually, and interim updates are made when material events occur that can move demand or pricing. Right before delivery, a final scan is done so clients receive the most current view that can be supported by the latest data checks.
Mordor Intelligence's Computer Aided Manufacturing Market Size Measured Against Other Published Estimates
Published CAM market values often differ because each publisher draws the line differently around what counts as CAM, which year is treated as the anchor, and how cloud subscriptions and services are recognized. We focus on keeping scope consistent across regions, and on making sure the math can be traced back to manufacturing activity signals and realistic spending behavior.
The largest gap drivers typically come from whether estimates count only CAM software or also include adjacent engineering tools, how they treat services like implementation and training, and whether they apply aggressive adoption curves for cloud deployments. Differences also show up from currency conversion timing, the use of older base years that are not revalidated, and assumptions on price increases that are not tested against user-side budgets and renewal patterns.
Benchmark comparison
| Source | Market Size | Gaps in Research Methodology |
|---|---|---|
| Mordor Intelligence | USD 3.78 B (2026) | |
| Industry Research Publisher A | USD 3.73 B (2024) | Uses a different anchor year and a broader component split that can shift what is counted as CAM solutions versus software, which makes cross-year comparisons sensitive to deployment mix assumptions. |
| Trade Release B | USD 3.20 B (2022) | Relies on an earlier base year and higher long-run extrapolation to 2030, with less visibility on how services and subscription pricing are refreshed as manufacturing investment cycles change. |
The table shows that the spread is mainly explained by timing and what is included, rather than a disagreement on demand direction. When software and services are kept inside CAM, and pricing and adoption are rechecked against manufacturing output and automation signals each refresh, the estimate stays tied to the actual CAM spending pool, which is the key modeling choice applied by Mordor Intelligence.


Key Questions Answered in the Report
How fast is cloud deployment growing within Computer Aided Manufacturing?
Cloud CAM solutions are projected to grow at 10.72% CAGR to 2031, outpacing the overall market as aerospace and electronics firms require real-time global collaboration.
Which sector currently spends the most on CAM software?
Automotive represents 35.85% of 2025 revenue, though spending is shifting from engine machining to battery housing and gigacasting processes.
What is the biggest technical driver behind hybrid machining adoption?
The ability to deposit material only where needed and finish it in one setup cuts material waste by up to 40% and compresses cycle times by 25–30%.
Why are services expanding faster than software sales?
Manufacturers want outcome-based contracts where vendors guarantee cycle-time or quality improvements, pushing services to a 9.92% CAGR through 2031.
Page last updated on:






