
Compressed Natural Gas (CNG) Dispenser Market Size and Share
Market Overview
| Study Period | 2021 - 2031 |
|---|---|
| Market Size (2026) | USD 317.43 Million |
| Market Size (2031) | USD 492.61 Million |
| Growth Rate (2026 - 2031) | 9.18 % |
| Fastest Growing Market | Asia Pacific |
| Largest Market | Asia Pacific |
| Market Concentration | Medium |
Major Players *Disclaimer: Major Players sorted in no particular order Image © Mordor Intelligence. Reuse requires attribution under CC BY 4.0. | |
Compressed Natural Gas (CNG) Dispenser Market Analysis by Mordor Intelligence
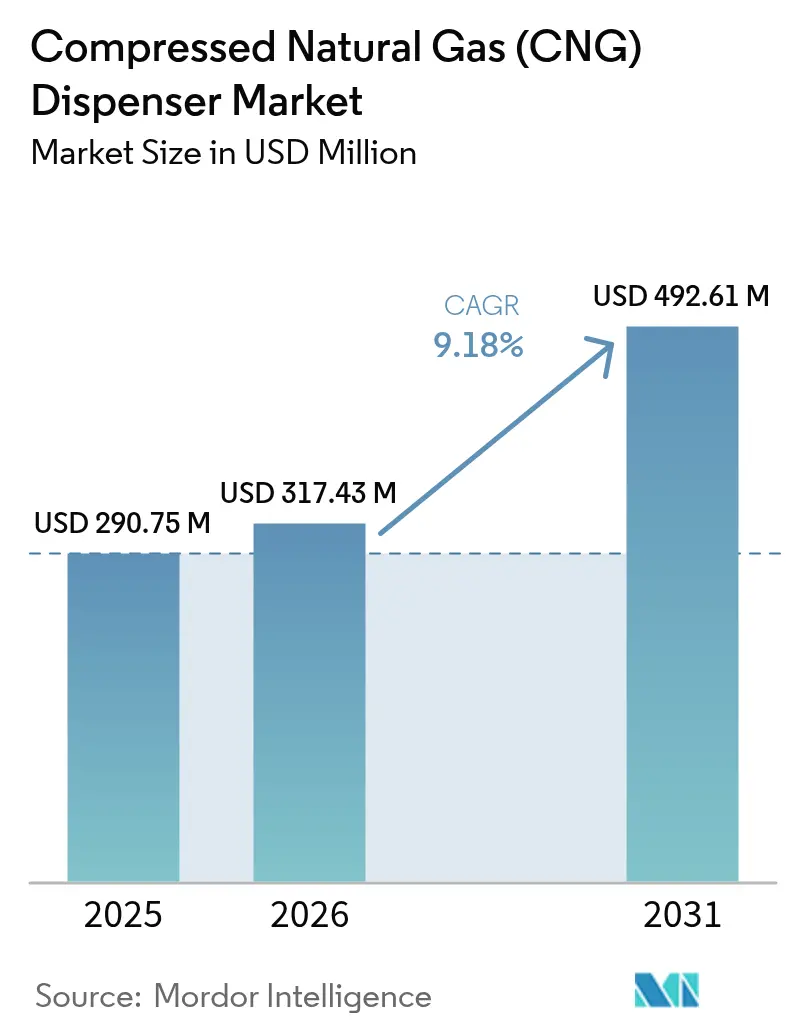
The Compressed Natural Gas Dispenser Market size is expected to grow from USD 290.75 million in 2025 to USD 317.43 million in 2026 and is forecast to reach USD 492.61 million by 2031 at 9.18% CAGR over 2026-2031.
Global demand is gaining momentum from stringent emission mandates, USD 635 million in U.S. federal grants for alternative-fuel stations, and accelerated fleet conversions, collectively shortening the payback periods for new outlets. Growing natural-gas vehicle (NGV) sales in Asia, federal corridor build-outs in North America, and meter upgrade cycles driven by methane-slip rules further underpin the upward trajectory of the CNG dispenser market. Competitive positioning centers on hydrogen-ready modular systems, IoT-enabled uptime optimization, and acquisition-led scale building that reinforce integrated clean-energy portfolios. Government support outweighs capital hurdles in most core regions, yet budget shifts toward EV charging and gas-quality variability introduce operational and funding headwinds for traditional participants in the CNG dispenser market.
Key Report Takeaways
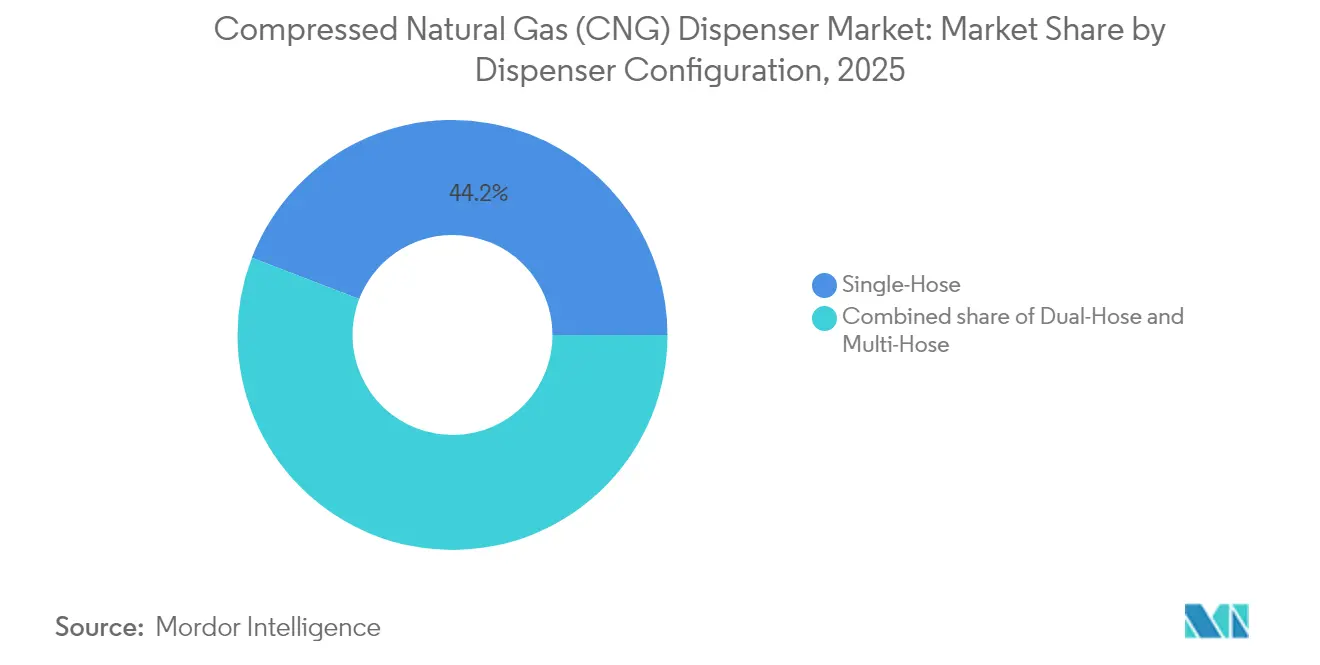
- By dispenser configuration, single-hose units held 44.15% of the CNG dispenser market share in 2025; multi-hose systems are projected to post a 12.7% CAGR through 2031.
- By station type, fast-fill outlets accounted for 59.05% of the CNG dispenser market size in 2025, while mobile/portable units are forecasted to expand at a 13.3% CAGR through 2031.
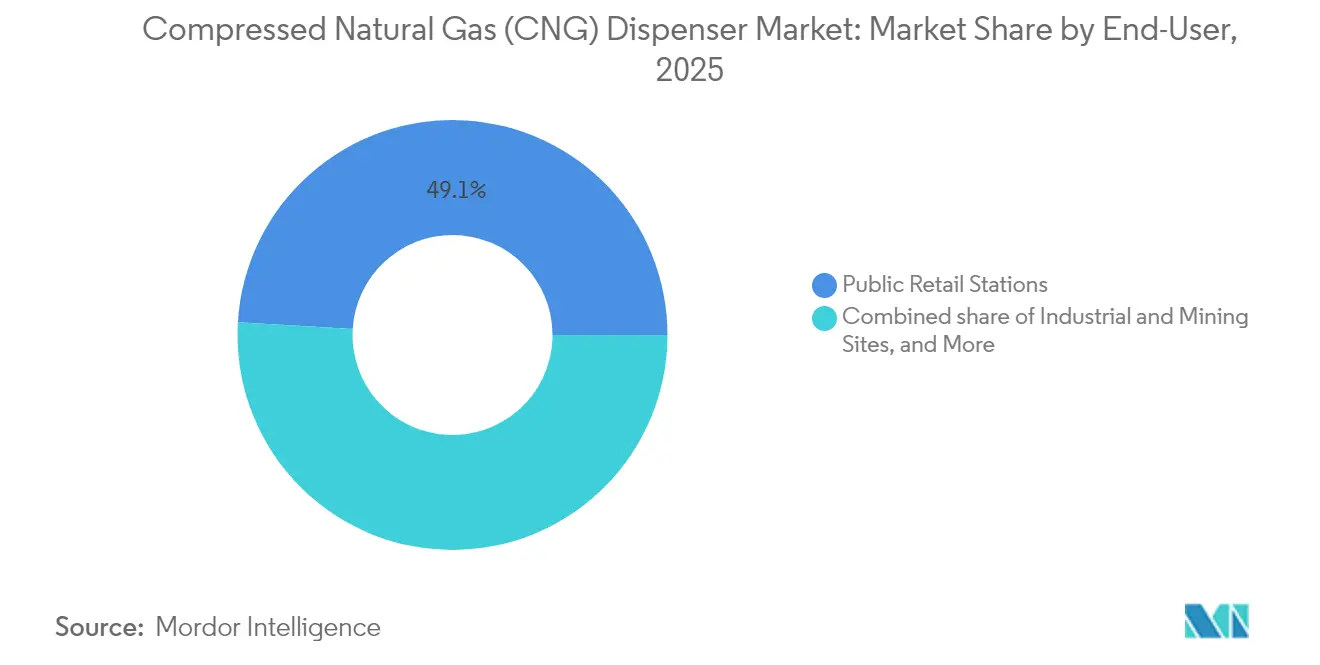
- By end-user, public retail locations accounted for 49.05% of demand in 2025, while industrial and mining sites recorded the fastest growth at a 12.4% CAGR.
- By geography, the Asia-Pacific region led with 47.95% revenue in 2025; it is anticipated to maintain a 10.4% CAGR through 2031.
Note: Market size and forecast figures in this report are generated using Mordor Intelligence’s proprietary estimation framework, updated with the latest available data and insights as of 2026.
Global Compressed Natural Gas (CNG) Dispenser Market Trends and Insights
Drivers Impact Analysis*
| Driver | (~) % Impact on CAGR Forecast | Geographic Relevance | Impact Timeline |
|---|---|---|---|
| Government incentives & rapid CNG station build-outs | 2.10% | North America, Asia-Pacific | Medium term (2-4 years) |
| Lower total-cost-of-ownership for fleet operators | 1.80% | Global, stronger in Asia-Pacific & South America | Long term (≥ 4 years) |
| Rising NGV sales in Asia & South America | 1.50% | Asia-Pacific core, spill-over to South America | Medium term (2-4 years) |
| IoT-enabled predictive maintenance | 1.20% | North America & EU, expanding to Asia-Pacific | Short term (≤ 2 years) |
| Hydrogen-ready modular dispensers | 0.90% | EU & North America | Long term (≥ 4 years) |
| Stricter methane-slip monitoring | 0.70% | North America & EU | Short term (≤ 2 years) |
| Source: Mordor Intelligence | |||
Government incentives & rapid CNG station build-outs
Federal backing reshapes economic fundamentals for the CNG dispenser market. The United States awarded USD 635 million in 2025 grants covering 27 states, directly subsidizing dispenser installations for freight corridors.[1] The Infrastructure Investment and Jobs Act earmarks USD 2.5 billion over five years for alternative-fuel corridors, providing multi-layered funding that reduces capital risk. California adds USD 95.2 million through its Clean Transportation Program, while a 30% federal tax credit lowers out-of-pocket hardware costs.[2] Similar provincial incentives in Canada and conversion credits in Utah and Georgia expand the support network. Reduced effective project costs shorten payback periods and encourage operators to specify higher-throughput, hydrogen-compatible dispensers that future-proof installations.
Lower total-cost-of-ownership for fleet operators
Natural gas maintains a durable price discount to diesel, averaging USD 1.17 per diesel gallon equivalent in 2025.[3] Heavy-duty engines, such as Cummins’ X15N, provide 1,850 lb-ft of torque while eliminating the need for diesel exhaust fluid, thereby cutting running expenses and maintenance downtime.[4] Light-duty bi-fuel pickups achieve combined ranges of nearly 650 miles and realize emission reductions of 13–40% compared to gasoline alternatives. Fleet operators leveraging private time-fill depots lock in multiyear gas contracts, insulating budgets from oil-price volatility. Collectively, these economics bolster procurement plans and funnel recurring demand into the CNG dispenser market.
Rising NGV sales in Asia & South America
India aims to have 7.5 million CNG vehicles by FY 2025, supported by an expansion from 1,081 to approximately 7,400 stations over the decade. China consumed 38.9 billion cubic meters of CNG-grade gas in 2023, under its natural-gas transition strategy, providing a scale for dispenser deployment. South America operates more than 5 million NGVs, with Bolivia nearing a 52% penetration rate. Petrobras is commissioning 1.2 million m³/d of biomethane supply, increasing the potential for lifting station throughput. Subsidized pump prices and mandatory low-emission fleet rules across Buenos Aires, Bogotá, and São Paulo further stimulate regional uptake.
IoT-enabled predictive maintenance
Advanced sensor suites and edge analytics reduce unplanned downtime by roughly 80% for gas-distribution equipment, according to peer-reviewed field studies. Low-power SCADA modules transmit pressure, temperature, and flow data over GSM or Wi-Fi, consuming under 4 W, enabling sub-$50 retrofit kits suitable for legacy dispensers. Dover Fueling Solutions embeds remote diagnostics in its newest hydrogen-ready models, enabling cloud-based firmware updates that reduce the need for on-site service visits. Higher uptime directly increases daily fuel volumes, which improves revenue yields and strengthens the investment case for smart dispensers within the CNG dispenser market.
Restraints Impact Analysis*
| Restraint | (~) % Impact on CAGR Forecast | Geographic Relevance | Impact Timeline |
|---|---|---|---|
| High up-front CAPEX for fast-fill stations | –1.4% | Emerging markets globally | Medium term (2-4 years) |
| EV-charging roll-out diverting budgets | –1.1% | North America & EU | Long term (≥ 4 years) |
| Gas-quality variability | –0.8% | Global | Short term (≤ 2 years) |
| Lack of heavy-duty connector standards >300 bar | –0.6% | Global | Medium term (2-4 years) |
| Source: Mordor Intelligence | |||
High up-front CAPEX for fast-fill stations
Turn-key installation for a four-lane fast-fill site can exceed USD 1.8 million, roughly double the outlay of a comparable diesel facility. Financing hurdles rise in rural corridors where throughput forecasts remain uncertain, leading to bank reluctance or higher interest rates. Smaller operators often pivot to time-fill or mobile trailers, postponing large-scale station construction. Although a 30% U.S. federal credit softens cash demands, many projects stall until anchor-tenant agreements guarantee baseline volume.
EV-charging roll-out diverting infrastructure budgets
Policy and investor sentiment lean toward electrification. Washington’s National Electric Vehicle Infrastructure program allocates USD 5 billion exclusively for chargers through 2028, dwarfing appropriations for gaseous fuels. California alone aims to target 1.01 million chargers by 2030, diverting public and private capital away from gas-based initiatives. Retailers balancing portfolio risk prioritize quick-service 350 kW chargers that meet Zero-Emission Vehicle mandates, tightening funding channels available to the CNG dispenser market.
*Our forecasts treat driver/restraint impacts as directional, not additive. The impact forecasts reflect baseline growth, mix effects, and variable interactions.
Segment Analysis
By Dispenser Configuration: multi-hose systems lift throughput
The single-hose format retained a 44.15% revenue share in 2025 due to its low entry cost, while multi-hose models are slated for a 12.7% CAGR as operators pursue faster queue turnover during peak hours. Dual-hose units serve midsize fleets that value redundancy without the footprint of four-lane skids. The Wayne Helix 6000 II features cloud telemetry, enabling remote flow validation and predictive part replacement, which reduces life-cycle costs. Shorter fill times translate into higher daily transactions per nozzle, improving return on investment and intensifying capital expenditure for advanced heads in the CNG dispenser market, particularly for configuration upgrades.
Across retrofit programs, station owners replace single hoses with two-hose swing arms that accommodate both 3,000 psig and 3,600 psig vehicles while retaining the original island. Adoption accelerates at metropolitan bus depots that must refuel up to 300 units nightly. Multi-hose up-ratings also dovetail with 15 psi inlet-pressure boosts stemming from grid-compression expansions, which allow tanks to reach nominal cut-out faster and cycle more customers during the same service window.

By Station Type: mobile units extend coverage
Fast-fill facilities captured 59.05% of the 2025 revenue pool, favored for public retail and large trucking corridors. Portable skids mounted on trailers are growing at the fastest rate, with a 13.3% CAGR, bridging service gaps in satellite towns and construction zones. Delhi and Mumbai host 1.5-ton mobile pods that refuel up to 150 cars per deployment, illustrating how flexible assets relieve congestion at fixed forecourts. Time-fill depots remain integral for private fleets with overnight dwell times, where capital-light compressors and cascade banks suffice.
California’s Kern County awards of USD 0.5 million enable rural school districts to lease portable dispensers for seasonal bus operations, sidestepping multi-million-dollar fixed builds. Event-based models in Europe dispatch trailer tanks to music festivals, demonstrating the service elasticity that underpins the growth of marquee players in this segment of the CNG dispenser market.
By End-User: industrial sites accelerate heavy-duty adoption
Public retail retained 49.05% of 2025 demand but faces a moderated 7.6% forward CAGR, whereas industrial and mining complexes lift orders at 12.4%. Cummins’ X15N debut in Class 8 tractors gives mines the torque to haul overburden while trimming NOx emissions by 90%, enabling sites to meet tougher Scope 1 targets. Transit authorities extend the life of existing bus fleets by adding particulate-trap upgrades and shifting to RNG contracts that pair with existing 250-bar plumbing.
Private depots add CNG to hedge against diesel price swings, especially for top-20 logistics players that refuel on-premise. BHP’s Australian iron-ore division pilots dual-fuel haul trucks, signalling cross-sector uptake. Together, these heavy-duty conversions reinforce a steady revenue backlog for dispenser makers and service contractors in the CNG dispenser market.
Geography Analysis
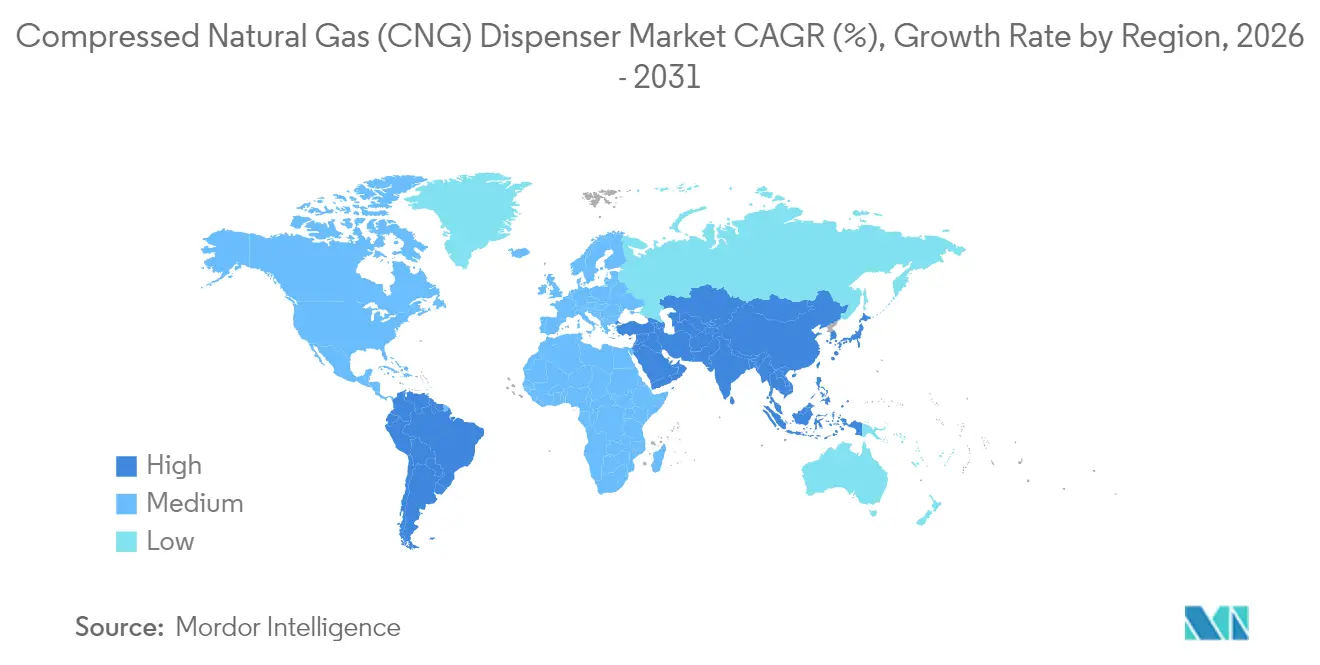
The Asia-Pacific region dominates the global landscape, accounting for a 47.95% revenue share in 2025 and is projected to grow at a 10.4% CAGR through 2031. India’s station count is on track to surpass 7,400 by FY 2025, anchoring regional infrastructure depth. China’s 38.9 billion m³ CNG consumption in 2023 underscores the massive scale, and municipal air-quality rules are pushing additional bus fleet conversions. Japan and South Korea contribute technology exports—valves, sensors, and payment terminals—creating a vertically integrated supply chain that favors local assembly of advanced dispensers.
North America leverages USD 2.5 billion in corridor funding plus USD 635 million in discretionary awards to extend coverage across 27 states. California’s 30% tax credit and 95.2 million clean-transport budget catalyze incremental forecourt builds. The region hosts about 156,000 NGVs—concentrated in trash collection, parcel delivery, and municipal fleets—providing predictable throughput for operators and a stable aftermarket for upgrade kits within the CNG dispenser market.
South America sustains over 5 million NGVs, spearheaded by Argentina’s aftermarket conversion market and Bolivia’s 52% penetration. Petrobras is installing 1.2 million m³/d biomethane capacity that will feed existing gas grids, ensuring a stable supply for dispensers. Policy-driven pump-price discounts and widening trucking bans on Euro III diesel engines are expected to bolster medium-term demand.
Europe lags in NGV volumes but sets the technical direction through hydrogen-ready forecourt standards. Germany’s 1,000th combined H₂/CNG sausage-type dispenser came online in 2025, marking the evolution of dual-fuel sites. The continent’s focus on renewable gas certificated via RED II drives meter upgrades and traceability modules, compelling service contracts that enrich the European slice of the CNG dispenser market.
Mordor Intelligence provides coverage of the compressed natural gas (cng) dispenser market across other key regional markets, including Middle East and Africa, each with their regulatory frameworks and demand patterns.
Regulatory Landscape
Regulation for CNG dispensing tightens safety, metrology, and hazardous-area equipment certification, driving harmonized technical baselines across regions. ISO 16923:2026, published January 2026, covers the design, construction, operation, maintenance, and inspection of CNG fueling stations and related safety control devices, and it is increasingly referenced in local approval processes.
Country regulators introduce inspection and measurement requirements that directly affect dispenser design, calibration, and service intervals. In the United States, CNG station and dispenser compliance aligns with NFPA 52 as adopted through state-level frameworks such as the Railroad Commission of Texas regulations for CNG/LNG. In Canada, Measurement Canada type-approval requirements under S-G-03 govern display, unit pricing, quantity indication, and interlocks for compliant dispensers. In India, the Petroleum and Explosives Safety Organisation (PESO) approval process for CNG dispensers requires third-party audit reports from recognized laboratories or IECEx/ATEX-notified bodies and aligns hazardous electrical apparatus checks with internationally recognized certification pathways. In Ontario, TSSA mandates CSA B108.1:23 for CNG refueling station installation and specifies periodic checks, including six-month verification of electronic temperature-compensating pressure-limiting devices, reinforcing recurring compliance-driven retrofit and maintenance demand.
Competitive Landscape
The market shows moderate consolidation as top players pursue portfolio diversification. Dover Corporation spent USD 1.3 billion across four acquisitions in 2024, folding cryogenic valves and control electronics into its fueling division. Gilbarco Veeder-Root secured USD 59 million in HPCL dispenser orders, reinforcing its 50-year presence in India. Chart Industries expanded its Nordic service coverage through the acquisition of CSC Cryogenic Service Center AB, which supports LNG truck stops and CNG maintenance.
Technology race points to IoT dashboards, remote firmware upgrades, and 700-bar compatibility. Dover’s dual-nozzle hydrogen/CNG unit ships with embedded LTE telemetry that pushes diagnostics to a cloud portal, cutting field service dispatches by 30%. Gilbarco pilots blockchain-based fuel provenance tags for RNG blends, responding to traceability demands under Europe’s RED II. Specialized firms producing trailer-mounted skids enter at a lower capital cost, contesting a niche that grows at a 13.8% CAGR yet remains thinly served by multinationals, revealing white-space in the CNG dispenser market.
Compressed Natural Gas (CNG) Dispenser Industry Leaders
-
Gilbarco Veeder Root
-
Tatsuno Europe AS
-
Scheidt & Bachmann Gmbh
-
Kraus Global
-
Bennett Pump Company
- *Disclaimer: Major Players sorted in no particular order

Market Opportunities and Future Outlook
Large, program-led station build-outs and corridor coverage initiatives are creating actionable whitespace for higher-throughput, connected dispensers at both public access sites and fleet depots. In the United States, infrastructure funding and operator expansions are translating into new fast-fill capacity, exemplified by Clean Energy Fuels opening six new fast-fill RNG stations in May 2026 to serve heavy-duty fleets on freight corridors. These additions raise the installed base that needs reliable dispensing hardware, remote diagnostics, and field-serviceable modularity, supporting opportunities for suppliers that can package dispensers with uptime monitoring and maintenance contracts.
Emerging-market gas mobility programs are also turning into concrete procurement pipelines where permitting simplification and new station targets pull through dispenser demand. Nigeria commissioned four CNG infrastructure projects in May 2026, including the Portland Gas Mother Station in Lagos (96,000 standard cubic metres/day capacity) and a high-capacity daughter booster station in Abuja developed by Rolling Energy Limited, signaling accelerated deployment needs around compression, metering, and dispensing equipment. In Indonesia, the July 2026 push to fast-track a central CNG compression station in Tanjung Enim, South Sumatra to reduce LPG imports highlights a parallel opportunity for mobile and satellite dispensing solutions where gas logistics and daughter-station rollouts are favored. In Europe, bio-CNG and public-access HGV refueling is adding new nodes, with ReFuels commencing construction (from 01 June 2026) of a public access station in Swindon, UK, sustaining demand for dispensers that meet evolving station safety and metrology expectations while supporting high-utilization fleet use cases.
Recent Industry Developments
- June 2026: ReFuels commenced construction of a public access CNG station in Swindon, UK, signaling accelerated deployment for high-utilization fleets and expanding the network of accessible dispensers.
- May 2026: Clean Energy Fuels opened six new fast-fill RNG stations along freight corridors, expanding the network and uptime for heavy-duty fleets and highlighting demand for robust dispenser and remote-monitoring solutions.
- May 2025: Trillium Energy Solutions acquired U.S. Energy's CNG network, expanding its footprint to 107 locations in North America, consolidating assets and strengthening maintenance across distributed assets.
Research Methodology Framework and Report Scope
Market Definition and Coverage
For this study, the market covers equipment used to dispense compressed natural gas into vehicles at fueling points, including the dispenser unit and typical configurations used at fast-fill, time-fill, and mobile setups.
Scope exclusions: Excludes upstream natural gas production, pipelines, compressors and storage vessels sold as standalone items, and non-CNG fuels (including LNG and hydrogen) unless they are part of a CNG dispenser sale.
Segmentation Overview
- By Dispenser Configuration
- Single-Hose
- Dual-Hose
- Multi-Hose
- By Station Type
- Fast-Fill
- Time-Fill
- Mobile/Portable
- By End-User
- Public Retail Stations
- Private Fleet Depots
- Transit and Bus Fleets
- Industrial and Mining Sites
- By Geography
- North America
- United States
- Canada
- Mexico
- Europe
- Germany
- United Kingdom
- France
- Italy
- NORDIC Countries
- Russia
- Rest of Europe
- Asia-Pacific
- China
- India
- Japan
- South Korea
- ASEAN Countries
- Rest of Asia-Pacific
- South America
- Brazil
- Argentina
- Rest of South America
- Middle East and Africa
- Saudi Arabia
- United Arab Emirates
- South Africa
- Egypt
- Rest of Middle East and Africa
- North America
Data Sources, Market Sizing, and Validation
Desk Research
Desk work was used to build the first fact base on where CNG stations exist, how they are growing, and what dispenser formats are being installed. Public sources such as the US Energy Information Administration, US EPA, International Energy Agency, and UNECE transport and emissions publications helped us understand fuel switching trends and vehicle growth patterns that shape dispenser demand.
We also reviewed information from national transport and energy ministries, customs and trade statistics for gas equipment categories, and association and station-network websites that publish station counts and rollout updates. Company annual reports, investor presentations, and reputable news were used to cross-check capacity expansions and product launches, supported by a paid subscription for company financials and another paid subscription for patent databases to validate technology directions. These sources are illustrative only, and many other public references were consulted to fill gaps, cross-check assumptions, and clarify details.
Primary Interviews and Surveys
Primary work focused on validating what gets purchased and installed at stations, and how pricing and replacement cycles move by region and use case. We spoke with stakeholders across dispenser manufacturing, station development and operation, and fleet owners, and the responses were balanced across APAC, EMEA, and the Americas to confirm regional station rollout plans and typical dispenser configurations.
Distribution of primary research fieldwork respondents
| Company type | Respondent position | Region |
|---|---|---|
| Top tier: 27% | CXOs: 12% | APAC: 39% |
| Mid tier: 53% | Functional/Unit leaders: 33% | EMEA: 35% |
| Smaller Players: 20% | Managers: 55% | Americas: 26% |
Market-Sizing & Forecasting
Sizing starts from a top-down build that reconstructs the addressable dispenser demand pool using CNG station counts, new station additions, and typical dispensers installed per site by station format (fast-fill, time-fill, and mobile). To keep the totals realistic, we then corroborate them with selective bottom-up approximations, such as sampled price bands by dispenser configuration (single-hose, dual-hose, and multi-hose) multiplied by implied shipment volumes and channel checks.
Key model inputs include active CNG refueling station growth by region, the split of public retail versus private fleet depots, average dispenser-per-station assumptions by format, observed replacement and upgrade cycles, and price progression by configuration and flow requirements. When some country-level data is thin, gaps are handled by using comparable markets with similar station density and vehicle mix, followed by a re-check with interview feedback before finalizing. Forecasts are built using scenario analysis that links station buildout pace and fleet conversion momentum to price and mix shifts, and then the final curve is sanity checked against the expected rollout rhythm shared by industry participants.
Data Validation & Update Cycle
Validation is done through a set of cross-checks that compare modeled revenue with independent signals like station additions, announced infrastructure budgets, and observed changes in dispenser mix by station type. If results look off for a country or a year, the drivers are reviewed, assumptions are tightened, and targeted re-contacts are triggered to confirm what changed (for example, delays in station commissioning or a swing toward dual-hose units).
Before sign-off, the model and narratives go through multiple analyst review steps so that input logic, unit math, and currency conversions are consistent across regions. Reports are refreshed annually, and interim updates are made when there are material shifts in policy, station rollout, or fuel economics. Right before delivery, we do a final pass to ensure the latest public updates and interview learnings are reflected.
Mordor Intelligence's Compressed Natural Gas Dispenser Market Size Compared With Other Published Estimates
It is normal to see different market values for CNG dispensers because publishers do not always size the same year, the same product scope, or the same installation base. Differences also come from how pricing is treated over time and how aggressively station additions are forecast in each region.
Some published figures appear to focus mainly on dispenser deployments tied to vehicle fueling stations, and they may apply broader equipment bundles or older pricing points. In Mordor Intelligence, the count is limited to CNG dispenser revenue by configuration and station type across the covered regions, and adjacent equipment like standalone compressors and storage is kept out, which changes the total even when the growth story looks similar.
Benchmark comparison
| Source | Market Size | Gaps in Research Methodology |
|---|---|---|
| Mordor Intelligence | USD 317.43 M (2026) | |
| Global Consultancy A | USD 145.38 M (2024) | Uses an earlier base year and a shorter forecast window, and the scope is described around deployment for vehicle refueling stations without clear treatment of configuration mix, replacement cycles, or how multi-hose pricing is carried forward. |
| Industry Publisher B | USD 294.41 M (2025) | Uses a different base year and segmentation emphasis (such as flow rate and ownership models), which can shift the average selling price and regional weighting if station-type splits and dispenser-per-station assumptions are not reconciled. |
Reading the table together, most of the spread is explained by year choice and what is bundled into the equipment scope, followed by how dispenser mix and price progression are handled. By keeping the assumptions tied to station rollouts, configuration splits, and practical replacement behavior, our estimate stays repeatable and easier to reconcile against real installation activity.
Key Questions Answered in the Report
How large is the CNG dispenser market in 2026?
The CNG dispenser market size reached USD 317.43 million in 2026 and is set for robust expansion toward USD 492.61 million by 2031.
What is the expected growth rate through 2031?
Global revenue is projected to rise at a 9.18% CAGR, supported by policy incentives and fleet conversions.
Which region currently leads demand?
Asia-Pacific holds 47.95% of 2025 revenue thanks to large NGV fleets in India and China.
Which segment grows fastest by station type?
Mobile and portable dispensers are forecast to post a 13.3% CAGR as operators target underserved areas.
What technology trend gains the most traction?
Hydrogen-ready modular dispensers equipped with IoT diagnostics are becoming mainstream as forecourts prepare for multi-energy offerings.
Who are the key industry players?
Dover Corporation, Gilbarco Veeder-Root, Chart Industries, OPW, and Hexagon Agility form the core group with expanding global footprints.