
Compounding Pharmacy Market Size and Share
Market Overview
| Study Period | 2020 - 2031 |
|---|---|
| Market Size (2026) | USD 16.78 Billion |
| Market Size (2031) | USD 22.08 Billion |
| Growth Rate (2026 - 2031) | 5.68 % |
| Fastest Growing Market | Asia-Pacific |
| Largest Market | North America |
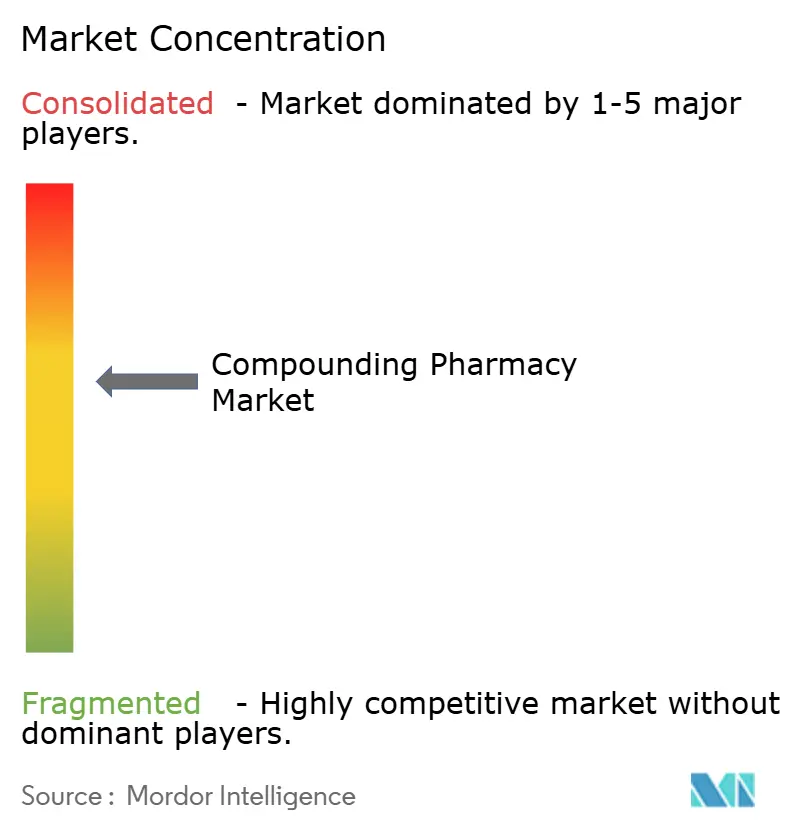
| Market Concentration | Medium |
Major Players *Disclaimer: Major Players sorted in no particular order Image © Mordor Intelligence. Reuse requires attribution under CC BY 4.0. | |
Compounding Pharmacy Market Analysis by Mordor Intelligence
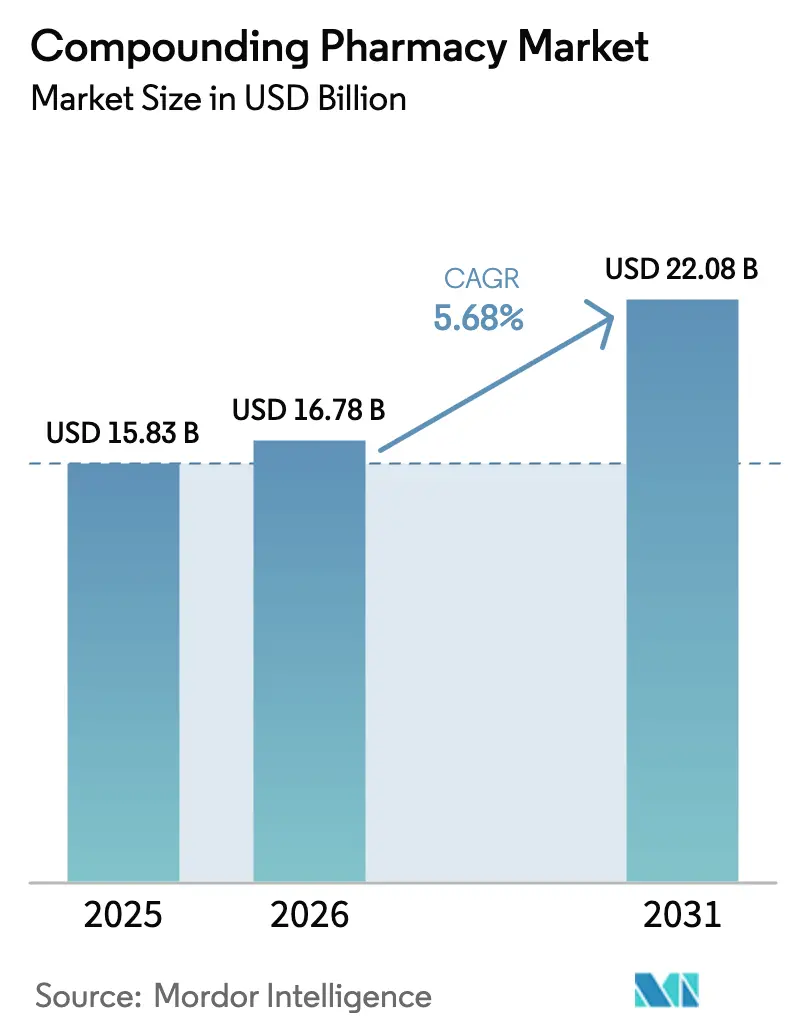
The Compounding Pharmacy Market size is expected to grow from USD 15.83 billion in 2025 to USD 16.78 billion in 2026 and is forecast to reach USD 22.08 billion by 2031 at 5.68% CAGR over 2026-2031.
Persistent drug shortages, wider acceptance of personalized medicine, and regulatory support for outsourcing have elevated compounded preparations from fringe solutions to essential components of hospital formularies. Health systems now formalize long-term supply contracts with 503B facilities to mitigate supply chain shocks, while capital-rich manufacturers view compounding as a strategic insurance against production lapses. Demand is strongest for sterile admixtures, bioidentical hormone therapy, and pediatric‐friendly formats that commercial producers overlook. The adult chronic-disease base remains dominant; yet, rapid growth in pediatric and veterinary markets underscores how customization imperatives broaden the addressable population for the compounding pharmacy market. Competition is intensifying as extensive outsourcing facilities consolidate capacity and integrate robotic technologies that cut contamination risk by more than 95%.
Key Report Takeaways
- By route of administration, oral formulations led with 38.81% revenue share in 2025; parenteral preparations are forecast to expand at a 7.38% CAGR through 2031.
- By therapeutic area, pain management accounted for 31.23% of the compounding pharmacy market share in 2025, while hormone replacement therapy is projected to grow at the fastest rate, with a 7.86% CAGR, from 2026 to 2031.
- By sterility, sterile products accounted for 57.98% of the compounding pharmacy market size in 2025; non-sterile formulations are set to grow at a 6.45% CAGR through 2031.
- By age group, adults dominated with a 48.26% share in 2025; pediatric preparations are expected to advance at a 7.66% CAGR to 2031.
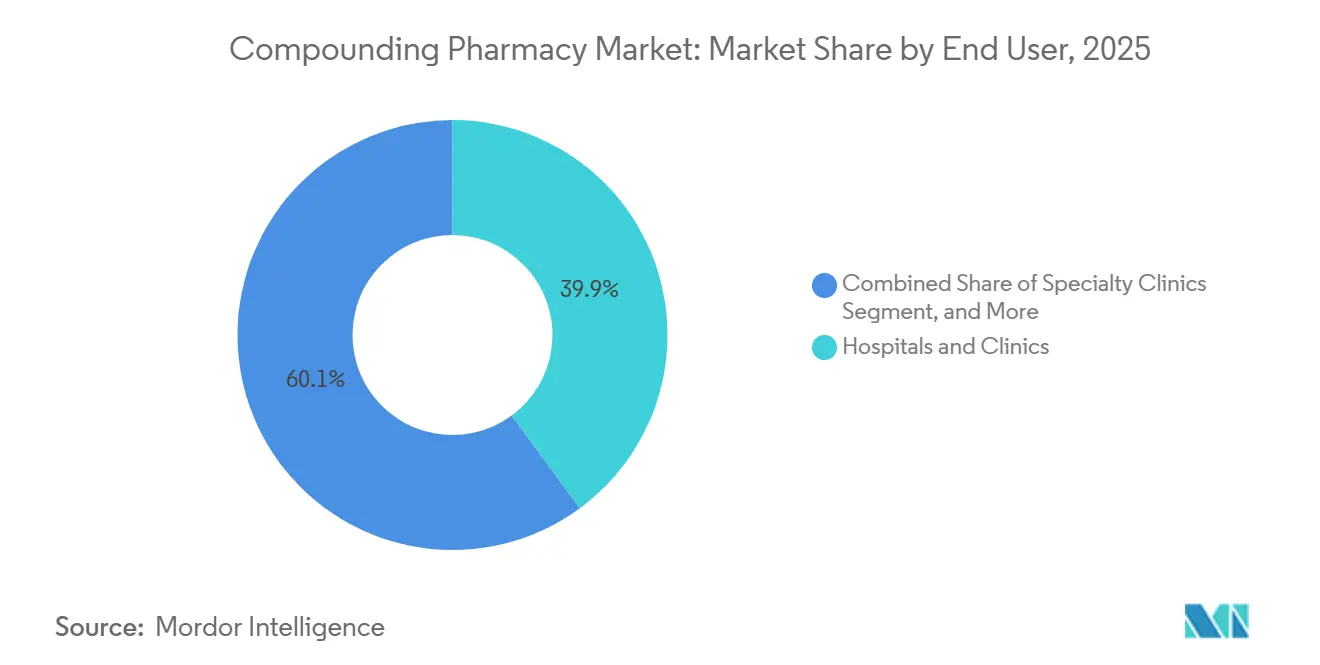
- By end user, hospitals and clinics captured a 39.94% share in 2025, whereas specialty clinics are registering the strongest 8.42% CAGR through 2031.
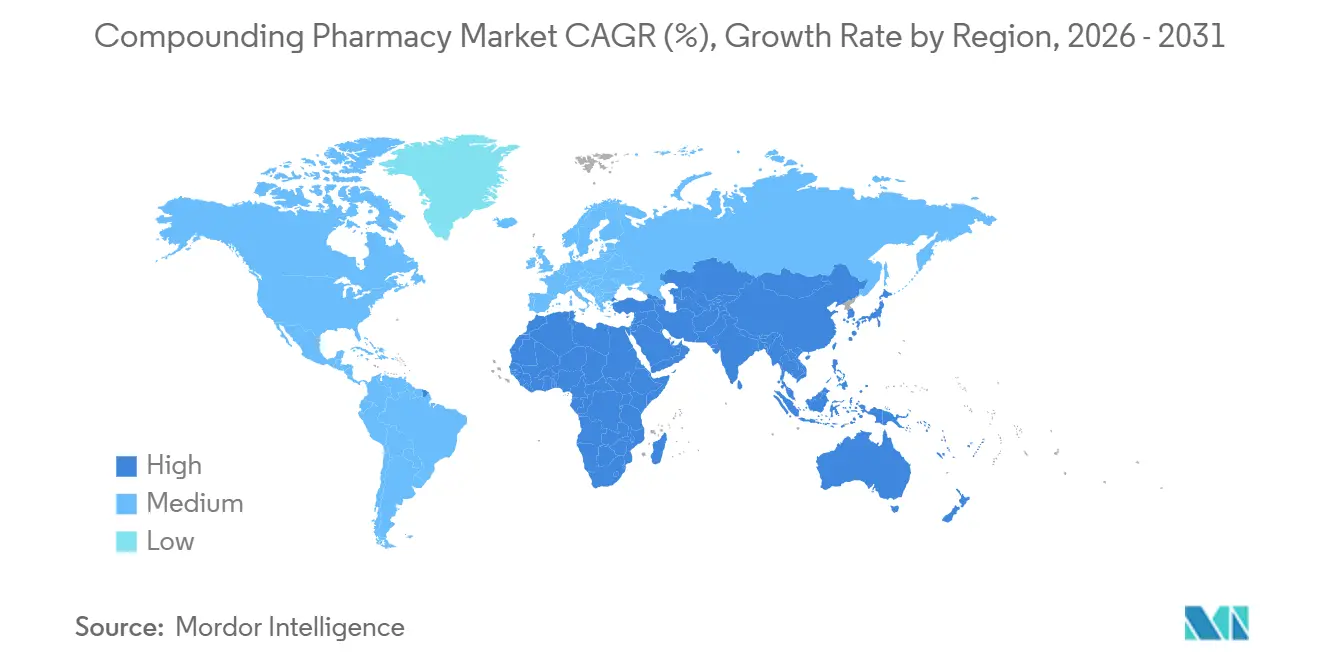
- By geography, North America dominated the compounding pharmacy market with a 37.44% share in 2025; the Asia-Pacific region recorded the fastest growth at a 9.26% CAGR from 2026 to 2031.
Note: Market size and forecast figures in this report are generated using Mordor Intelligence’s proprietary estimation framework, updated with the latest available data and insights as of January 2026.
Market Trends and Insights
Drivers Impact Analysis of Compounding Pharmacy Market*
| Driver | (~) % Impact on CAGR Forecast | Geographic Relevance | Impact Timeline |
|---|---|---|---|
| Rising drug-shortage frequency | +1.0% | United States, Canada, Western Europe | Medium term (2-4 years) |
| Growing demand for personalized doses | +1.2% | North America, Europe, urban Asia-Pacific | Long term (≥4 years) |
| Expansion of 503B outsourcing facilities | +1.1% | North America, Australia, Japan | Medium term (2-4 years) |
| Uptake of sterile automated compounding technologies | +0.7% | North America, Western Europe, China, India | Medium term (2-4 years) |
| Consumer-led bioidentical hormone therapy boom | +0.8% | North America, UK, Germany, Australia | Short term (≤2 years) |
| Large-scale compounding of GLP-1 agonists | +0.6% | United States, Canada, select EU | Short term (≤2 years) |
| Source: Mordor Intelligence | |||
Rising Drug-Shortage Frequency
The FDA reported 113 active shortages in 2024, with 15 new listings despite 283 averts, underscoring the structural fragility of the supply chain.[1] Hospitals responded by pre-stocking compounded substitutes for oncology analgesics, anesthetics, and parenteral nutrition, transforming 503B partners into critical infrastructure. Longer shortage durations often stretching 18–24 months have spurred multi-hundred-million-dollar investments by manufacturers that now seek end-to-end control of both commercial and compounded output. These dynamics anchor a positive feedback loop for the compounding pharmacy market, where rising baseline demand sustains factory-scale sterile capacity and continuous quality upgrades.
Large-Scale Compounding of GLP-1 Agonists Amid Obesity-Drug Gaps
When commercial supplies of semaglutide and tirzepatide tightened in 2024, compounders filled the vacuum under drug-shortage exemptions, scaling robotic filling lines that later repurposed to other injectables once enforcement resumed. Although revenue from GLP-1 copies is receding, the episode validated the sector’s agility, prompting payers and integrated delivery networks to view compounders as rapid-response buffers for future blockbuster gaps. The equipment and quality-system upgrades implemented during the GLP-1 surge now enhance throughput for oncology biologics and critical-care infusions, reinforcing long-term growth prospects for the compounding pharmacy market.
Growing Demand for Personalized Doses & Dosage Forms
Children with epilepsy, seniors with dysphagia, and pets needing palatable drugs all benefit from dosage forms that commercial lines ignore. The American Society for Parenteral and Enteral Nutrition notes that home TPN costs can reach USD 200 per day, magnifying the clinical and economic value of precise, individualized admixtures.[2] Pediatric demand alone is rising at a 7.66% CAGR as caregivers seek allergen-free, dye-free suspensions that improve adherence. Veterinary prescriptions are also increasing, as FDA Guidance #256 limits office stock, redirecting veterinarians to patient-specific scripts. This long-tail spectrum of low-volume, high-margin needs secures a durable niche for the compounding pharmacy market.
Expansion of 503B Outsourcing Facilities for Hospital Supply
Fagron’s EUR 70 million investment in Wichita and Nephron’s USD 350 million build-out in South Carolina exemplify the shift from regional to national sterile compounding footprints. Because 503B sites may batch without individual prescriptions, hospitals treat them like conventional drug manufacturing facilities, thereby reducing in-house liability while meeting USP 797 mandates. Consolidation follows naturally, as larger operators spread compliance costs across a higher volume of output. For the compounding pharmacy market, this fuels scale efficiencies, accelerates technology adoption, and increases purchaser confidence.
Restraints Impact Analysis of Compounding Pharmacy Market*
| Restraint | (~) % Impact on CAGR Forecast | Geographic Relevance | Impact Timeline |
|---|---|---|---|
| Escalating FDA & USP compliance costs | −0.8% | United States, Canada, EU | Medium term (2-4 years) |
| PBM steering limiting independent pharmacy access | −0.5% | United States | Short term (≤2 years) |
| API supply bottlenecks for specialty actives | −0.4% | Global | Medium term (2-4 years) |
| Rising insurer refusal to reimburse compounded scripts | −0.6% | United States, UK, Germany | Short term (≤2 years) |
| Source: Mordor Intelligence | |||
Escalating FDA & USP Compliance Costs
Revised USP 797 and 800 rules, effective 2024, forced upgrades to ISO-classified cleanrooms, environmental monitoring, and staff training, raising capital thresholds well beyond the reach of many independents. Fresenius Kabi invested USD 90 million in Wilson, North Carolina, and B. Braun allotted USD 70 million to its Pennsylvania plant to stay compliant. Heightened FDA inspection cadence, quarterly for 503B sites, adds further operating expense. While patient safety improves, a shrinking number of suppliers risks deepening shortages and dampening growth momentum for the compounding pharmacy market.
Rising Insurer Refusal to Reimburse Compounded Prescriptions
Pharmacy benefit managers such as Express Scripts and OptumRx apply stricter prior authorization, citing limited clinical data for compounded alternatives. The American College of Obstetricians and Gynecologists has questioned the consistency of compounded bioidentical hormone dosing, reinforcing payer skepticism.[3] Patients must shoulder out-of-pocket costs, skewing demand toward wealthier demographics. Retail-focused 503A pharmacies feel the squeeze most acutely, tempering what would otherwise be a robust expansion of the compounding pharmacy market.
*Our forecasts treat driver/restraint impacts as directional, not additive. The impact forecasts reflect baseline growth, mix effects, and variable interactions.
Compounding Pharmacy Market Segment Analysis
By Route of Administration:
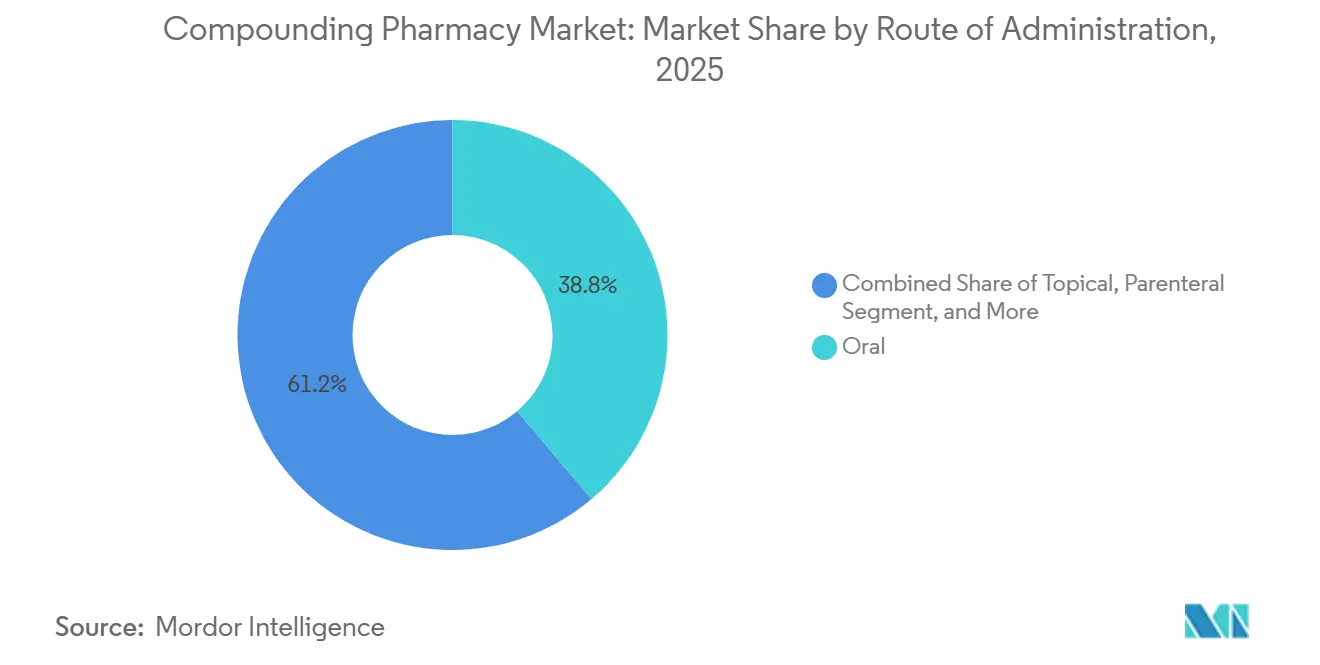
Parenteral Growth Outpaces Oral DominanceThe oral formulation segment accounted for 38.81% of the compounding pharmacy market size in 2025, reflecting its primacy in inpatient oncology, ICU, and surgical support. Hospital outsourcing to 503B partners, coupled with the widespread adoption of automated compounding devices, drives a 7.38% forecast CAGR for parenteral preparations. Oral formats retain leadership in chronic outpatient therapy but face slower 4% growth trajectories as commercial producers broaden their dose-strength lines. Demand for nasal sprays and sublingual troches is increasing in applications related to allergies and hormonal disorders. Yet, parenteral gains illustrate how sterility and precision tilt revenue toward high-complexity service providers within the compounding pharmacy market.
The American Society for Parenteral and Enteral Nutrition attributes lower sepsis rates to the use of closed-system parenteral nutrition, reinforcing the clinical preference for outsourced admixtures. Pediatric hospitals use flavored oral suspensions to enhance adherence, while veterinary prescribers choose transdermal gels to improve feline compliance. Nonetheless, capital-intensive parenteral workflows concentrate volume among fewer players, raising barriers for new entrants and cementing the segment’s influence over overall compounding pharmacy market share.

By Therapeutic Area:
Hormone Therapy Accelerates After Regulatory ShiftPain management generated 31.23% of 2025 revenue, banking on compounded topical analgesics that blend NSAIDs with anesthetics for opioid-averse patients. However, hormone replacement therapy is poised to deliver the fastest 7.86% CAGR, buoyed by the FDA’s label revision that removed boxed warnings and normalized customized estrogen-progesterone regimens. Canadian data cite 92 recorded hormone shortages since 2017, underscoring a chronic supply imbalance that funnels patients to compounders.
Dermatology follows close behind, driven by compounding’s ability to formulate patient-specific corticosteroid strengths and hydroquinone combinations. Oncology admixtures represent a lower-volume but higher-margin niche abetted by robotic aseptic lines. Pediatric and veterinary care is tailored via weight-based dosing and flavor customization, while nutritional supplements for metabolic disorders carve out a small but defensible niche within the compounding pharmacy industry.
By Sterility:
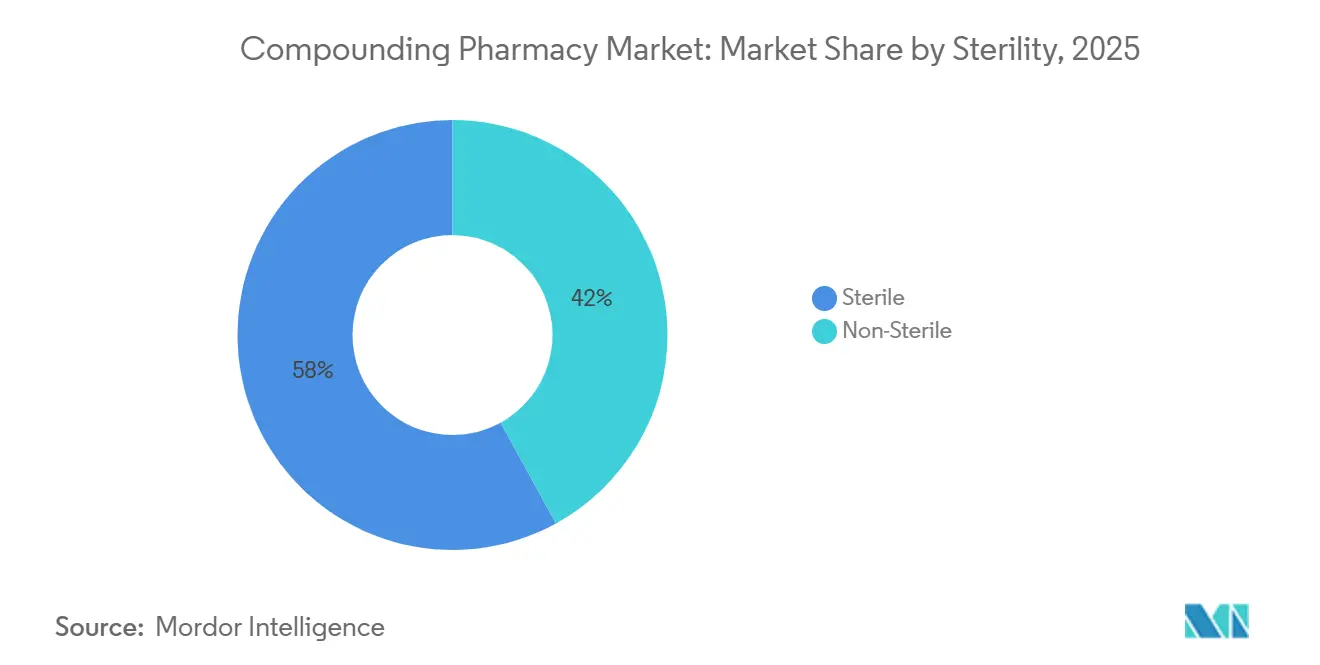
Non-Sterile Uptick Parallels Topical and Veterinary DemandSterile products dominated with 57.98% of 2025 revenue, yet non-sterile lines are slated for a 6.45% CAGR through 2031 as dermal and veterinary scripts proliferate. Hazardous non-sterile items, such as hormone creams governed by USP 800, require exhaust hoods and PPE but fall short of cleanroom investments, making them an appealing option for community pharmacies. Lower regulatory barriers, quicker turnaround, and insurer leniency on topical coverage elevate the growth curve of non-sterile products, steering segment opportunities toward smaller operators still active in the compounding pharmacy market.
Health systems are increasingly outsourcing high-risk, sterile production to 503B sites to avoid infrastructure expenditures, while retaining low-risk sterile and non-sterile preparations in-house. This split assignment reallocates revenue and underpins stable demand for both sterile experts and nimble local pharmacies. Regulatory harmonization in Europe, as outlined in EMA Annex 1, aligns with U.S. sterility standards, directing capital toward larger facilities that can amortize compliance costs.
By Age Group:
Pediatric Customization Spurs Outsized GrowthAdults still command 48.26% of 2025 value, spanning chronic pain, HRT, and oncology maintenance. Pediatric prescriptions, although smaller in absolute dollars, expand at a robust 7.66% CAGR as parents seek dye-free, allergen-free options and precise dosing increments that are not achievable with mass-manufactured drugs. Many insurers authorize compounded pediatric formulations when commercial equivalents lack approved weight-based strengths, easing reimbursement barriers.
Specialty compounders compile stability data libraries for pediatric suspensions, positioning themselves as indispensable partners to children’s hospitals. Geriatric scripts, hampered by stricter PBM oversight, grow more modestly but still benefit from liquid re-formulations aiding dysphagia management. These demographic contrasts diversify revenue streams and buffer the compounding pharmacy market against payer or regulatory shocks targeting any single patient group.
By End User:
Specialty Clinics Gain the Fast LaneHospitals and integrated delivery networks represented 39.94% of the 2025 demand; however, perpetual USP audits and staffing constraints are expected to encourage further outsourcing. Specialty clinics, dermatology, endocrinology, and veterinary, post the highest 8.42% CAGR by leveraging customized products as patient-retention tools. Dermatologists compound hydroquinone-tretinoin blends tailored to individual Fitzpatrick scores, while hormone clinics deliver titratable troches following laboratory monitoring.
Veterinary practices utilize flavored liquids and transdermal gels to address dosing challenges in cats and dogs, thereby gaining client loyalty despite higher per-dose costs. Retail community pharmacies confront PBM steering toward branded generics, motivating some to pivot into wellness and nutraceutical compounding. The widening specialty-care footprint ultimately widens the transaction base for the compounding pharmacy market.
Geography Analysis
North America Compounding Pharmacy Market
North America maintained 37.44% of 2025 revenue, fortified by the United States’ extensive 503B network, Canada’s hormone shortages, and Mexico’s maturing API hubs. Baxter’s acquisition of PharMEDium, Fagron’s investment in Wichita, and Nephron’s 1 billion-unit South Carolina megasite exemplify the capital consolidation redefining regional competitive dynamics. Canada’s shortage database logged two-digit annual deficits in hormone products, prolonging reliance on compounders for menopausal care. Mexico’s lower-cost API exports support North American finished-dose plants, though U.S. import scrutiny keeps value capture stateside.
APAC Compounding Pharmacy Market
Asia-Pacific presents the fastest 9.26% CAGR, propelled by China’s regulatory modernization, India’s API dominance, and Japan’s super-aged demographics craving dose customization. Australia’s private insurers fund compounded bioidentical hormones under strict quality frameworks, while China’s National Medical Products Administration tightens GMP parity, raising entry barriers yet boosting trust in domestic compounders. India’s export restrictions on certain oncology agents temporarily squeeze global supply, revealing interdependence between regional API flows and worldwide compounding capacity.
EMEA and South America Compounding Pharmacy Market
Europe’s mosaic of country-specific rules complicates scaling but rewards knowledgeable incumbents. Germany’s historic Apotheke culture supports independent compounding, whereas the UK’s National Health Service bundles demand through centralized tenders. EMA’s Annex 1 revision elevates sterility protocols, nudging smaller hospital units toward outsourcing. The Middle East and Africa remain exploratory but attractive as Gulf Cooperation Council states embed pharmaceutical self-sufficiency goals in national plans. South American growth is steady, led by Brazil’s chronic-disease burden and Argentina’s favorable currency dynamics, although reimbursement inconsistencies still cap uptake compared to the compounding pharmacy market leaders.
Regulatory Landscape
In the United States, compounding operates under a split federal and state model anchored in Sections 503A and 503B of the FD&C Act. 503A pharmacies are overseen by state boards of pharmacy while 503B outsourcing facilities register with the FDA and are held to CGMP expectations. The enforcement bar has tightened as drug-shortage conditions normalize, with the FDA clarifying in April 2026 that enforcement discretion tied to certain compounded drugs transitions as national supply stabilizes, reinforcing the statutory restrictions around compounding copies of commercially available drugs.
Value Chain Analysis
The value chain begins with sourcing active pharmaceutical ingredients and excipients with verified Certificates of Analysis and supplier qualification, followed by formulation, testing, and release within 503A pharmacies for patient-specific prescriptions and within 503B outsourcing facilities for batch-produced sterile and non-sterile preparations for health systems. In the United States, scale in the regulated outsourcing tier is a key structural feature, with 89 FDA-registered 503B outsourcing facilities reported as of March 31, 2025, supporting hospital purchasing models that resemble finished-dose procurement rather than retail dispensing.
Competitive Landscape
The compounding pharmacy market balances moderate fragmentation and accelerating consolidation. Top outsourcing facilities leverage scale to amortize nine-figure compliance investments and deploy robotics that exceed 95% contamination reduction benchmarks. Baxter’s purchase of PharMEDium grants vertically integrated control from bulk sterile bags to patient-ready syringes, allowing bundling alongside IV solutions. Fagron pursues a dual-sourcing model, combining API supply with finished formats, and has strengthened its U.S. presence by acquiring QuVa Pharma for an undisclosed sum.
Fresenius Kabi and B. Braun extend longstanding IV portfolios into 503B territories, leveraging distribution assets to secure long-term hospital contracts. Nephron’s state-of-the-art complex in South Carolina epitomizes automated sterility at an industrial scale, targeting 1 billion units annually, thereby positioning the firm as a volume outlier capable of sprint production when shortages strike. Digital health entrants pair telemedicine diagnostics with centralized compounding, shortening prescription-to-door timelines to under 48 hours in select pilots.
White-space prospects arise in pediatric, dermatology, and veterinary care, where customization depth discourages commoditization. Yet reimbursement friction pressures retail-centric 503A pharmacies, inciting niche diversification into wellness creams and supplement blends. Over the medium term, scale-driven 503B leaders and data-rich specialty compounds are likely to expand their share, leaving midsize independents as the most vulnerable cohort as the compounding pharmacy market progresses toward more concentrated oligopoly structures.
Compounding Pharmacy Industry Leaders
-
Wedgewood Pharmacy
-
Fagron NV
-
B. Braun SE
-
Baxter International Inc.
-
Fresenius Kabi AG
- *Disclaimer: Major Players sorted in no particular order
Compounding Pharmacy Market Companies Covered in this Report
- Avella Specialty Pharmacy
- B. Braun
- Baxter
- CAPS (Central Admixture)
- Dougherty’s Pharmacy
- Empower Pharmacy
- Fagron
- Fresenius
- Leiters Health
- Nephron Pharmaceuticals
- Olympia Pharmacy
- Pencol Compounding
- PharMEDium Services
- QuVa Pharma
- Rx3 Compounding
- SCA Pharma
- Triangle Compounding
- US Compounding Inc.
- Vertisis Custom Pharmacy
- Wedgewood Pharmacy
Market Opportunities and Future Outlook
Operational and geographic expansion by compounding providers highlights near-term whitespace in compliant capacity and distribution reach, particularly for multi-state service models tied to personalized dosing and specialty fulfillment. In April 2026, ProRx Pharma announced a major footprint expansion (from about 3,400 to 17,000 square feet) and broader delivery coverage into Oklahoma and Virginia, while Eden Pharmacy announced a facility expansion in Albuquerque to double its space to 7,000 square feet, underscoring active investment in throughput and service coverage for compounded medications. Regulatory normalization around shortage-driven compounding is shifting opportunity toward portfolios that can be supported under durable compliance, documentation, and quality systems. The FDA's April 2026 clarification on GLP-1-related compounding enforcement discretion, alongside ongoing FDA processes for evaluating substances for the 503A Bulks List (including a scheduled July 2026 Pharmacy Compounding Advisory Committee meeting), pushes providers to build flexible product strategies and rapid portfolio reconfiguration capabilities. Technology enablement also opens measurable opportunity: adoption of automated workflows, electronic audit trails, and environmental monitoring aligned with USP 795, 797, and 800 supports institutional contracting needs for sterile preparations and creates differentiation for specialty segments such as pediatric-friendly formats, hazardous non-sterile hormone preparations, and veterinary formulations where customization depth remains a competitive moat.
Recent Industry Developments in Compounding Pharmacy Market
- July 2026: B. Braun obtained FDA approval for a generic sugammadex injection and will commercialize it in the United States. This expands hospital supply options and strengthens its injectables portfolio, signaling active diversification into anesthesia ready-to-use products.
- June 2025: Wedgewood Pharmacy announced the availability of a compounded GS-441524 formula for feline infectious peritonitis (FIP) treatment. The addition expands the veterinary portfolio and reinforces demand pull from specialty veterinary prescribing for patient-specific compounded therapies.
- September 2024: Wedgewood Pharmacy launched compounded molnupiravir for the treatment of feline infectious peritonitis (FIP). The launch broadened compounded antiviral options in veterinary care and highlighted how compounders address niche dosing and formulation needs not covered by mass-manufactured products.
Compounding Pharmacy Market Report Scope and Research Methodology
Market Definition and Coverage
This market covers the value of compounded medicines prepared by licensed compounding pharmacies and outsourcing facilities for patient-specific needs or batch supply, across dosage forms and therapy areas, and sold through legal dispensing and distribution channels.
Scope exclusions: We exclude simple drug reconstitution, standard repackaging activities, veterinary-only feed additives, and in-hospital admixture work done fully within hospital nursing operations.
Segments Covered in This Report
- By Route of Administration
- Oral
- Capsules
- Tablets
- Granules / Powder
- Syrups & Suspensions
- Topical
- Creams & Ointments
- Gels
- Lotions
- Pastes
- Parenteral
- Small-Volume Parenteral
- Large-Volume Parenteral
- Prefilled Syringes
- Ophthalmic Injectables
- Nasal
- Sprays
- Drops
- Other Route of Administration
- Oral
- By Therapeutic Area
- Pain Management
- Hormone Replacement Therapy (HRT)
- Dermal Disorders / Dermatology
- Nutritional Supplements
- Oncology / Specialty Drugs
- Pediatrics
- Veterinary
- Others
- By Sterility
- Sterile
- High-Risk Sterile
- Medium-Risk Sterile
- Low-Risk Sterile
- Non-Sterile
- Hazardous Non-Sterile
- Non-Hazardous Non-Sterile
- Sterile
- By Age Group
- Adult
- Geriatric
- Pediatric
- By End User
- Hospitals & Clinics
- Specialty Clinics
- Retail / Community Dispensing
- Other End Users
- By Geography
- North America
- United States
- Canada
- Mexico
- Europe
- Germany
- United Kingdom
- France
- Italy
- Spain
- Rest of Europe
- Asia-Pacific
- China
- Japan
- India
- Australia
- South Korea
- Rest of Asia-Pacific
- Middle East & Africa
- GCC
- South Africa
- Rest of Middle East & Africa
- South America
- Brazil
- Argentina
- Rest of South America
- North America
Data Sources, Market Sizing, and Validation
Desk Research
We start by mapping the regulatory and operating boundary for compounding and then collect measurable demand and supply signals that can be tracked over time. Common public inputs include FDA communications, including inspection and enforcement actions, and CDC health statistics for chronic conditions that drive customized dosing. Where relevant, we also review CMS utilization and reimbursement references.
We review sources such as the U.S. Pharmacopeia (USP) standards for compounding, national customs and trade statistics for select active ingredients and excipients, and peer-reviewed publications on sterile compounding safety and usage patterns.
Alongside these, we use company annual reports, investor decks, and reputable press to understand service mix, capacity expansion, and distribution footprints. Where coverage gaps exist for private operators, paid database subscriptions are used selectively for company financials and intelligence, news and financials, patent databases, and an import-export shipment-level database to cross-check ingredient flow trends. These desk sources are not exhaustive, and we also consult additional public and paid references for data collection, validation, and clarification.
Primary Interviews and Surveys
Primary work is used to pressure-test the desk model with inputs from outsourcing facilities, community and hospital compounding practitioners, distributors, and adjacent clinical stakeholders. We focus discussions on current utilization by dosage form, sterile versus non-sterile mix, capacity constraints, pricing behavior, and how compliance requirements are affecting operating costs. For pricing, we probe how ASP movement differs by formulation complexity. Since this is a global market, respondents are covered across major regions so final sizing assumptions reflect real-world practice differences rather than relying only on published U.S. signals.
Distribution of primary research fieldwork respondents
| Company type | Respondent position | Region |
|---|---|---|
| Top tier: 28% | CXOs: 12% | APAC: 46% |
| Mid tier: 52% | Functional/Unit leaders: 28% | EMEA: 35% |
| Smaller Players: 20% | Managers: 60% | Americas: 19% |
Market-Sizing & Forecasting
The sizing starts with a top-down build where patient demand pools and therapy-driven utilization are reconstructed into compounded prescription and preparation volumes, which are then translated into value using typical ASP bands by dosage form and sterility level. To keep the totals realistic, we corroborate them with selective bottom-up checks, such as sampled provider throughput, outsourcing capacity utilization discussions, and channel checks on mix shifts in high-volume formulations.
Key model inputs include the share of prescriptions requiring customized strengths or dosage forms, sterile compounding demand tied to injectables and ophthalmics, the outsourcing facility share in hospital supply, the average selling price spread between sterile and non-sterile preparations, and compliance-driven cost pass-through trends. Where bottom-up visibility is uneven, especially across smaller operators, we apply conservative coverage factors based on licensing footprints and reported capacity signals, and then adjust only after primary feedback supports the direction.
For forecasting, scenario analysis is used so changes in enforcement intensity, hospital sourcing preferences, and sterile capacity additions can be reflected without assuming a single straight-line growth path. Assumptions for price progression and mix are reviewed with practitioners and distributors, and then applied consistently across regions before the final global roll-up is produced.
Data Validation & Update Cycle
Outputs are checked against independent signals such as reported outsourcing activity, regulatory action trends, and demand markers tied to chronic disease burden and therapy usage. If large variances appear by region or dosage form, the assumptions are re-opened, and respondents are re-contacted to confirm whether the shift is real or a modeling artifact.
Before sign-off, the file is reviewed in multiple steps so math integrity, scope alignment, and year-to-year consistency are verified. The report is refreshed annually, and interim updates are made when material events occur, after which a final pre-delivery pass is done so clients receive an up-to-date view.
Mordor Intelligence's Compounding Pharmacy Market Size Compared Against Other Published Estimates
Published market values for compounding pharmacy can look far apart because authors treat the scope and pricing timeline differently, and then those choices get amplified when forecasts are extended for many years. Currency timing, the year used for ASP normalization, and whether sterile and non-sterile price spreads are modeled separately are also common reasons for mismatch.
In this study, the refresh cadence matters because enforcement actions, outsourcing capacity additions, and hospital sourcing shifts can change mix quickly, and those shifts feed directly into the ASP-by-formulation logic and year-average currency conversions used to keep like-for-like comparisons clean, a practical step applied by Mordor Intelligence.
Benchmark comparison
| Source | Market Size | Gaps in Research Methodology |
|---|---|---|
| Mordor Intelligence | USD 16.78 B (2026) | |
| Trade Journal A | USD 13.00 B (2023) | Uses an earlier base year and a single blended ASP, which can understate sterile-heavy demand and misses later mix changes tied to outsourcing adoption. |
| Industry Association B | USD 17.70 B (2030) | Back-solves from a long-range forecast and applies a broad pharmacy services lens, which can pull in adjacent dispensing activities and smooth short-term regulatory effects. |
Across the table, the largest spread comes from when prices and currency are anchored, and from how quickly formulation mix is allowed to change year to year. By keeping the scope tight to compounding activity and by validating mix and pricing assumptions with working practitioners, the estimate stays traceable to clear demand drivers and repeatable checks.
Key Questions Answered in the Report
How large is the compounding pharmacy market in 2026?
The compounding pharmacy market size stood at USD 16.78 billion in 2026 and is projected to reach USD 22.08 billion by 2031.
Which segment is growing fastest through 2031?
Hormone replacement therapy leads with a 7.86% CAGR, driven by the FDA’s 2025 boxed-warning removal.
Why are 503B outsourcing facilities important?
They batch-produce sterile drugs without individual scripts, enabling hospitals to stock ready-to-use injectables while meeting stringent USP <797> standards.
What is driving pediatric demand for compounded medicines?
Guardians seek dye-free, allergen-free, weight-based formulations that commercial manufacturers do not offer, pushing pediatric prescriptions at a 7.66% CAGR.
Which region is expected to record the highest CAGR to 2031?
Asia-Pacific is forecast to grow at 9.26% CAGR, propelled by regulatory modernization and expanding chronic-disease treatment needs.