
Composable Infrastructure Market Size and Share
Market Overview
| Study Period | 2020 - 2031 |
|---|---|
| Market Size (2026) | USD 9.89 Billion |
| Market Size (2031) | USD 21.87 Billion |
| Growth Rate (2026 - 2031) | 17.21% CAGR |
| Fastest Growing Market | Asia Pacific |
| Largest Market | North America |
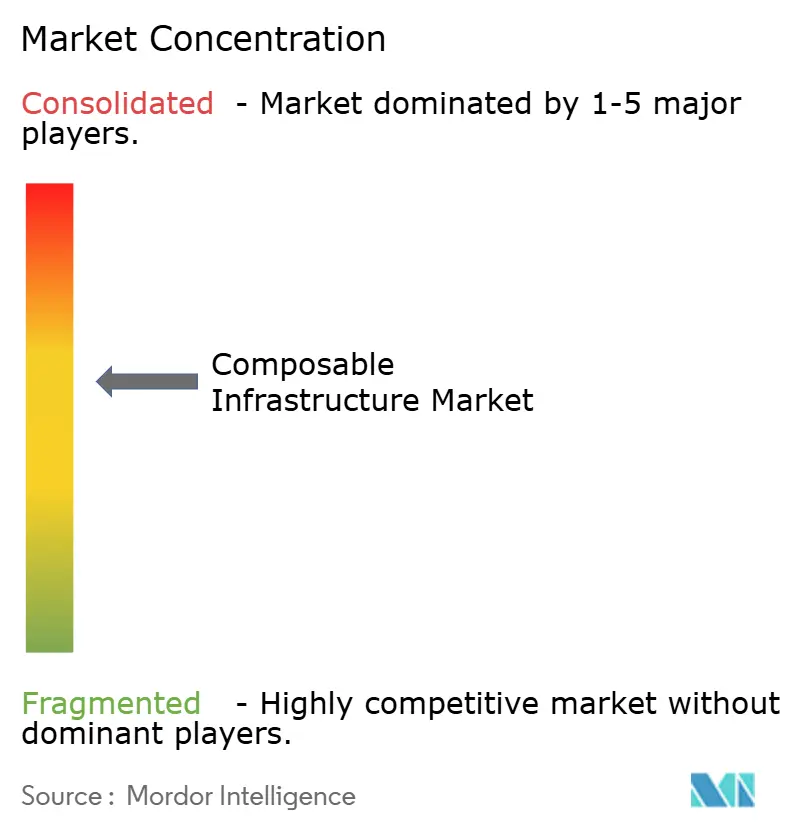
| Market Concentration | Medium |
Major Players
*Disclaimer: Major Players sorted in no particular order Image © Mordor Intelligence. Reuse requires attribution under CC BY 4.0. |
|
Composable Infrastructure Market Analysis by Mordor Intelligence
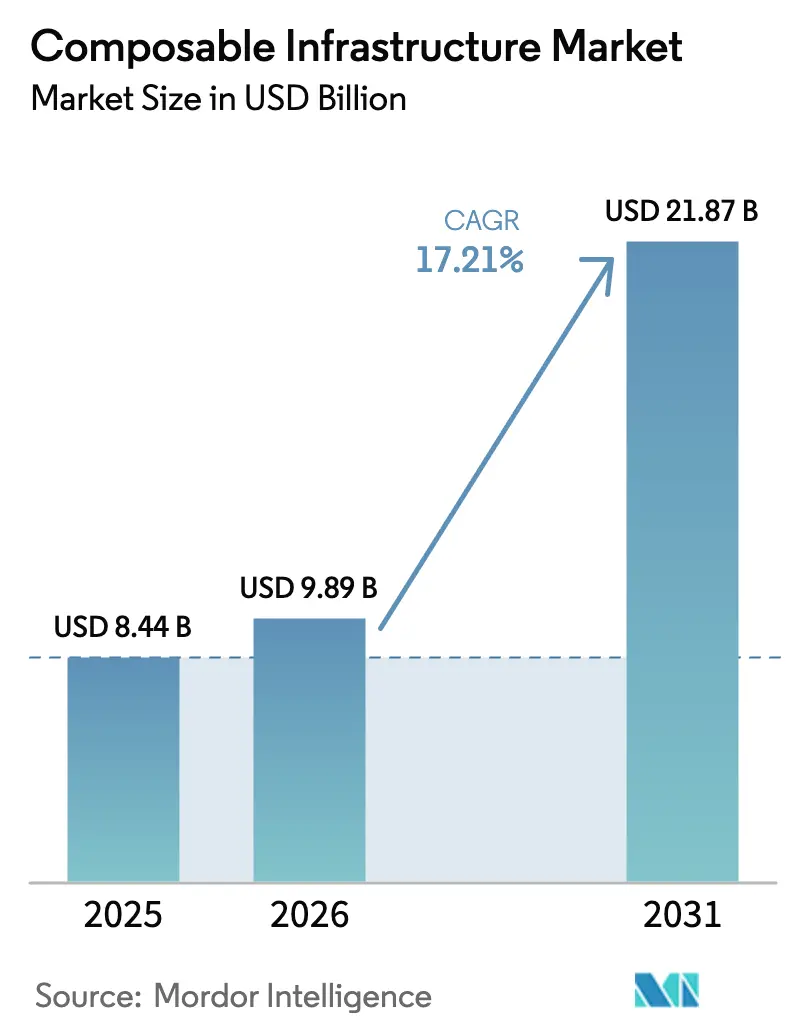
The composable infrastructure market size reached USD 9.89 billion in 2026 and is projected to climb to USD 21.87 billion by 2031, expanding at a 17.21% CAGR over the period, as enterprises pivot from monolithic data-center stacks toward software-defined resource pools that can be allocated on demand. Workload diversification, sovereign-cloud mandates, and the surge in generative-AI training are the dominant tailwinds. Leading hyperscalers now embed Compute Express Link (CXL) enabled memory fabrics into public-cloud instances, while on-premises deployments remain critical for industries bound by data-residency or low-latency needs. Hardware continues to account for most spending, but orchestration software is accelerating as fabric intelligence migrates into code, lowering integration barriers for heterogeneous servers. Start-ups specializing in PCIe Gen5 and CXL switch fabrics intensify competitive dynamics by shortening lead times for GPU and memory pooling at rack scale. Supply-chain disruptions for advanced switching ASICs and the operational effort required to retrofit legacy virtual-machine estates temper the overall growth trajectory, yet heavy investment from financial services, telecom, and healthcare offsets these headwinds.
Key Report Takeaways
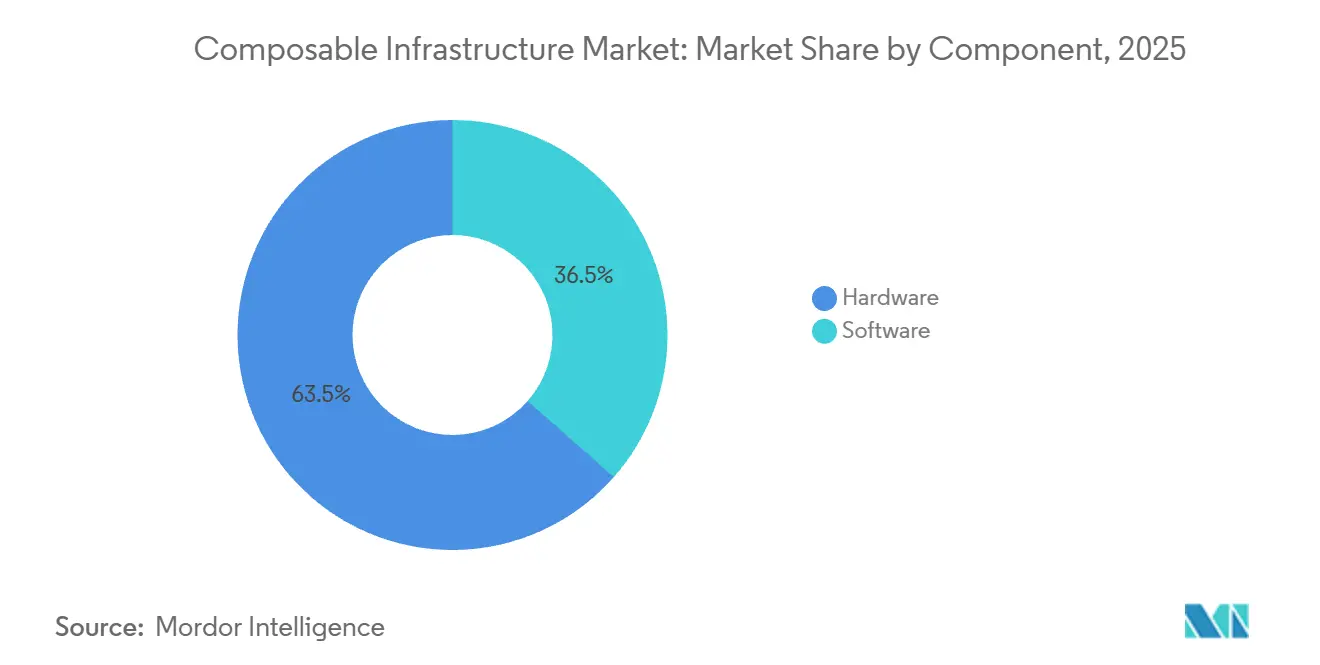
- By component, hardware held 63.51% of 2025 revenue, whereas software is forecast to expand at a 19.87% CAGR through 2031.
- By deployment model, on-premises commanded 71.63% of 2025 revenue, while cloud-based offerings post the fastest growth at a 19.97% CAGR.
- By organization size, large enterprises captured 68.74% of 2025 revenue, whereas small and medium enterprises are advancing at a 20.19% CAGR.
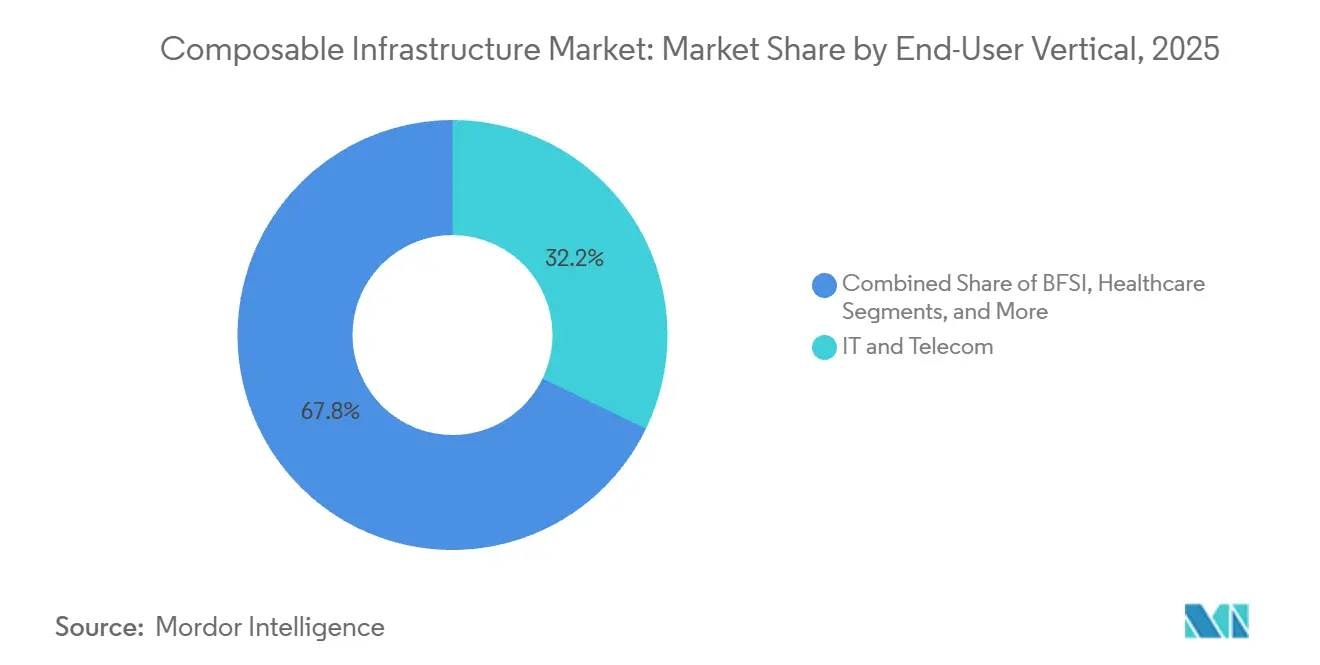
- By end-user vertical, IT and telecom led with 32.18% revenue share in 2025; healthcare records the highest projected CAGR at 18.14% to 2031.
- By application, AI and ML and HPC workloads accounted for 46.92% of 2025 revenue and are growing at an 18.19% CAGR.
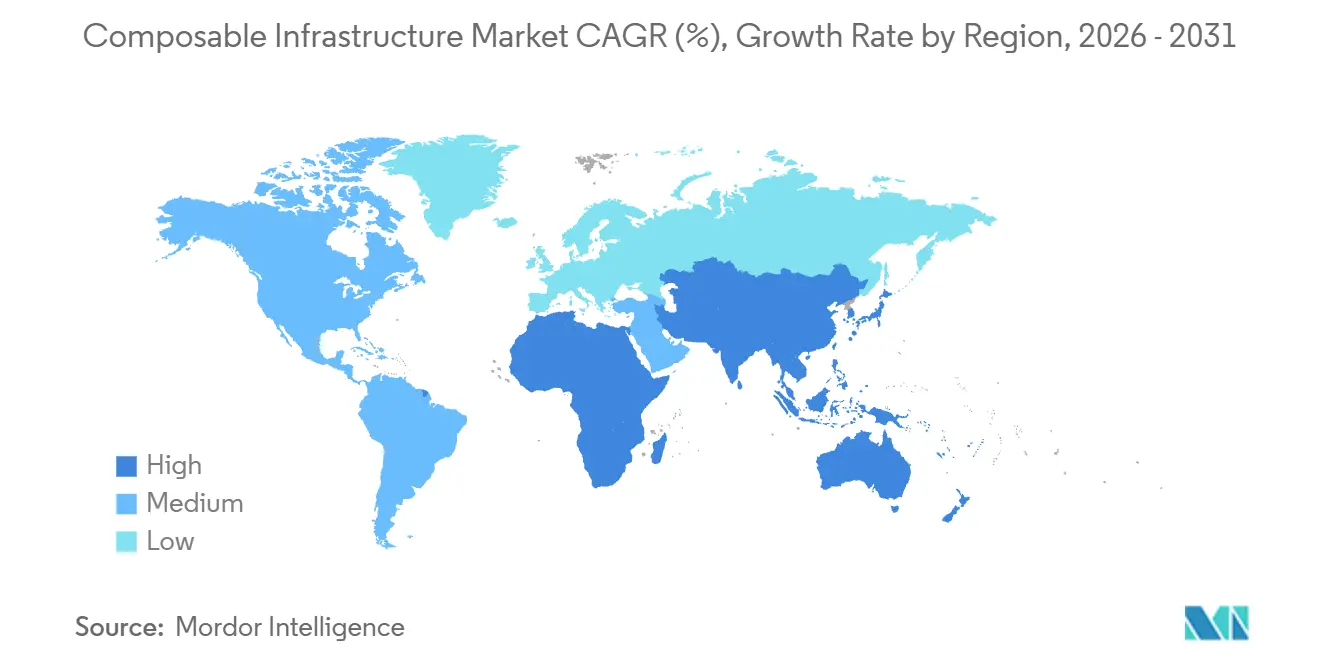
- By geography, North America dominated with 38.54% share in 2025; Asia Pacific is the fastest-growing region at 18.96% CAGR to 2031.
Note: Market size and forecast figures in this report are generated using Mordor Intelligence’s proprietary estimation framework, updated with the latest available data and insights as of January 2026.
Global Composable Infrastructure Market Trends and Insights
Drivers Impact Analysis*
| Driver | (~) % Impact on CAGR Forecast | Geographic Relevance | Impact Timeline |
|---|---|---|---|
| AI and ML GPU-Pooling Demand | +4.2% | Global, with concentration in North America and APAC | Medium term (2-4 years) |
| Cloud-Native and Micro-services Scalability Needs | +3.1% | Global, led by North America and Europe | Short term (≤2 years) |
| Data-Center Consolidation and CapEx Optimisation | +2.8% | North America, Europe, APAC core | Medium term (2-4 years) |
| Edge-Computing Deployment Acceleration | +2.5% | APAC, North America, Middle East | Long term (≥4 years) |
| CXL-Enabled Memory Composability | +2.3% | North America, Europe, APAC early adopters | Long term (≥4 years) |
| Sovereign-Cloud Compliance Boosting On-Prem Builds | +2.2% | Europe, APAC, Middle East | Medium term (2-4 years) |
| Source: Mordor Intelligence | |||
AI And ML GPU-Pooling Demand
Generative-AI training saturates GPU clusters for hours, then idles them for longer spells, leaving 40-60% of accelerator capacity unused in fixed servers. Composable infrastructure decouples GPUs from hosts through PCIe Gen5 or CXL fabrics that sustain sub-500-nanosecond latency. Nvidia’s DGX SuperPOD already pools up to 32 nodes, allowing a single H100 GPU to serve inference micro-services while joining a distributed training job in parallel. Liqid customers report 85% GPU utilization after reallocating accelerators every four hours, versus 45% in static racks. Financial-services firms benefit when fraud-detection models burst to 16 GPUs for milliseconds, then relinquish resources to other jobs. ISO/IEC 23009 interoperability guidance nudges vendors toward open APIs, further mitigating lock-in risk.[1]ISO, “ISO/IEC 23009 Interoperability Standard,” iso.org
Cloud-Native And Micro-Services Scalability Needs
Kubernetes clusters trigger erratic compute, memory, and NVMe demand that traditional appliances over-provision. Composable infrastructure satisfies pod scheduling spikes by attaching extra CPUs, DRAM, or storage from a pooled fabric in seconds via Container Storage Interface hooks. Red Hat OpenShift 4.15 introduced native composable storage back-ends in 2025, eliminating static drive binding. Cisco Intersight automates fabric provisioning when VMware Tanzu or Amazon EKS launches additional pods, cutting time-to-provision from hours to seconds. Financial-trading desks cite 60% tail-latency reductions relative to hyperconverged appliances, and CNCF security best practices favor hardware isolation baked into modern composable switch ASICs.
Data-Center Consolidation And CapEx Optimization
Enterprises transitioning from regionally dispersed server farms to high-density composable clusters shrink floor space and energy budgets. Fortune 500 adopters report 40% physical footprint reductions once storage and GPU expansion chassis move to shared pools. Consumption-based pricing by HPE GreenLake and Dell APEX turns what was capital expense into pay-per-use operating expense, a major lure for CFOs. Regulatory focus on energy efficiency, exemplified by the United States Department of Energy’s latest data-center guidelines, adds momentum to consolidation strategies.
CXL-Enabled Memory Composability
Compute Express Link revision 3.1 introduced multi-level switching so as many as 4,096 devices share a single memory namespace. Samsung and SK Hynix shipped 512 GB CXL 2.0 modules in 2024 and demoed 1 TB prototypes in 2025. SAP HANA users now tap an 8 TB pool rather than dedicating DRAM per node, avoiding costly over-provisioning. HPE’s Cray EX integrates CXL switches to expose remote memory with under 200-nanosecond latency, achieving 400 GB per-second bandwidth per node. JEDEC DDR5-CXL interoperability governance aids multi-vendor deployments.
Restraints Impact Analysis*
| Restraint | (~) % Impact on CAGR Forecast | Geographic Relevance | Impact Timeline |
|---|---|---|---|
| Legacy Integration Complexity | -2.1% | Global, acute in North America and Europe | Short term (≤2 years) |
| High Up-Front CapEx and Vendor Lock-In | -1.8% | Global, particularly SMEs in APAC and South America | Medium term (2-4 years) |
| PCIe Gen5 Switch Supply-Chain Bottlenecks | -1.5% | Global, most severe in North America and Europe | Short term (≤2 years) |
| Limited Persistent-Memory Orchestration Skills | -1.3% | Global, with skills gaps in emerging markets | Long term (≥4 years) |
| Source: Mordor Intelligence | |||
Legacy Integration Complexity
Organizations entrenched in VMware vSphere, Microsoft Hyper-V, or OpenStack environments face six-to-twelve-month retrofits when fabric managers must translate hypervisor calls into PCIe or CXL operations. vSphere 8.0 U2 added experimental CXL pooling yet remains uncertified for production. European survey data show 62% of firms flag legacy compatibility as the chief barrier to adoption. Regression testing for mission-critical workloads can devour 40% of project budgets, delaying payback periods. ISO 20000 prompts vendors to publish reference blueprints, but these often trail rapid ASIC road maps.
PCIe Gen5 Switch Supply-Chain Bottlenecks
Lead times for Broadcom and Marvell Gen5 switch ASICs exceed nine months as 5-nanometer fab capacity favors AI accelerators and phone chipsets. Crehan Research logged a 47% year-over-year jump in Gen5 Ethernet switch shipments in 2025, yet backlogs hit record highs. Vendors now ration scarce ASICs to top-revenue accounts, postponing mid-market deals by up to six months. Microchip retimer shortages force shorter cable runs, curbing rack-scale composability. New fab lines are not expected to reach volume until late 2026, leaving growth somewhat constrained.
*Our forecasts treat driver/restraint impacts as directional, not additive. The impact forecasts reflect baseline growth, mix effects, and variable interactions.
Segment Analysis
By Component: Software Orchestration Gains As Fabric Intelligence Deepens
Hardware contributed 63.51% of 2025 revenue, anchored by PCIe and CXL switch fabrics, disaggregated compute sleds, and NVMe-over-Fabrics arrays. Within the composable infrastructure market size for components, Hewlett Packard Enterprise and Dell Technologies claimed the lion’s share through pre-integrated racks that embed fabric managers. Orchestration software, though smaller, is racing ahead at a 19.87% CAGR as enterprises standardize on REST-based APIs to build automated workflows.
Liqid Command Center and GigaIO FabreX allow administrators to drag-and-drop GPUs, NVMe drives, and DRAM into logical servers, provisioning the builds through Kubernetes or VMware pipelines. Nutanix AHV 6.7 natively exposes composable storage, letting Kubernetes persistent volumes carve capacity from shared NVMe pools. Cisco Intersight, Lenovo XClarity, and IBM Cloud Pak unify telemetry across hybrid pools, and TidalScale pools multiple x86 nodes into a single logical system with terabytes of memory. Heightened ISO 27001 scrutiny accelerates this shift because software layers now embed role-based access and audit logs.


By Deployment Model: Cloud Composability Accelerates As Hyperscalers Embed CXL
On-premises builds commanded 71.63% of 2025 revenue, a reflection of data-sovereignty imperatives and the latency intolerance of high-frequency trading or defense workloads. This portion of the composable infrastructure market share remains solid among banks and governments seeking physical control over hardware.
Cloud-based composability is, however, the fastest-growing track at 19.97% CAGR. Microsoft Azure previewed composable VMs with up to 8 TB of CXL-shared memory per instance, while AWS EC2 P5 allows dynamic H100 GPU attachment by the minute. Google Cloud A3 Mega adds hot-resize NVMe volumes for genomics researchers. Hybrid consumption models such as HPE GreenLake and Dell APEX blur CapEx and OpEx distinctions, letting enterprises burst to cloud pools during spikes and shrink on-prem uses off-peak.
By Organization Size: SMEs Embrace Consumption Models To Sidestep CapEx
Large enterprises generated 68.74% of 2025 revenue, financing rack-scale fabrics that feed AI training clusters and massive simulations. Automotive OEMs use shared pools to run CFD workloads needing 2 TB of memory a job, flexing resources without idle hardware.
Small and medium enterprises form the fastest-expanding cohort at 20.19% CAGR. Lenovo TruScale and Dell APEX Flex on Demand convert infrastructure into monthly bills pegged to measured consumption, avoiding million-dollar outlays. Mid-market SaaS providers now isolate tenant workloads at the fabric layer, mitigating noisy-neighbor risks. Integration remains challenging for SMEs lacking in-house modernization talent, and proprietary control planes still raise vendor-lock-in concerns.
By End-User Vertical: Healthcare Imaging Drives Storage Composability
IT and telecom dominated 2025 with 32.18% revenue as service providers ran 5G cores, edge nodes, and vRAN workloads on dynamically rebalanced pools. Telcos like Verizon consolidate regional data centers, trimming site counts by 40% without sacrificing latency.[2]Cisco, “Intersight Cloud Operations,” cisco.com
Healthcare climbs at an 18.14% CAGR thanks to radiology departments moving petabyte-scale Picture Archiving and Communication Systems into composable NVMe arrays. Dell APEX for Healthcare supplies AI-assisted image analysis while two-second retrieval SLAs persist. BFSI firms deploy GPU pools for millisecond fraud screening, and industrial manufacturers run predictive-maintenance models at the edge. Government deployments gain momentum through sovereign-cloud programs that specify composable architectures for classified workloads.

By Application And Workload: AI Training Clusters Dominate Resource Pools
AI, ML, and HPC workloads captured 46.92% of 2025 revenue and are expanding at an 18.19% CAGR, underpinning the composable infrastructure market for workloads through 2031. Nvidia DGX SuperPOD pools accelerators across 32 nodes, splitting a single H100 between concurrent inference and training.
Research labs such as Lawrence Livermore dynamically allocate 16,384 CPU cores and 512 TB of memory from shared pools to run climate models. GitLab CI/CD pipelines running on composable nodes slash build times 70%, and SAP HANA users cut total cost of ownership by 50% when drawing memory from CXL pools at night. VDI and cloud gaming leverage burst GPU allocation, with Nvidia GeForce NOW curbing idle GPU capacity by 60% compared to static racks.
Geography Analysis
North America generated 38.54% of 2025 revenue, propelled by hyperscaler adoption and Fortune 500 data-center consolidation. United States banking giants trimmed physical footprints 40% after moving to pooled resources, and Canada’s Shared Services tender mandates that sovereign workloads run on HPE GreenLake composable services. Mexico’s carriers pool compute for 5G vRAN, while National Institute of Standards and Technology guidelines push federal agencies toward hardware-isolated composable nodes to counter supply-chain risks.
Asia Pacific is the fastest-growing region at 18.96% CAGR. India’s 2025 data-sovereignty rules push ministries toward domestic providers such as Yotta Infrastructure, and China’s USD 12 billion subsidy fosters AI training farms on Inspur and Huawei gear. Japan’s factories pool edge compute for Industry 4.0, South Korea’s SK Telecom invests USD 800 million in CXL memory fabrics for generative-AI, and Singapore’s Digital Realty now offers composable colocation to local cloud-service vendors. Southeast Asia’s service providers, burdened by fluctuating demand, embrace pay-per-use resource pools.
Europe maintains a sizeable slice, anchored by Digital Operational Resilience Act requirements. Germany’s BaFin forces banks to keep transaction data on locally controlled hardware, prompting Deutsche Bank and Commerzbank to roll out Dell and HPE composable racks. The United Kingdom’s National Health Service signs a GBP 150 million (USD 190 million) NetApp contract for electronic health records backed by composable storage. France’s sovereign-cloud project favors domestic hosts like Atos and OVHcloud. Middle Eastern data-center operators equip smart-city rollouts with disaggregated fabrics, and UAE sovereign funds commit USD 5 billion to AI training clusters built on pooled GPUs.[3]UAE Government, "Smart City and AI Initiatives," u.ae South Africa pilots Cisco-based composable platforms for real-time payments, whereas Brazil’s import tariffs slow broader Latin American uptake despite Anatel’s incentive program.

Regulatory Landscape
Composable infrastructure deployments in regulated environments increasingly inherit requirements from cybersecurity and sovereignty frameworks that shape where data is processed and what controls can be demonstrated at the infrastructure layer. In the United States, FedRAMP scoping and related federal guidance (including OMB Memorandum M-24-15) continue to frame cloud and hybrid infrastructure choices for agencies handling unclassified information, which keeps the focus on auditable configurations and standardized control mappings aligned to NIST control families.
In Europe, sovereignty has moved from general policy to procurement-grade criteria. The European Commission published and promoted its Cloud Sovereignty Framework in June 2026, using a multi-criteria evaluation model that covers legal and jurisdictional factors, supply-chain considerations, and security and operational controls. This raises demand for composable platforms that can enforce workload placement, segmentation, and attestable configurations. Separately, the EU AI Act (enacted in August 2024) introduces transparency and high-risk obligations starting August 2, 2026 for covered systems, increasing demand for traceability and governance hooks in the orchestration layer where AI and data pipelines run.
Value Chain Analysis
The value chain spans (1) foundational silicon and components, including CPUs, GPUs, DPUs, memory, and interconnect silicon (PCIe Gen5 and CXL controllers or switch ASICs), (2) system integration into composable compute sleds, GPU expansion, and NVMe-over-Fabrics storage shelves, and (3) control-plane software that discovers, composes, and governs resources through APIs. Upstream constraints in advanced switching silicon and qualified CXL components directly affect lead times and system availability, while midstream OEMs and ODMs package these parts into rack-scale designs optimized for AI and mixed workloads.
Downstream, distribution typically runs through OEM direct sales, global system integrators, and colocation and managed-service providers delivering composable capacity as a service. Fabric managers and policy engines (often integrated with Kubernetes and infrastructure-as-code workflows) act as key operational differentiators, supporting repeatable compositions, guardrails, telemetry, and lifecycle automation. The ecosystem also relies on interoperability and management standards bodies and communities, including the Open Compute Project and DMTF practices around management interfaces, which influence multi-vendor deployments and reduce integration friction across heterogeneous pools.
Competitive Landscape
The top five vendors Hewlett Packard Enterprise, Dell Technologies, Cisco Systems, Lenovo Group, and Nutanix controlled about 55% of 2025 revenue, pointing to a moderately concentrated structure. Each leverages entrenched server or hyperconverged install bases to upsell composable extensions, yet faces agile challengers such as Liqid, GigaIO Networks, and One Stop Systems that specialize in PCIe Gen5 and CXL fabrics with shorter release cycles.
Incumbents debate closed versus open stances. HPE’s silicon root of trust and Dell’s PowerEdge kinetic nodes represent proprietary differentiators, whereas others rally behind CXL standards and the Open Compute Project for multivendor rack designs. Edge computing remains under-served, yielding white-space for ruggedized form factors that tolerate industrial temperatures and vibration.
Software differentiation intensifies. Cisco Intersight integrates with Red Hat OpenShift and Amazon EKS to automate GPU and NVMe allocation after container scheduling events. Nvidia Base Command predicts job completion and reallocates accelerators in advance, while AWS Outposts and Microsoft Azure Stack HCI blur cloud and on-prem form factors with pay-as-you-go nodes. With VMware now under Broadcom, deeper integration of composable orchestration into vSphere is expected, although regulatory hurdles slow cross-portfolio harmonization.
Composable Infrastructure Industry Leaders
-
Hewlett Packard Enterprise Co.
-
Dell Technologies Inc.
-
Cisco Systems Inc.
-
Lenovo Group Ltd.
-
NetApp Inc.
- *Disclaimer: Major Players sorted in no particular order

Market Opportunities and Future Outlook
Rack-scale, turnkey AI infrastructure is widening the addressable deployment model for composable designs because it packages compute, storage, and networking as a repeatable unit with higher power and cooling density than legacy appliance stacks. This shift shows up in vendor roadmaps and launches, including Dell highlighting rack-scale infrastructure as a core deployment unit for production AI environments and introducing the PowerRack portfolio in May 2026. For buyers, this creates purchasing pathways aligned with AI cluster rollouts while preserving reuse of the underlying fabric and chassis as accelerators refresh.
Data-centric composability, especially NVMe-oF and in-storage or near-data processing, is another white-space area where platforms compete on reducing data movement and operational overhead. NetApp acquiring DataPelago in July 2026 reflects the push to embed broader data processing closer to storage, which complements composable architectures pooling NVMe capacity for AI and analytics. On the connectivity side, higher-bandwidth Ethernet and RDMA capabilities, such as Chelsio launching a 400Gb-focused AI interconnect platform in July 2026, support the east-west traffic patterns common in pooled GPU and storage fabrics. Together, these moves point to opportunities for vendors and integrators to deliver end-to-end validated stacks that combine fabric, storage, and orchestration with compliance-ready telemetry and policy controls for hybrid and sovereign deployments.
Recent Industry Developments
- May 2026: Dell Technologies announced the PowerRack portfolio at Dell Technologies World 2026, positioning rack-scale systems that integrate compute, networking, and storage for AI workloads. The company framed the portfolio as a turnkey deployment model that packages composable building blocks, reducing integration effort for high-density clusters and accelerating time to production for AI projects.
- September 2025: Cisco Systems introduced the UCS X9516 X-Fabric Module 2.0 and UCS X580p PCIe Node for the UCS X-Series, extending its cloud-operated modular architecture for GPU-intensive and generative AI workloads. These additions expand rack-level expansion and composability options, supporting higher I/O density and more flexible attachment of accelerators and peripherals.
- May 2024: Dell Technologies expanded its APEX portfolio with enhancements aimed at composable infrastructure operations, including additional AIOps capabilities for observability and health management. The update improved day-2 operations by automating detection and remediation workflows across infrastructure layers, helping enterprises run pooled resources with fewer manual interventions.


Research Methodology Framework and Report Scope
Market Definition and Coverage
This market is defined as the revenue earned from composable infrastructure systems and software that let compute, storage, memory, and accelerators be pooled and assembled on demand inside enterprise or colocation data centers.
Scope exclusions: We exclude public cloud IaaS, refurbished hardware, OEM support contracts, and generic PCIe switches that are not used for resource pooling.
Segmentation Overview
-
By Component
- Hardware
- Software
-
By Deployment Model
- On-Premises
- Cloud
-
By Organisation Size
- Large Enterprises
- Small and Medium Enterprises (SMEs)
-
By End-User Vertical
- IT and Telecom
- BFSI
- Healthcare
- Industrial Manufacturing
- Government and Public Sector
- Other End-User Verticals
-
By Application / Workload Type
- AI and ML and HPC
- DevOps and CI/CD
- Databases and Analytics
- VDI and Cloud Gaming
- Other Workloads
-
By Geography
-
North America
- United States
- Canada
- Mexico
-
South America
- Brazil
- Argentina
- Rest of South America
-
Europe
- United Kingdom
- Germany
- France
- Italy
- Spain
- Russia
- Rest of Europe
-
Asia Pacific
- China
- India
- Japan
- South Korea
- Australia
- Southeast Asia
- Rest of Asia Pacific
-
Middle East
- United Arab Emirates
- Saudi Arabia
- Turkey
- Rest of Middle East
-
Africa
- South Africa
- Nigeria
- Egypt
- Rest of Africa
-
North America
Data Sources, Market Sizing, and Validation
Desk Research
Desk research was used to set the market perimeter and collect anchor time series that can be checked year to year. We typically refer to public sources such as the U.S. SEC filings, U.S. Bureau of Economic Analysis (BEA) digital economy tables, U.S. International Trade Commission (USITC) trade data, the International Telecommunication Union (ITU) indicators, and OECD ICT statistics to understand IT spending direction and cross-border hardware flows.
Along with these, we reviewed data center capacity signals and enterprise infrastructure trends from sources such as hyperscale and colocation press releases, standards bodies focused on fabrics and interconnects, and peer reviewed papers that discuss composable architectures and disaggregation. Some company financials and news datasets, patent databases, and an import and export shipment-level database were also used to validate timelines, product launches, and adoption intensity. This list is not exhaustive, and we relied on additional public and subscription sources for data collection, validation, and research clarification.
Primary Interviews and Surveys
Primary interviews and surveys focused on validating what gets counted as composable infrastructure in real deployments, and how spending splits between chassis, fabric interconnect, pooled accelerator enclosures, and orchestration layers. We spoke with infrastructure buyers, data center operators, channel partners, and solution architects across APAC, EMEA, and the Americas to close gaps from desk research and confirm assumptions about practical scope and project implementation patterns.
Distribution of primary research fieldwork respondents
| Company type | Respondent position | Region |
|---|---|---|
| Top tier: 36% | CXOs: 17% | APAC: 43% |
| Mid tier: 47% | Functional/Unit leaders: 41% | EMEA: 31% |
| Smaller Players: 17% | Managers: 42% | Americas: 26% |
Market-Sizing & Forecasting
The core model uses a top-down build that reconstructs demand from enterprise and colocation data center refresh activity, then filters it to the portion that is actually composable, meaning pooled resources managed through a fabric manager. To keep totals grounded, we corroborate the output with selective bottom-up approximations, such as sampled average selling price ranges for composable chassis and interconnects, plus a volume sanity check based on project counts captured through channel conversations.
Key inputs that shaped the market totals included server and storage refresh cycles, AI and GPU enclosure adoption in on-prem environments, spending direction for data center modernization, attach rates for orchestration software, and the mix shift between traditional rack builds and disaggregated pools. Where bottom-up evidence was thin for a specific country or niche buyer segment, we used conservative penetration assumptions, then rechecked them using interview feedback. We adjusted only when multiple respondents pointed to the same pattern.
For forecasting, we used scenario analysis supported by a light regression check on macro IT spending and data center build indicators, since adoption depends on budget cycles and workload change. Assumptions on price progression and the pace of composable rollouts were reviewed with practitioners so the forecast remains explainable and consistent.
Data Validation & Update Cycle
Validation was done by triangulating the modeled market with independent signals such as data center capex direction, reported infrastructure platform revenue cues, and the pace of AI infrastructure additions in enterprise facilities. Outliers were flagged first, then reviewed in a second pass that checks math consistency, currency conversions, and year alignment before sign-off.
If a material variance shows up, such as a major product shift, a data center investment pause, or a demand surge tied to AI projects, the assumptions are rechecked and select experts are re-contacted to confirm the change. Reports are refreshed annually, with interim updates when events materially change the outlook. Before delivery, an analyst runs a final pass so clients receive the latest updated view.
Mordor Intelligence's Composable Infrastructure Market Size Compared With Other Published Estimates
Published market values for composable infrastructure do not always match because each estimate draws the line differently on what counts as composable and how fast adoption is assumed to spread. Differences also come from pricing logic, currency timing, and whether the estimate is anchored to enterprise data center spend signals or to broader infrastructure categories.
Some sources expand the scope to include adjacent cloud infrastructure spend and broader software-defined stacks, which inflates the starting point and can also amplify the growth curve. In the Mordor Intelligence approach, revenue is counted only when the solution is used for pooled and fabric-managed resource composition inside enterprise or colocation data centers, and public cloud IaaS and unrelated switch sales are left out.
Benchmark comparison
| Source | Market Size | Gaps in Research Methodology |
|---|---|---|
| Mordor Intelligence | USD 9.89 B (2026) | |
| Industry Newswire A | USD 3.60 B (2022) | Uses an earlier base year and a broader definition that appears to bundle hardware and software categories without clearly separating enterprise and colocation deployments from wider infrastructure spend, which can change the starting value materially. |
| Industry Blog B | USD 8.23 B (2024) | Shows a very high near-term growth rate that suggests aggressive adoption assumptions and less visible checks against practical rollout constraints such as refresh cycles, procurement timing, and the share of projects that truly use fabric-managed pooling. |
The spread in the table is mainly explained by year selection and how adjacent infrastructure categories are treated, then by how quickly pricing and adoption are allowed to rise. By grounding totals in repeatable demand signals and sanity-checking them with buyer and channel feedback, the estimate stays traceable to clear inputs rather than being driven by optimistic expansion assumptions.


Key Questions Answered in the Report
What is the projected CAGR for composable infrastructure through 2031?
The composable infrastructure space is expected to expand at 17.21% CAGR between 2026 and 2031.
Which component segment is growing fastest?
Orchestration software is forecast to advance at a 19.87% CAGR as fabric intelligence migrates from hardware into code.
How big is the North American share?
North America captured 38.54% of 2025 revenue, driven by hyperscaler adoption and Fortune 500 data-center consolidation.
Why are SMEs adopting composable platforms?
Consumption models like Lenovo TruScale and Dell APEX convert CapEx into operating expense, lowering entry barriers for SMEs.
What role does CXL play in composable infrastructure?
CXL 3.1 enables multi-level memory switching so thousands of devices share a single namespace with sub-200-nanosecond latency, unlocking elastic DRAM pools for large databases.
Which workload types dominate current deployments?
AI and ML and HPC workloads held 46.92% of 2025 revenue and continue to lead growth with an 18.19% CAGR.
Page last updated on:






