Market Trends of Compliance Carbon Credit Industry
Charting the Course of Carbon Pricing: UK-ETS Post-Brexit
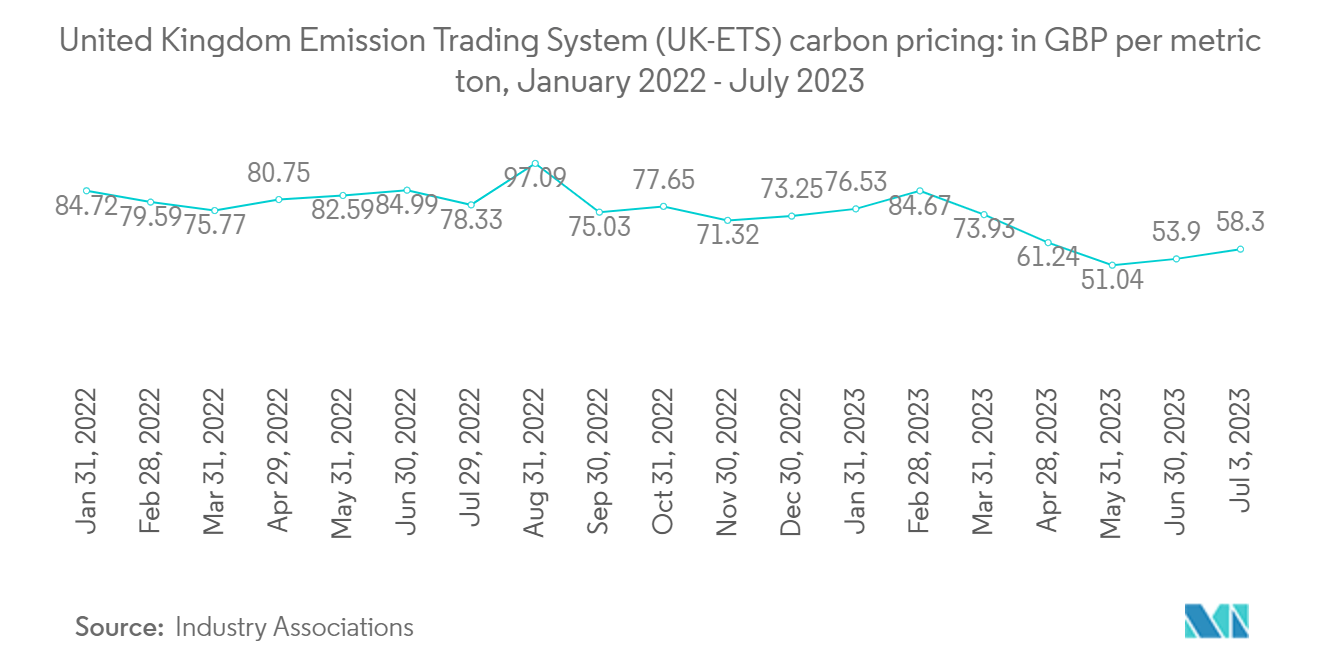
- After leaving the European Union in 2020, the United Kingdom implemented its carbon pricing mechanism, the UK-ETS, which replaced its participation in the EU-ETS. This transition allowed the United Kingdom to establish its emissions trading system and set its carbon pricing policies independent of the European Union.
- The price of emissions allowances (UKAs) traded on the United Kingdom's Emissions Trading System (UK-ETS) has experienced notable fluctuations since its inception in January 2021. According to industry experts, the price reached a high of GBP 97.75 per metric ton on August 19, 2022, indicating strong demand or regulatory factors driving the price. However, by May 31, 2023, the price dropped to GBP 51.04 per metric ton, marking the lowest price before January 2022. Various factors, including changes in market conditions, regulatory adjustments, or shifts in supply and demand dynamics, could have influenced this decline in price.
- In 2022, the UK-ETS generated significant revenue, totaling GBP 4.3. This revenue represents the financial impact of carbon pricing on regulated entities within the United Kingdom, including industrial facilities, power plants, and other sectors covered by the emissions trading system. The revenue generated from carbon allowances reflects the cost of compliance for these entities and contributes to government funds dedicated to climate-related initiatives and investments.
Understand The Key Trends Shaping This Market
Download PDF
Renewable Energy Investments and Technological Innovations Driving Carbon Credit Generation
- Many energy companies invest in renewable power sources, including wind, hydroelectric, and solar power, to reduce their carbon footprint. This shift toward cleaner energy production creates opportunities for generating compliance carbon credits from renewable energy projects.
- For instance, in February 2024, Chile embarked on a European hunt for investors in solar, wind, and green hydrogen technologies to decarbonize copper mines and other industries reliant on fossil fuels. During renegotiations of the EU Chile Trade and Investment Agreement, Marcos Kulka, president of H2Chile, a hydrogen association representing 102 publicly and privately owned companies, went to Europe to present his government's energy strategy.
- Further, Industry experts believe blockchain technology can enhance carbon credit validation in the carbon market by integrating with MRV (Digital Monitoring, Reporting, and Verification) systems. MRV systems collect data from various sources, including satellite images, IoT sensors, and monitoring systems. The digital MRV data is hashed and uploaded to the blockchain to verify carbon credits. Smart contracts automate the verification process by ensuring carbon credits are issued only to projects that fulfill specific criteria. Using decentralized oracles, off-chain information feeds can be added to the validation process, allowing for real-time carbon credit validation.
Get Analysis on Important Geographic Markets
Download PDF
