
Market Overview
| Study Period | 2020 - 2031 |
|---|---|
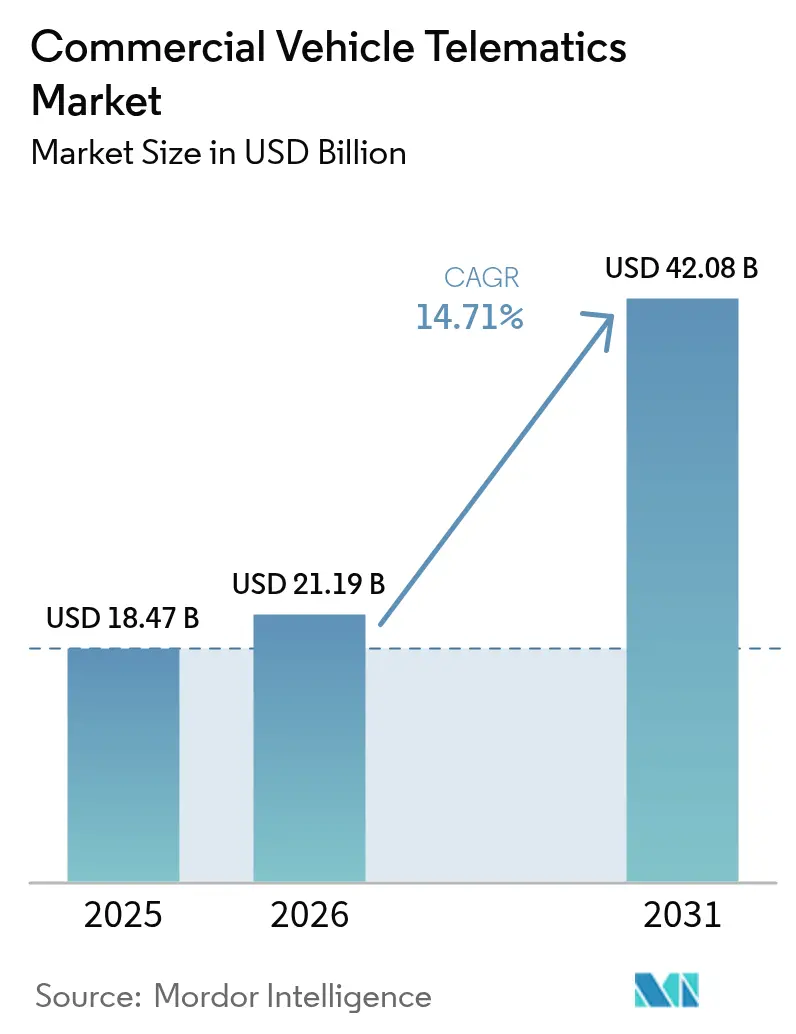
| Market Size (2026) | USD 21.19 Billion |
| Market Size (2031) | USD 42.08 Billion |
| Growth Rate (2026 - 2031) | 14.71% CAGR |
| Fastest Growing Market | Asia Pacific |
| Largest Market | North America |
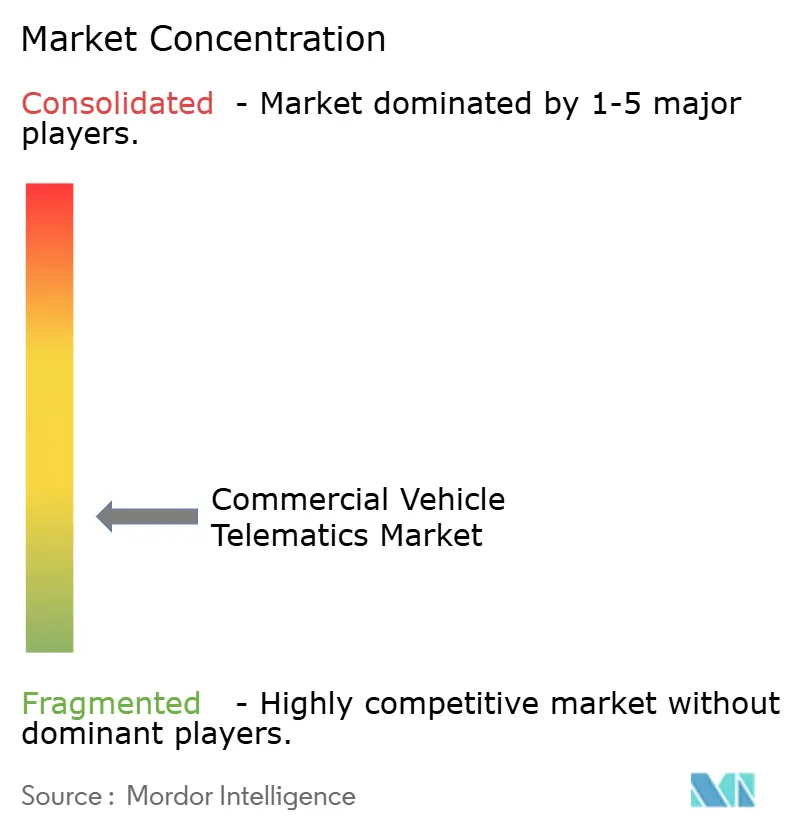
| Market Concentration | Low |
Major Players *Disclaimer: Major Players sorted in no particular order Image © Mordor Intelligence. Reuse requires attribution under CC BY 4.0. | |
Commercial Vehicle Telematics Market Analysis by Mordor Intelligence
The commercial vehicle telematics market size is expected to increase from USD 18.47 billion in 2025 to USD 21.19 billion in 2026 and reach USD 42.08 billion by 2031, growing at a CAGR of 14.71% over 2026-2031. Operators are moving past basic location tracking toward connected-asset strategies that improve fuel efficiency, driver safety, and vehicle uptime. Regulatory deadlines for electronic logging devices, the factory-fitment of telematics hardware by truck makers, and the rapid infusion of artificial intelligence into routing and maintenance workflows are reshaping total cost of ownership calculations. Rising e-commerce volumes have spawned large last-mile delivery fleets that adopt connectivity by default, while subscription-based data marketplaces allow operators to monetize anonymized insights, offsetting monthly service fees. These themes, together with the need to manage battery health in zero-emission trucks, sustain double-digit expansion even as hardware prices fall and competition intensifies.
Key Report Takeaways
- By offering solutions, the company captured 63.42% of revenue in 2025, while services are projected to expand at a 15.11% CAGR to 2031.
- By provider type, OEM platforms held 58.71% of the commercial vehicle telematics market size in 2025; aftermarket systems deliver the highest 15.14% CAGR over the forecast horizon.
- By vehicle class, light commercial vehicles accounted for 48.89% of revenue in 2025, yet heavy and medium trucks are set to grow at a 15.17% CAGR through 2031.
- By communication technology, cellular connectivity dominated with 82.33% share in 2025, but hybrid architectures are climbing at a 15.38% CAGR.
- By end-user vertical, transportation and logistics accounted for 39.63% of demand in 2025, while construction and mining are the fastest-growing segments at a 16.19% CAGR to 2031.
- By geography, North America led the commercial vehicle telematics market with a 34.66% share in 2025, while Asia-Pacific is advancing at the fastest 15.78% CAGR through 2031.
Note: Market size and forecast figures in this report are generated using Mordor Intelligence’s proprietary estimation framework, updated with the latest available data and insights as of 2026.
Global Commercial Vehicle Telematics Market Trends and Insights
Drivers Impact Analysis*
| Driver | (~) % Impact on CAGR Forecast | Geographic Relevance | Impact Timeline |
|---|---|---|---|
| Increasing Adoption of Factory-Installed OEM Telematics in Heavy Trucks | +3.2% | Global, concentrated in North America and Europe | Medium term (2-4 years) |
| Mandatory Electronic Logging-Device and Safety Regulations | +2.9% | North America, Europe, emerging Asia-Pacific | Short term (≤ 2 years) |
| Demand for AI-Driven Fleet Optimisation to Cut Total Cost of Ownership | +2.6% | Global, led by North America and Europe | Medium term (2-4 years) |
| Rapid Expansion of Last-Mile E-Commerce Delivery Fleets | +2.4% | Global, highest in Asia-Pacific and North America | Short term (≤ 2 years) |
| Emergence of Subscription-Based Telematics Data Marketplaces | +1.8% | North America and Europe, early Asia-Pacific | Long term (≥ 4 years) |
| Integration of Telematics with Zero-Emission Truck Energy and Charge Management | +1.7% | Europe and North America, expanding Asia-Pacific | Long term (≥ 4 years) |
| Source: Mordor Intelligence | |||
Increasing Adoption of Factory-Installed OEM Telematics in Heavy Trucks
Truck makers now pre-install telematics units on the assembly line, giving fleets instant access to vehicle data without downtime for retrofits. Daimler Truck, for instance, links its TruckCharge software to factory devices so operators fine-tune charging stops for electric tractors.[1]Daimler Truck, “TruckCharge Network Launch,” daimlertruck.com Volvo Trucks surpassed one million connected heavy units, streaming diagnostics that cut surprise breakdowns and fuel waste. TRATON reported 1.15 million connected trucks across its Scania, MAN, and Navistar brands, turning data subscriptions into a margin lever. Factory integration lowers lifetime hardware cost per truck, yet raises switching barriers when fleets run mixed brands, pushing software vendors to aggregate multiple OEM feeds in one dashboard.
Mandatory Electronic Logging-Device and Safety Regulations
Governments require electronic logging devices to police driver hours, making telematics compulsory rather than optional. The Federal Motor Carrier Safety Administration conducts roadside audits that pull hours-of-service files directly from cab units.[2]FMCSA, “Electronic Logging Devices,” fmcsa.dot.gov Europe’s smart tachograph upgrade aligns with working-time directives, forcing fleets to replace first-generation recorders by 2026. India’s transport ministry mandates location tracking and an emergency button on trucks and buses, accelerating adoption across a price-sensitive market. Complying with different regional standards inflates engineering costs, but the rulebook still guarantees baseline device demand for vendors.
Demand for AI-Driven Fleet Optimisation to Cut Total Cost of Ownership
Artificial intelligence now parses engine, route, and video data to squeeze every dime from fuel and maintenance budgets. A joint study by Einride and Fraunhofer showed AI routing and predictive service can drive 8%–13% total cost savings for mixed diesel and electric fleets.[3]Einride, “Total Cost of Ownership Study for Electric and Diesel Heavy-Duty Fleets,” einride.tech Deloitte’s latest outlook notes that unplanned downtime drops by up to 25% when machine-learning models spot early signs of brake wear or coolant issues. Motive Technologies adds computer-vision dashcams that lower collision frequency by 80%, trimming insurance bills for policyholders. With payback measured in months, procurement teams prioritize platforms that bundle AI analytics with compliance and dispatch tools.
Rapid Expansion of Last-Mile E-Commerce Delivery Fleets
Soaring online orders compel carriers to add thousands of light vans, all shipped with embedded trackers that feed real-time delivery apps. McKinsey estimates that last-mile work already accounts for 53% of shipping costs, so operators are pursuing telematics-enabled dynamic routing to shave 15%–30% off travel time. Retail giants like Amazon and Walmart internalize logistics, building proprietary telematics stacks that pressure traditional parcel firms to modernize. The United States Postal Service is rolling out fleet-wide connectivity to boost route efficiency and cut fuel spend, signaling public-sector momentum. This arms race fuels record device orders and recurring data-service contracts for vendors who can scale quickly.
Restraints Impact Analysis*
| Restraint | (~) % Impact on CAGR Forecast | Geographic Relevance | Impact Timeline |
|---|---|---|---|
| Cyber-Security Vulnerabilities in Connected Commercial Vehicles | -1.4% | Global, heightened in North America and Europe | Short term (≤ 2 years) |
| Fragmented Connectivity Infrastructure in Developing Regions | -1.2% | Africa, South America, rural Asia-Pacific | Medium term (2-4 years) |
| Cost and ROI Concerns for Small Fleet Operators | -0.9% | Global, acute in emerging markets | Medium term (2-4 years) |
| Data-Ownership and Privacy-Compliance Hurdles | -0.7% | Europe, North America, expanding Asia-Pacific | Long term (≥ 4 years) |
| Source: Mordor Intelligence | |||
Cyber-Security Vulnerabilities in Connected Commercial Vehicles
Rolling computers on wheels expose braking, steering, and payload systems to hackers. The European Union’s WP.29 regulation now obliges truck makers to certify secure development practices and ensure life-cycle patching, but millions of legacy units lack encrypted boot loaders. A 2025 report from the EU Agency for Cybersecurity warns that over-the-air updates introduce new attack vectors if cryptographic keys are poorly managed. High-profile breaches could immobilize fleets or compromise cargo, delaying investment among risk-averse small operators until vendors add intrusion detection and bundled cyber insurance. As security hardening raises device cost, buyers weigh the price premium against potential liability.
Fragmented Connectivity Infrastructure in Developing Regions
Outside dense corridors, cellular dead zones hobble real-time tracking. Store-and-forward modes delay driver coaching and exception alerts, limiting the operational upside for fleets in rural Africa, inland South America, and interior Asia. Deloitte notes operators often pay for dual-mode cellular-satellite hardware, doubling airtime spend to maintain uptime. Hybrid modems improve coverage but add provisioning complexity, prolonging deployment schedules. Until governments or mobile carriers fill the gaps in remote areas, uptake remains muted in regions that arguably need fleet visibility the most.
*Our forecasts treat driver/restraint impacts as directional, not additive. The impact forecasts reflect baseline growth, mix effects, and variable interactions.
Segment Analysis
By Offering: Services Expand as Managed Models Gain Traction
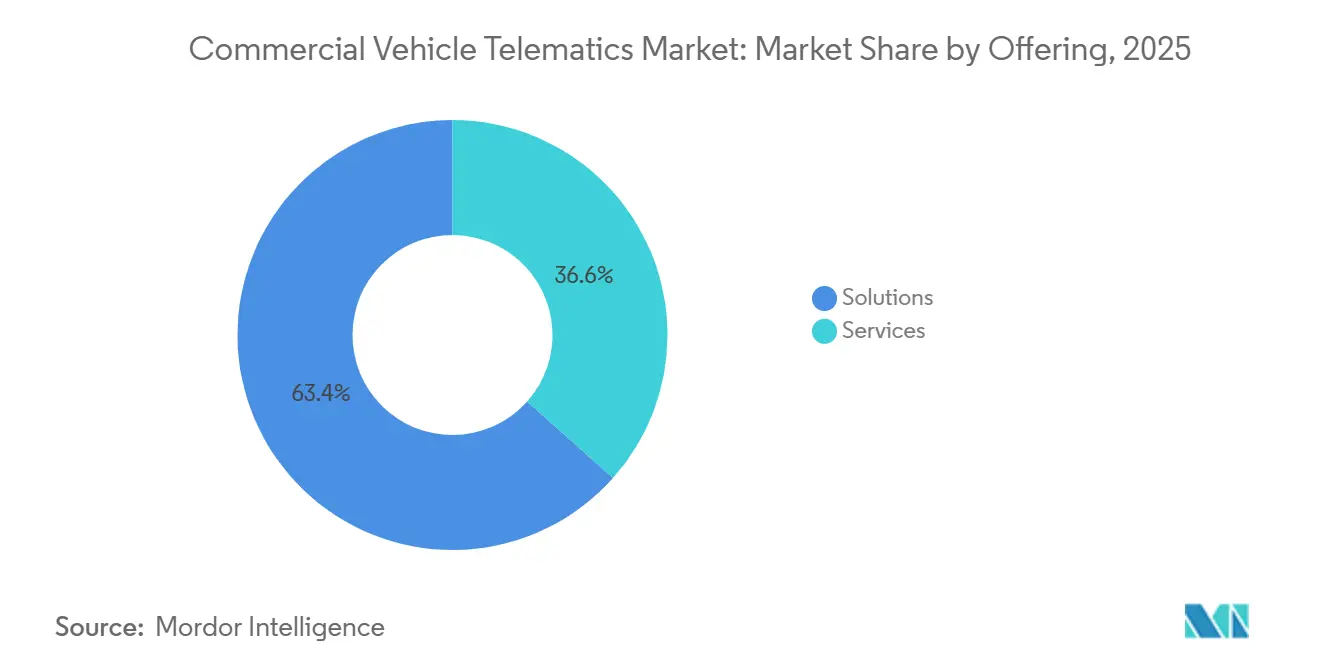
Solutions held 63.42% of commercial vehicle telematics market revenue in 2025, covering tracking, driver management, insurance telematics, compliance, V2X, predictive maintenance, and asset monitoring. Services are projected to outpace the overall market, with a 15.11% CAGR to 2031, as operators prefer predictable operating budgets to capital outlays. The commercial vehicle telematics market for managed services is growing as vendors now bundle hardware, airtime, analytics, and support into a single invoice that scales with fleet count.
Fleet tracking remains the largest solution subset, yet predictive maintenance gains ground as downtime penalties escalate. Professional services such as system integration and custom analytics are critical for large, mixed-asset fleets that link legacy dispatch systems with modern cloud dashboards. Managed offerings resonate with small carriers lacking full-time IT staff, tipping contract awards toward providers that guarantee uptime, remote troubleshooting, and compliance reporting with minimal operator intervention.


By Provider Type: Aftermarket Retrofit Demand Surges in Aging Fleets
OEM channels accounted for 58.71% of revenue in 2025 because factory-installed units are shipped with every new heavy truck platform. Meanwhile, aftermarket vendors post a 15.14% CAGR as retrofit kits modernize older vehicles that still dominate many regional haul and vocational operations. The commercial vehicle telematics market share remains split as operators weigh deep vehicle-network integration from OEM devices against the vendor neutrality and faster innovation cadence of aftermarket plugs.
Mixed-brand fleets welcome middleware that consolidates proprietary OEM data feeds under a single user interface, reducing dispatcher workload. OEMs respond by opening APIs and co-marketing hybrid packages with leading aftermarket dashboards. This coopetition model preserves hardware standardization leverage for truck builders while satisfying fleets that demand analytics uniformity across diverse brands and model years.
By Vehicle Class: Heavy and Medium Trucks Face Regulatory Pressure
Light commercial platforms generated 48.89% revenue in 2025, reflecting their sheer numbers in parcel, service, and utility fleets. Heavy and medium trucks, however, are forecast to grow 15.17% annually because they attract higher per-unit telematics spend driven by electronic logging mandates and energy-management needs in electrified drivelines. The commercial vehicle telematics market for heavy tractors continues to expand as OEMs roll out battery-state-of-health dashboards, charger reservation tools, and over-the-air powertrain firmware updates that operators view as mission-critical.
Regulatory oversight of driver hours, weight compliance, and environmental footprints concentrates on heavy segments, making telematics non-optional. Light vans benefit from lower device price points and quick installations, yet their revenue intensity per vehicle is modest compared to a long-haul Class-8 tractor equipped with multiple cameras, advanced driver-assistance sensors, and 5G gateways. Consequently, vendors pursue margin by upselling premium analytics to heavy-duty operators even as they chase volume in light-duty delivery fleets.
By Communication Technology: Hybrid Architectures Hedge Coverage Gaps
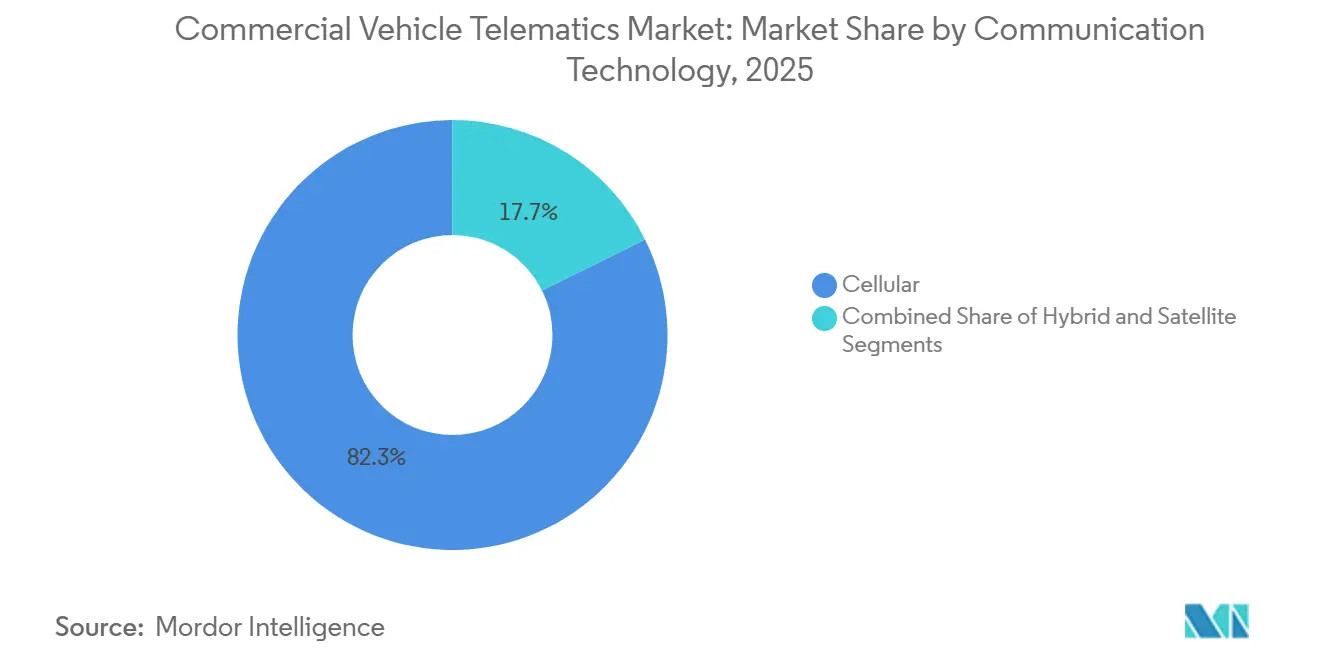
Cellular maintained an 82.33% share in 2025 thanks to ubiquitous 4G LTE, falling module costs, and competitive data-plan pricing. Hybrid solutions combining cellular with satellite or Wi-Fi backhaul are set to grow at a 15.38% CAGR as operators demand always-on visibility for safety-critical functions. The commercial vehicle telematics market share tied to hybrid modems will rise when fleets hauling high-value cargo cross deserts, mountains, or maritime routes where cellular coverage is intermittent.
5G rollouts in North America, Europe, and advanced Asia-Pacific economies promise sub-50 ms latency, enabling real-time video streaming and cooperative driving features. Yet rural blind spots persist, pushing fleets to specify dual-mode devices that automatically switch to satellite for exception alerts. Vendors partner with mobile network operators to aggregate traffic volumes and secure bulk airtime discounts, passing savings to fleets while protecting margins.

By End-User Vertical: Construction and Mining Adoption Accelerates
Transportation and logistics accounted for 39.63% demand in 2025, reflecting the sector’s early embrace of connectivity for routing and compliance. Construction and mining, though smaller, will post the fastest 16.19% CAGR to 2031 as off-highway equipment managers seek real-time utilization dashboards, fuel-burn analytics, and operator safety coaching. The commercial vehicle telematics market, tied to yellow-iron machinery, is expanding as quarry owners and contractors integrate engine-hour data with enterprise resource planning systems for preventive maintenance scheduling.
Retail and e-commerce fleets emphasize proof-of-delivery and customer notification workflows, while utilities leverage telematics for crew dispatch and hazardous-material compliance. Insurance and leasing firms embed devices to enable usage-based premium structures, aligning risk pricing with actual driving behavior. Public-sector emergency services deploy connectivity to optimize response times and asset allocation. The diversity of requirements encourages vendors to build vertical-specific templates and analytics modules that plug into a common cloud backbone.
Geography Analysis
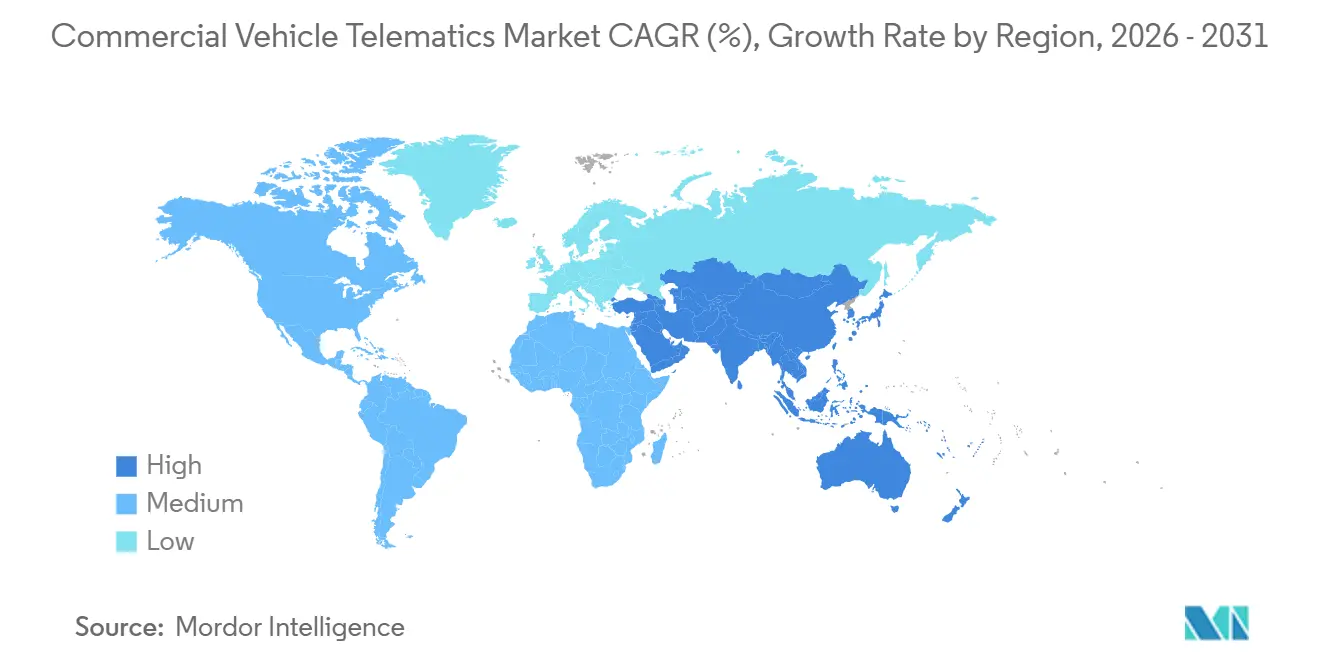
North America retained 34.66% of the commercial vehicle telematics market revenue in 2025, owing to strict hours-of-service enforcement and dense cellular coverage. Large enterprise haulers have largely completed rollouts, so incremental growth stems from municipal, postal, and small-fleet segments that sign managed-service deals rather than self-hosting software. The rising adoption of battery-electric delivery trucks, particularly in California compliance zones, is boosting demand for integrated energy-management dashboards that forecast range and direct drivers to charging stations. Cross-border carriers link United States, Canadian, and Mexican operations under unified compliance portals despite patchy rural coverage in northern Canada and southern Mexico.
Asia-Pacific carries the fastest 15.78% CAGR through 2031. China enforces connected-vehicle targets that compel OEMs to embed devices, while domestic logistics giants integrate telematics with warehouse automation and ride-hailing style freight platforms. India’s emergency-button and location-tracking mandate removes cost-sensitive barriers, pushing basic units into millions of trucks and buses. Japan combats driver shortages with route-optimization algorithms, and South Korea funds 5G-based smart logistics corridors. Rural coverage gaps and the prevalence of low-cost local suppliers temper average revenue per unit, but volume outweighs pricing headwinds, expanding total regional spend.
Europe combines mature adoption with stringent data privacy and cybersecurity rules. Digital tachograph stage-II upgrades, low-emission zones, and zero-emission truck incentives keep replacement cycles brisk. Operators increasingly purchase software-defined services that unlock enhanced analytics without swapping hardware, aligning with over-the-air update strategies from Volvo and Daimler. Growth moderates as large fleets complete full penetration, pushing vendors to upsell managed analytics and battery optimization modules tied to the commercial vehicle telematics market. Eastern European corridors offer white-space opportunities where road freight is rising, but connectivity penetration still trails Western averages.
South America, the Middle East, and Africa collectively post mid-teens growth from smaller bases. Brazil’s dense agribusiness corridors demand asset tracking across remote plantations, yet macro-economic volatility slows capital budgets. Gulf Cooperation Council states invest in smart-city freight initiatives that bundle telematics with automated tolling and green-zone enforcement. Africa’s challenge remains network coverage, although mining companies in South Africa and Botswana adopt satellite-linked units to manage high-value equipment. Government fleet-digitization programs across Egypt and Saudi Arabia spur public-sector uptake, providing anchor accounts for international vendors.

Regulatory Landscape
Regulation continues to convert telematics from a productivity tool into a compliance requirement across major freight corridors. In the United States, the Federal Motor Carrier Safety Administration (FMCSA) maintains the ELD rule framework and has reinforced device-level compliance by removing non-compliant devices from its registered list in July 2026, pushing carriers to replace impacted units by a stated September 8, 2026 deadline to avoid out-of-service exposure. In Europe and the United Kingdom, the Mobility Package-driven digital tachograph regime is expanding beyond heavy trucks into light commercial vehicles, with second-generation smart tachographs (G2V2) mandatory from July 1, 2026 for 2.5-3.5 tonne LCVs used in international transport or cabotage, increasing retrofit and data-handling requirements for cross-border operators.
Security and data-access policy is also shaping vendor selection and supply-chain choices. A January 16, 2025 final rule issued by the US Department of Commerce, Bureau of Industry and Security (BIS) targeted connected vehicle systems and explicitly called out telematics systems among the covered technology areas for restrictions tied to foreign adversaries, raising compliance diligence for hardware, software, and upstream components. In parallel, UNECE WP.29 cybersecurity requirements and ISO/SAE 21434-aligned programs are elevating cybersecurity, secure OTA update processes, and lifecycle patching into procurement criteria for OEM platforms and large fleets that need audit-ready controls.
Value Chain Analysis
The commercial vehicle telematics value chain spans component suppliers (GNSS, cellular/5G and satellite modems, sensors, cameras, and compute), device and firmware manufacturers, cloud platform providers, and service layers such as managed installation, compliance workflows, and analytics. OEMs increasingly ship factory-fit connectivity, which feeds proprietary OEM portals (for diagnostics and software updates) and also flows into independent platforms through APIs, as mixed-brand fleets standardize on a single operational dashboard. Mobile network operators remain critical upstream partners for coverage and pricing, while system integrators and resellers tailor deployments for regulated workflows (ELD/tachograph), safety programs, and back-office integrations with dispatch, maintenance, and ERP systems.
Downstream value capture is shifting toward software and services as platforms absorb adjacent workflows such as video safety, maintenance triage, and asset tracking. Product cycles show the chain moving toward AI-ready, higher-integrity data pipelines, for example with new device families and AI video safety hardware introduced by Geotab in 2026, alongside workflow automation features introduced by Samsara in 2026. Insurance and leasing are also built into the delivery model, with incident data and continuous risk signals from ELD and camera-enabled telematics increasingly connecting fleets, platforms, and underwriters through integrated programs, reinforcing recurring subscription economics and marketplace-style ecosystems where third parties (for example, insurance telematics specialists) plug into established platforms.
Competitive Landscape
The commercial vehicle telematics market is moderately fragmented. Independent platform leaders such as Geotab, Samsara, and Trimble compete with telecom-backed Verizon Connect and OEM captives from Daimler, Volvo, and TRATON. Geotab’s integration with Daimler Trucks exemplifies hybrid ecosystems where aftermarket dashboards surface proprietary OEM diagnostics inside a common interface. Samsara grows enterprise accounts by pairing AI dashcams with driver-coaching workflows, recording USD 300 million revenue in calendar 2025. Verizon Connect leverages its parent’s network assets to bundle airtime, devices, and analytics into turnkey contracts, challenging smaller specialists on price and coverage quality.
Strategic moves concentrate on three fronts. First, vertical integration: Lytx merges video safety with telematics to offer unified risk scoring, and GPS Trackit absorbs Zonar Systems to combine inspection tools with tracking. Second, horizontal expansion: platforms add support for trailers, forklifts, and refrigerated containers, widening wallet share per fleet. Third, ecosystem orchestration: open APIs invite insurers, maintenance software vendors, and fuel card providers to build apps that leverage telematics data, embedding the host platform at the operational core of fleet customers.
White-space opportunities include energy-management telemetry for battery-electric and hydrogen trucks, cargo-centric trailer tracking, and anonymized data exchanges that sell road-condition information to mapping companies and city planners. Compliance with ISO/SAE 21434 cybersecurity standards is turning into a ticket-to-play for Tier-1 OEM partnerships, separating well-capitalized vendors from smaller entrants. Price competition remains fiercest in North America and Europe, but Asia-Pacific’s fragmented regulatory landscape allows local firms to thrive on country-specific compliance features, forcing multinationals to localize software rapidly.
Commercial Vehicle Telematics Industry Leaders
Verizon Communications Inc.
Geotab Inc.
Samsara Inc.
Trimble Inc.
Powerfleet Inc.
- *Disclaimer: Major Players sorted in no particular order

Market Opportunities and Future Outlook
Compliance-driven replacement and retrofit programs are creating near-term whitespace in regulated segments that have not historically carried heavy-duty grade compliance hardware. The July 1, 2026 expansion of the EU and UK smart tachograph G2V2 requirement to 2.5-3.5 tonne light commercial vehicles engaged in international transport or cabotage creates new demand for installation capacity, compliant devices, and analytics that translate tachograph data into operational planning for fleets that previously relied on lighter tracking tools. In the United States, FMCSA actions to remove non-compliant ELDs from the registered list (July 2026) increase carrier focus on vendor due diligence, device certification status, and managed replacement programs, favoring suppliers that can bundle hardware, connectivity, and compliance reporting with minimal downtime.
Interoperability and AI workflow automation are also widening opportunities for product and partner relationships beyond basic tracking. The EU introduced a March 2026 delegated regulation framework aimed at standardized, bi-directional access to in-vehicle data streams for independent operators, supporting business models that aggregate OEM and aftermarket feeds into unified fleet operations. On the technology side, 2026 launches and alliances point to expanding demand for AI-ready data integration and agent-like tools: Geotab released a Model Context Protocol (MCP) connector in June 2026 to integrate fleet data into AI platforms, and formed a global alliance with Toyota Connected in June 2026 to ingest vehicle data more directly into its ecosystem. Safety and coaching platforms are shifting from alerts to automated workflows, with vendors such as Samsara and Netradyne announcing AI-driven maintenance and safety automation capabilities in 2026, which expands addressable spend per vehicle as fleets consolidate safety, compliance, maintenance, and asset visibility into fewer platforms.
Recent Industry Developments
- July 2026: Verizon Communications announced a collaboration with KDDI to provide 5G Standalone and LTE connectivity for newly manufactured BMW Group vehicles in the United States. The deal reinforces telecom-backed positioning in embedded connectivity and creates a stronger channel for connected-vehicle services that underpin telematics features and in-vehicle data access.
- June 2026: Geotab announced a global business alliance with Toyota Connected to integrate vehicle connectivity platforms with Geotab’s telematics and AI data ecosystem, including the introduction of G-Fleet+. The move strengthens OEM-data ingestion at scale and supports fleet operators that want factory-sourced data without relying solely on aftermarket black-box installations.
- October 2025: Lytx announced the general availability of Lytx+ with Geotab GO Anywhere, integrating its video safety platform with Geotab hardware for unified driver behavior analytics. The integration expands the combined value proposition of video safety and telematics, helping fleets consolidate tools and standardize reporting across safety, compliance, and coaching workflows.


Research Methodology Framework and Report Scope
Market Definition and Coverage
For this report, the market covers telematics used in commercial vehicles to collect, transmit, and use vehicle and driver data for operations like tracking, safety, maintenance, and compliance, including the related platforms and services that make the data usable.
Scope exclusions: We exclude consumer passenger car telematics and infotainment-only connectivity when it is not used for commercial fleet operations.
Segmentation Overview
- By Offering
- Solutions
- Fleet Tracking and Monitoring
- Driver Management
- Insurance Telematics
- Safety and Compliance
- V2X Solutions
- Predictive Maintenance and Diagnostics
- Asset and Trailer Tracking
- Services
- Professional Services
- Managed Services
- Solutions
- By Provider Type
- Original Equipment Manufacturer
- Aftermarket
- By Vehicle Class
- Light Commercial Vehicles
- Heavy and Medium Commercial Vehicles
- By Communication Technology
- Cellular
- Satellite
- Hybrid
- By End-User Vertical
- Transportation and Logistics
- Construction and Mining
- Public Sector and Emergency Services
- Utilities
- Insurance and Leasing
- Retail and E-Commerce
- Other End-User Verticals
- By Geography
- North America
- United States
- Canada
- Mexico
- South America
- Brazil
- Argentina
- Rest of South America
- Europe
- United Kingdom
- Germany
- France
- Italy
- Rest of Europe
- Asia Pacific
- China
- Japan
- India
- South Korea
- Rest of Asia Pacific
- Middle East and Africa
- Middle East
- United Arab Emirates
- Saudi Arabia
- Rest of Middle East
- Africa
- South Africa
- Egypt
- Rest of Africa
- Middle East
- North America
Data Sources, Market Sizing, and Validation
Desk Research
Desk work started with building a clean view of the addressable commercial vehicle fleet and regulation-driven adoption. We used public sources such as the US DOT and FMCSA updates (including compliance themes), Eurostat transport indicators, UNECE vehicle and safety frameworks, and ITU connectivity statistics to understand the enabling network layer and device standards.
We also reviewed company filings, investor presentations, product documentation, and reputable press coverage to map how offerings are packaged and monetized (hardware, software subscriptions, and managed services). In parallel, we used paid database subscriptions for company financials and news screening, and patent databases to see where innovation focus was shifting (for example, video telematics, safety scoring approaches, and predictive maintenance). The desk research sources listed above are illustrative, and many other public and paid references were used to collect data, validate assumptions, and clarify open questions.
Primary Interviews and Surveys
Primary work was used to pressure-test what was learned from public sources, especially around pricing, attach rates, and replacement cycles. We spoke with a mix of telematics solution providers, connectivity and device ecosystem participants, fleet operators, and channel partners across major geographies so the model reflects how fleets actually buy and renew services in practice.
Distribution of primary research fieldwork respondents
| Company type | Respondent position | Region |
|---|---|---|
| Top tier: 38% | CXOs: 12% | APAC: 46% |
| Mid tier: 43% | Functional/Unit leaders: 30% | EMEA: 29% |
| Smaller Players: 19% | Managers: 58% | Americas: 25% |
Market-Sizing & Forecasting
The sizing model starts with a top-down build that reconstructs the demand pool from the commercial vehicle parc, the share of connected fleets, and the typical revenue per vehicle tied to subscriptions and service bundles. Once the demand pool is framed, we cross-check it with selective bottom-up approximations, such as sampled provider revenue splits, channel checks on device shipments, and ASP multiplied by active subscriptions, and then totals are adjusted when mismatches persist.
Key inputs used in the model include the active commercial vehicle fleet by region, telematics penetration and retrofit rates, average subscription pricing by fleet size, replacement cycles for hardware, and compliance-driven adoption triggers (for example, electronic logging and safety programs). Because pricing and adoption do not move in a straight line, scenario analysis was used for forecasting. Variables like fuel costs, freight activity, connectivity coverage, and regulation enforcement were stress-tested using feedback from interviews. Where bottom-up datapoints were missing for smaller countries and niche vehicle classes, we filled gaps using region-level penetration proxies and then normalized results back to vehicle parc totals so the outputs stayed internally consistent.
Data Validation & Update Cycle
Model outputs were triangulated against independent signals like connected vehicle subscriptions, commercial vehicle production and parc trendlines, and reported recurring revenue patterns from representative suppliers. When variances looked unusual, the assumptions were revisited, and follow-up calls were triggered to re-check pricing ladders, renewal behavior, and the split between hardware and service revenues.
Before sign-off, a multi-step analyst review is run to confirm that regional roll-ups match global totals, growth rates align with adoption logic, and currency conversions use consistent timing. Reports are refreshed annually, and interim updates are made when material events occur, such as major regulation changes or sharp shifts in vehicle demand. Right before delivery, we perform a fresh scan so clients receive an up-to-date view.
Mordor Intelligence's Commercial Vehicle Telematics Market Size Compared Against Other Published Estimates
Published market sizes for commercial vehicle telematics often do not match because different studies draw the boundary around different revenue streams, vehicle classes, and what counts as an active subscription. Timing also matters, since some estimates use an earlier base year, and others convert currencies using different average rates.
By tracking installed base and active subscription assumptions and refreshing them through primary checks, Mordor Intelligence keeps the 2025 value aligned to recurring service revenue plus directly related platform and device revenues, rather than mixing in broader connected-vehicle or passenger telematics pools.
Benchmark comparison
| Source | Market Size | Gaps in Research Methodology |
|---|---|---|
| Mordor Intelligence | USD 18.47 B (2025) | |
| Trade Journal A | USD 5.20 B (2023) | Uses an earlier base year and typically centers on service revenue and active subscriptions, which can undercount hardware, platform fees, and newer use cases that expanded post-2023. |
| Industry Brief B | USD 21.19 B (2026) | Anchors the current market to the first forecast year, which shifts the starting value upward when penetration and ASP uplift are assumed to accelerate immediately, especially in high-growth regions. |
The spread in values is mainly explained by which year is treated as the starting point and whether the scope captures only services or the full telematics revenue stack linked to commercial fleets. With clear scope rules, repeatable adoption variables, and checks that tie back to fleet and subscription realities, the final number stays easier to audit and more stable for planning.


Key Questions Answered in the Report
What is the projected value of the commercial vehicle telematics market by 2031?
It is forecast to reach USD 42.08 billion by 2031, supported by a 14.71% CAGR over 2026-2031.
Which region is expanding fastest in connected fleet solutions?
Asia-Pacific leads with a 15.78% CAGR as China and India roll out connected-vehicle mandates.
Why are services outpacing hardware sales in fleet telematics?
Operators prefer subscription models that bundle devices, connectivity, and analytics, driving services at a 15.11% CAGR.
How do OEM and aftermarket platforms differ for fleet managers?
OEM systems offer deep vehicle integration, while aftermarket solutions deliver brand-agnostic analytics and faster feature updates.
What role does telematics play in zero-emission trucking?
It monitors battery health, optimizes charging schedules, and ensures range reliability, making connectivity core to electric truck operations.
Which vertical shows the strongest growth potential?
Construction and mining is set to expand 16.19% annually as off-highway equipment adopts predictive maintenance and utilization analytics.
Page last updated on:






