
Commercial Security Robot Market Size and Share
Market Overview
| Study Period | 2020 - 2031 |
|---|---|
| Market Size (2026) | USD 4.12 Billion |
| Market Size (2031) | USD 9.33 Billion |
| Growth Rate (2026 - 2031) | 17.75 % |
| Fastest Growing Market | Asia Pacific |
| Largest Market | North America |
| Market Concentration | Medium |
Major Players *Disclaimer: Major Players sorted in no particular order Image © Mordor Intelligence. Reuse requires attribution under CC BY 4.0. | |
Commercial Security Robot Market Analysis by Mordor Intelligence
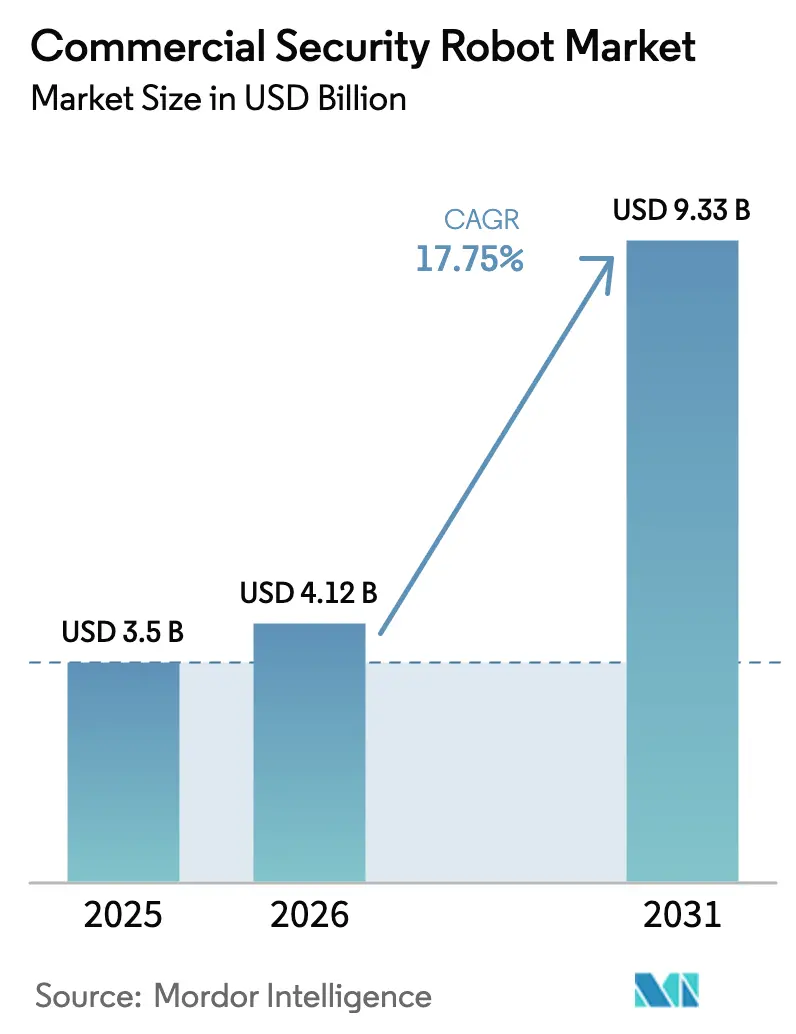
The commercial security robot market size was valued at USD 3.5 billion in 2025 and estimated to grow from USD 4.12 billion in 2026 to reach USD 9.33 billion by 2031, at a CAGR of 17.75% during the forecast period (2026-2031). Falling LiDAR prices, longer-lasting batteries, and an increase in security breaches at critical facilities are prompting enterprises to transition from fixed cameras and human patrols to mobile, autonomous platforms. Insurers now grant premium discounts to sites protected by certified robotic guards, which shortens payback periods and improves return on investment. Municipal green-finance rules increasingly reward low-carbon patrol technologies, so many public agencies treat robots as a sustainability measure rather than a pure security spend. Finally, private 5G rollouts enable ultra-low-latency fleet coordination, expanding the addressable use cases of the commercial security robot market across large campuses and multi-site operations.
Key Report Takeaways
- By robot type, wheeled ground units held a 40.45% share of the commercial security robot market in 2025, whereas aerial security drones are forecast to grow at a 20.89% CAGR through 2031.
- By end user, commercial buildings led with 22.05% revenue share in 2025; public infrastructure and smart city projects are expected to expand at a 19.12% CAGR through 2031.
- By component, hardware accounted for 58.15% of the commercial security robot market size in 2025, while software and services are projected to advance at a 21.34% CAGR.
- By autonomy level, autonomous platforms captured 63.10% share of the commercial security robot market size in 2025 and are projected to post a 18.76% CAGR by 2031.
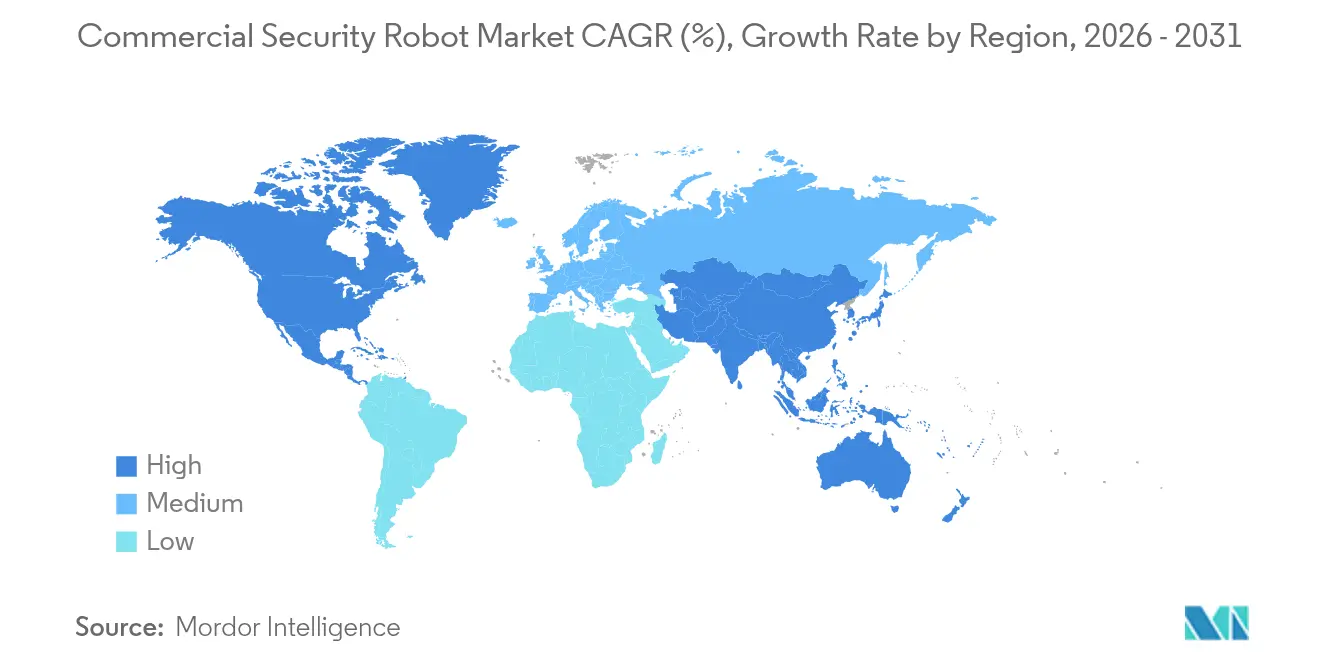
- By geography, North America dominated with a 35.85% share in 2025; the Asia-Pacific region is set to record the fastest growth, with a 19.65% CAGR through 2031.
Note: Market size and forecast figures in this report are generated using Mordor Intelligence’s proprietary estimation framework, updated with the latest available data and insights as of 2026.
Market Trends and Insights
Drivers Impact Analysis of Commercial Security Robot Market*
| DRIVER | (~) % IMPACT ON CAGR FORECAST | GEOGRAPHIC RELEVANCE | IMPACT TIMELINE |
|---|---|---|---|
| Rising adoption of autonomous patrol robots for perimeter security | +4.8% | Global; early uptake in North America and Europe | Medium term (2-4 years) |
| Declining cost of Li-DAR and battery technologies | +3.2% | Global; manufacturing centered in Asia-Pacific | Short term (≤ 2 years) |
| Surge in security breaches at critical infrastructure and public venues | +3.9% | Global; heightened in North America and Europe | Short term (≤ 2 years) |
| Insurance-premium incentives for certified robotic guards | +2.1% | North America and Europe, expanding to Asia-Pacific | Medium term (2-4 years) |
| ESG-linked financing favoring low-carbon robotic security | +1.8% | Global; led by Europe | Long term (≥ 4 years) |
| Private 5G networks enabling ultra-low latency robot fleets | +2.4% | Asia-Pacific core, spill-over to North America | Medium term (2-4 years) |
| Source: Mordor Intelligence | |||
Rising Adoption of Autonomous Patrol Robots for Perimeter Security
Security teams increasingly deploy autonomous patrol robots to fill blind spots that fixed cameras and roving guards struggle to cover. Asylon’s DroneDog-2 combines quadruped mobility with dock-launched drones, extending surveillance to multilevel terrains and rooftops.[1] SMP Robotics proved outdoor resilience when its S5.2 platform maintained 99.2% uptime during harsh-weather pilots in 2024.[2]Integrated thermal imaging, paired with AI object detection, now identifies intruders beyond 500 meters, effectively raising the perimeter without requiring additional towers or cables. RAD’s ROAMEO Gen 4 layers predictive analytics onto patrol data, alerting operators before a potential breach occurs rather than after an alarm trips. These autonomous capabilities can reduce guard headcount while maintaining 24/7 coverage, a proposition that resonates in large industrial parks and energy assets, where staffing is costly.
Declining Cost of LiDAR and Battery Technologies
Solid-state LiDAR modules have seen a significant drop in price since 2024, as photonics integration and MEMS manufacturing have reached scale. Lower sensor costs make millimeter-level mapping affordable for mid-tier users who once relied on basic ultrasonic collision pairs. Parallel improvements in lithium-ion chemistry now yield 12-hour duty cycles for wheeled robots, removing frequent charging as an operational bottleneck. Vendors are already field-testing solid-state batteries that promise longer runtimes and lower fire risk in indoor deployments. Predictive battery-management software can flag degradation 30 days in advance, allowing planned swaps during lulls instead of emergency shut-offs. Together, cheaper perception and longer endurance widen the commercial security robot market’s pool of viable buyers beyond blue-chip campuses.
Surge in Security Breaches at Critical Infrastructure and Public Venues
The U.S. Cybersecurity and Infrastructure Security Agency reported a rise in physical security incidents at critical sites in 2024.[3] Airports, utilities, and data centers now face blended threats where cyber actors use physical access to plant network implants. Homeland Security guidelines urge 24/7 automated monitoring, positioning robots as force multipliers that never tire. Early trials with the Transportation Security Administration have shown that robots reduce false alarms in baggage halls compared to static camera analytics, freeing agents for higher-value tasks. Scalability is another edge: fleets can surge during elevated threat periods without the logistical hurdles of onboarding temporary guards.
Insurance-Premium Incentives for Certified Robotic Guards
Major underwriters recognize lower incident rates when autonomous patrols document every interaction, as this provides a more comprehensive view of the situation. Zurich Insurance offers premium discounts of 15–25% to facilities that meet the ISO 3691-4 robotic guard standards. SOMPO Holdings introduced blended-coverage policies that combine robot hardware, liability, and cyber intrusion clauses into a single package, streamlining procurement for risk managers. Munich Re’s actuarial models now rate robot-equipped sites as lower exposures, resulting in more favorable deductibles. For high-value warehouses and distribution hubs, these incentives can shave millions from annual risk budgets, accelerating the commercial security robot market’s penetration into price-sensitive verticals.
Restraints Impact Analysis of Commercial Security Robot Market*
| RESTRAINT | (~) % IMPACT ON CAGR FORECAST | GEOGRAPHIC RELEVANCE | IMPACT TIMELINE |
|---|---|---|---|
| High upfront CAPEX and lifecycle OPEX | -2.8% | Global; acute in cost-sensitive markets | Short term (≤ 2 years) |
| Data privacy and AI liability concerns | -1.9% | Europe and North America; spreading worldwide | Medium term (2-4 years) |
| Vandalism and tampering risk raises TCO | -1.4% | Urban sites globally | Medium term (2-4 years) |
| Edge-AI robustness limits in extreme weather | -1.2% | Harsh-climate regions | Long term (≥ 4 years) |
| Source: Mordor Intelligence | |||
High Upfront CAPEX and Lifecycle OPEX
Full-site security robot deployments can cost USD 150,000–500,000, a hurdle for mid-sized enterprises lacking large capital budgets. Annual upkeep, including sensor calibration, software licensing, and drivetrain maintenance, typically accounts for 25-30% of the purchase price, complicating ROI models. When iRobot secured a USD 200 million term loan in 2024, lenders priced it at an interest rate above 9%, underscoring the perceived operational risk in robotics ventures.[4] Leasing and robotics-as-a-service contracts offer alternatives; however, some buyers hesitate due to long-term commitments and performance guarantees. Until hardware prices fall further or financial products mature, CAPEX remains the most immediate drag on the commercial security robot market.
Data-Privacy and AI-Liability Concerns
Europe’s AI Act mandates risk assessments and human oversight for high-risk systems, including autonomous security robots. Operators must demonstrate compliance with GDPR when facial recognition captures personally identifiable information, a tall order in open public spaces. Vendors now embed privacy-by-design features, such as on-edge redaction and opt-in data retention, to reassure regulators; yet, legal clarity remains unfinished business.
*Our forecasts treat driver/restraint impacts as directional, not additive. The impact forecasts reflect baseline growth, mix effects, and variable interactions.
Commercial Security Robot Market Segment Analysis
By Robot Type:
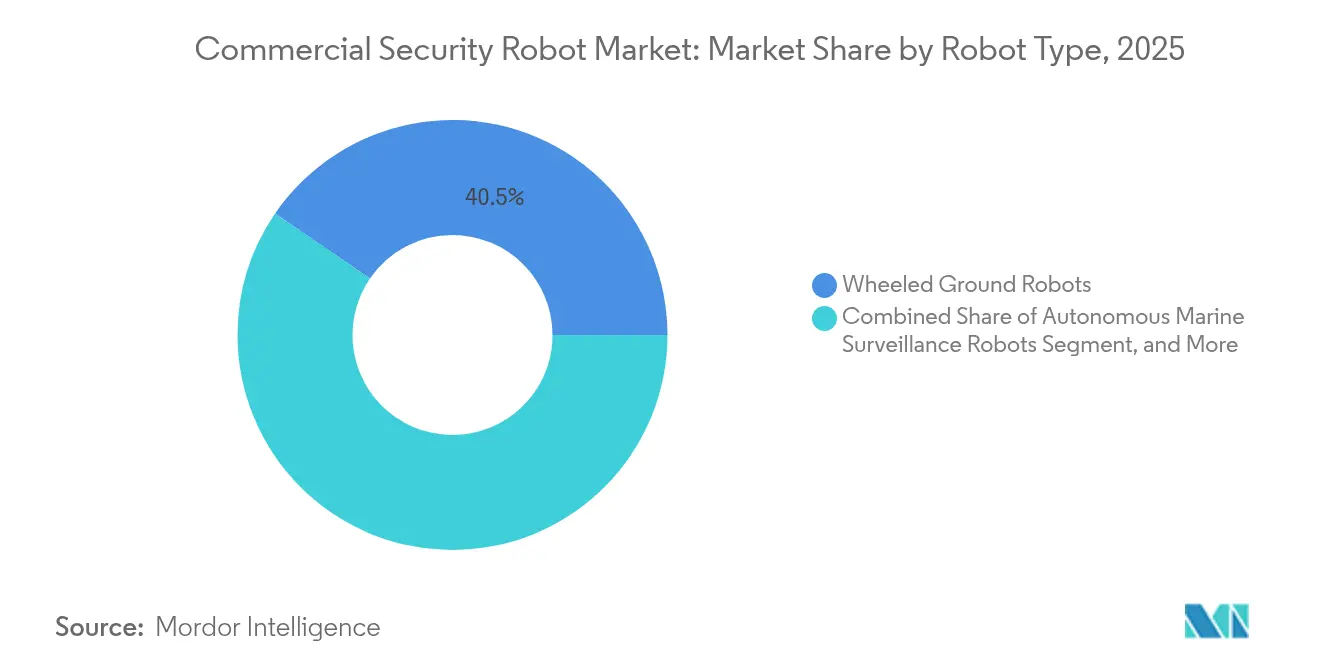
Versatile Platforms Redefine CoverageGround robots held a 40.45% share of the commercial security robot market in 2025, cementing their role as baseline perimeter guardians that navigate paved paths and corridors without structural retrofits. Aerial security drones, however, are flying ahead with a projected 20.89% CAGR as private 5G enables split-second path updates and multi-drone swarming.
Legged and hybrid robots such as Boston Dynamics’ Spot prove valuable in sites with stairs, catwalks, or uneven terrain, areas where wheels struggle. Autonomous marine surveillance units, though niche, protect ports and offshore infrastructure where human patrols are cost-prohibitive. Cross-platform orchestration dashboards now allow command centers to task ground, air, and marine units from a single console, making mixed-fleet deployments feasible. Edge AI reduces bandwidth requirements, allowing even remote sites with limited backhaul to deploy intelligent patrols.

By End User:
Infrastructure Investment Fuels UptakeCommercial buildings accounted for 22.05% of 2025 revenue, primarily driven by corporate campuses and shopping centers that prioritize visible deterrence and continuous patrol logs. Yet, public infrastructure projects, such as airports, transit hubs, and city centers, are on track for a 19.12% CAGR as municipalities embed robots into smart-city sensor grids. The commercial security robot market size allocated to government contracts is growing as stimulus funds target resilience upgrades following high-profile attacks.
Industrial and logistics facilities utilize robots to inspect perimeter fencing and loading docks in conjunction with warehouse automation workflows. Healthcare campuses adopt privacy-sensitive patrol bots that also serve as telepresence emergency aids, an attractive dual function amid nurse shortages. Integration with building-management systems triggers automatic door lockdowns or HVAC isolation when robots confirm a threat, demonstrating value beyond pure observation.
By Autonomy Level:
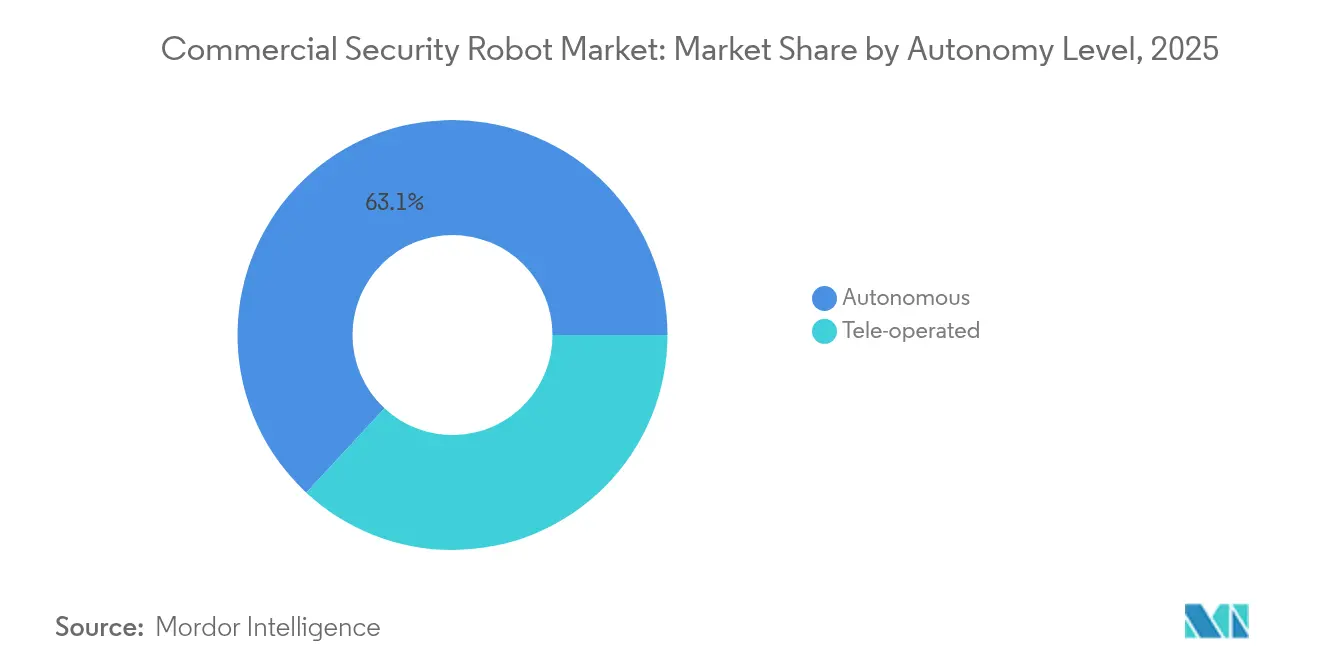
AI Supremacy Gains GroundAutonomous systems accounted for 63.10% of the 2025 volume, and their 18.76% CAGR indicates rising confidence in unsupervised navigation algorithms. Private 5G slices lower latency to under 10 milliseconds, supporting real-time coordination among dozens of units and enabling teleoperation to edge into specialist niches. In the commercial security robot market, tele-operated models persist in nuclear plants or prison yards where policy demands human decision-making for engagement.
Natural-language interfaces powered by large language models enable guards to redirect a robot via speech, thereby closing the usability gap between autonomy and oversight. Swarm intelligence enables fleets to self-assign patrol zones based on heat-map risk scores, thereby boosting coverage without requiring additional units. Edge computing keeps core threat-detection models local, ensuring that robots continue to function even if cloud links fail a critical specification in disaster response plans.
By Component:
Software Drives Lifetime ValueHardware contributed 58.15% of revenue in 2025, but software and services are climbing at 21.34% CAGR as customers pay subscription fees for analytics, cybersecurity hardening, and predictive maintenance. Commercial security robot market share trends indicate that software revenues will overtake hardware by the end of the decade. AI vision modules can be updated over the air, elevating performance without requiring sensor replacements, which extends asset life cycles.
Open APIs facilitate seamless integration with access control panels, fire alarms, and visitor management kiosks, thereby creating a unified security stack. Cyber-hygiene services patch firmware vulnerabilities before threat actors can hijack robots as moving attack vectors. Predictive-maintenance dashboards use vibration and thermal data to forecast drivetrain failures, scheduling fixes during planned downtime and cutting service calls by 30%. As recurring revenue grows, vendors pivot toward software-as-a-service valuation models favored by investors.
Geography Analysis
North America Commercial Security Robot Market
North America dominates the commercial security robot market, accounting for 35.85% of the revenue in 2025, thanks to early enterprise pilots and a robust robotics investment pipeline. Major airports and third-party logistics centers validate robots for perimeter patrols and baggage-hall analytics, creating reference success stories that shorten procurement cycles. Venture capitalists cluster around Boston and Silicon Valley, providing startups with rapid prototyping resources and channel partnerships.
APAC Commercial Security Robot Market
Asia-Pacific registers the steepest 19.65% CAGR to 2031, led by government smart-city mandates in China and 5G-enabled test corridors in South Korea. Singapore’s regulatory sandboxes fast-track commercial trials, while Japan subsidizes automation grants to mitigate labor shortages. Regional supply-chain advantages in sensors and printed circuits lower bill-of-material costs, making mid-tier robots price-competitive for smaller property managers.
Europe and Middle East Commercial Security Robot Market
Europe balances opportunity with regulation: GDPR and the AI Act prolong sales cycles, yet vendors that pass conformity assessments gain a barrier to entry over less-compliant rivals. The Netherlands’ EUR 100 million SecFund channels capital to dual-use security robotics, and Germany’s Industry 4.0 initiatives extend their reach into manufacturing showrooms. Meanwhile, Middle East energy exporters are procuring robots for pipeline surveillance in remote deserts, where human patrols are impractical, illustrating adoption beyond urban centers.
Regulatory Landscape
Commercial security robots sit across overlapping safety, privacy, cybersecurity, and public-procurement rules that vary by region and deployment context. In Europe, the EU AI Act introduces risk-management and human-oversight expectations for high-risk systems. Where deployments capture personally identifiable information, such as facial imagery, they must align with GDPR requirements, which can extend procurement and conformity workflows for public-venue use cases.
In the United States, there is no single OSHA robotics standard specific to commercial security robots, but OSHA points to consensus approaches and general industrial robot safety frameworks such as ANSI/RIA R15.06 for baseline safety practices. Federal procurement and cybersecurity compliance are increasingly treated as gate checks for enterprise and government adoption, highlighted by Knightscope achieving full FedRAMP Authorization (ATO) for its autonomous security robot in February 2025. Separately, 2026 federal legislative proposals, including the American Security Robotics Act of 2026 (H.R. 8189, S. 4235) and the Guarding the U.S. against Adversarial Robotics Dominance Act of 2026 (H.R. 9129), indicate heightened scrutiny of foreign-linked robotics systems and communications equipment for government use.
Value Chain Analysis
The commercial security robot value chain runs from upstream sensors (LiDAR, thermal and RGB cameras, microphones) to locomotion and power subsystems (drivetrains, batteries, docking and charging), onboard compute (edge AI modules), and the software layers that convert autonomy into security outcomes (perception models, mapping, fleet orchestration, incident workflows, and integrations into access control and video management systems). As deployments shift from pilots to multi-site rollouts, cybersecurity hardening and compliance artifacts, such as cloud authorization packages for government and regulated industries, are increasingly treated as part of the core product rather than an add-on.
On the downstream side, systems integration, deployment engineering, monitoring, and maintenance shape customer experience and lifetime value. Robotics-as-a-service and managed-service models bundle hardware, software subscriptions, and remote operations into a recurring fee structure (for example, wheeled security robot services commonly cited at roughly USD 7 to USD 11 per hour in service pricing), moving purchasing from CAPEX toward OPEX for many facilities. Platform dynamics also affect how value is captured, with hyperscalers (Amazon, Google, and Microsoft) active through partnerships and acquisitions around fleet-management and AI tooling, while vendors and partners extend capabilities through third-party application ecosystems layered on top of standardized robot hardware.
Competitive Landscape
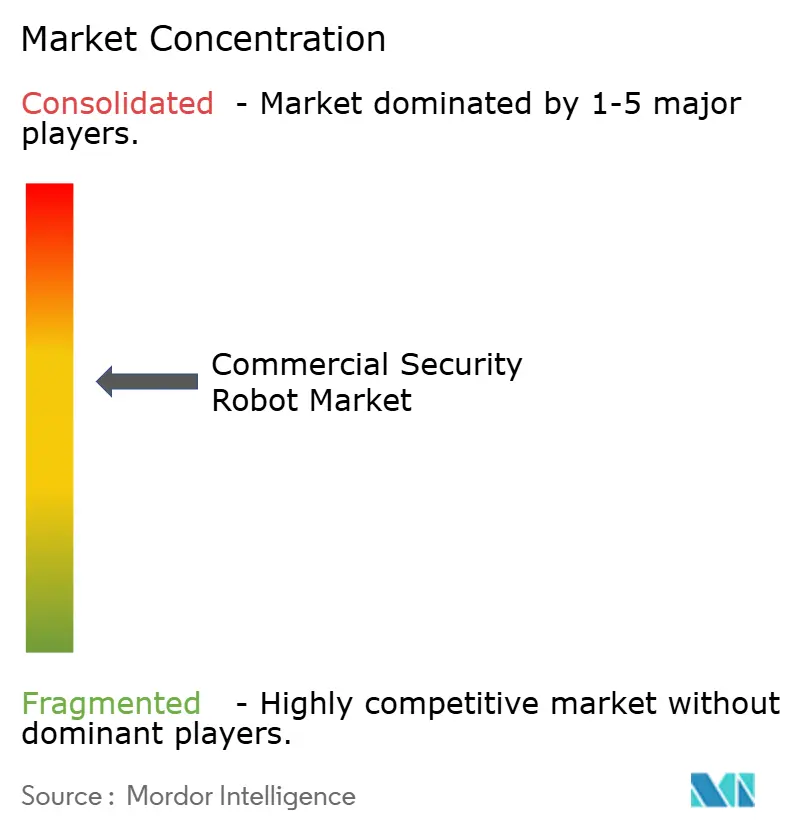
Market concentration is at a moderate level, as established players consolidate their share through multi-year deployment records and vertically integrated service bundles. Knightscope’s public listing in 2024 expanded capital for research and development while sharpening its focus on subscription business models. Boston Dynamics diversified from warehouse picking into security patrols by pairing Stretch logistics robots with Spot inspection units, marketing an end-to-end autonomy suite.
Edge-AI specialists disrupt incumbents by offering form-factor-agnostic software that can retrofit older robots, extending fleet life and reducing lock-in. Traditional guarding firms partner with robotics vendors to bundle technology with on-site personnel for hybrid security contracts, blurring competitive lines. Hardware differentiation is receding as vendors emphasize the accuracy of analytics, the depth of integration, and cybersecurity safeguards over raw sensor counts.
Acquisitions shape the field: Amazon’s attempted purchase of iRobot signaled big-tech appetite for autonomous middleware, even as regulatory scrutiny stalled the deal. Smaller startups pivot toward niche sectors, such as healthcare, education, or maritime, and dodge head-to-head battles with giants. The commercial security robot market rewards providers that can demonstrate reliability across seasons, deliver quantifiable ROI, and navigate a complex patchwork of regional privacy laws.
Commercial Security Robot Industry Leaders
-
Knightscope, Inc.
-
Cobalt Robotics, Inc.
-
SMP Robotics Systems Corp.
-
Secom Co., Ltd.
-
Johnson Controls International plc
- *Disclaimer: Major Players sorted in no particular order
Commercial Security Robot Market Companies Covered in this Report
- Knightscope, Inc.
- SMP Robotics Systems Corp.
- Cobalt Robotics, Inc.
- Ava Robotics, Inc.
- Nordic Unmanned ASA
- Turing Video, Inc.
- Secom Co., Ltd.
- Guardforce AI Co., Ltd.
- Guangzhou Gosuncn Robot Co., Ltd.
- Zhejiang Uniview Technologies Co., Ltd.
- Ademco Security Group Pte. Ltd.
- Boston Dynamics, Inc.
- Johnson Controls International plc
- Milrem Robotics OÜ
- OMRON Corporation
- Enryu Co., Ltd.
- Skytron Energy Robotics GmbH
- RoboTiCan Ltd.
- Ascent Robotics, Inc.
- DroneSec Pty Ltd.
- SMP Robotics Solutions, LLC
Market Opportunities and Future Outlook
Near-term whitespace is in turning robots from standalone patrol units into operational security infrastructure that fits inside enterprise workflows, including alarm verification, access-control events, incident ticketing, and remote operator handoffs. Deployments that combine heterogeneous platforms, such as ground robots paired with aerial drones, widen the coverage envelope for logistics and industrial sites that need rapid situational awareness beyond fixed cameras; Asylon markets combined ground-and-drone perimeter monitoring for logistics and transportation security applications. This integration-led approach supports larger-scale rollouts, since operators can standardize response playbooks across multiple sites while relying on autonomy for routine coverage.
Compliance-ready security robotics also offers a clearer path for regulated buyers that treat cybersecurity and auditability as procurement prerequisites. Knightscope obtaining full FedRAMP Authorization (ATO) in February 2025 is one example of how federal-grade cloud and security controls can open new buyer segments and influence vendor roadmaps beyond government, including critical infrastructure and healthcare organizations that typically require similar controls. Separately, fleet intelligence, such as AI route re-optimization and centralized orchestration, gives vendors and service providers a way to manage double-digit robot fleets without proportional increases in dispatch labor, supporting multi-site contracts and lifting software and services attach.
Recent Industry Developments in Commercial Security Robot Market
- March 2026: SMP Robotics Systems Corp. commenced shipments of the Argus S5.4 autonomous mobile robot featuring NVIDIA Jetson Orin NX for edge AI applications and third-party software integration. The launch expands the hardware and software ecosystem and reinforces platform-agnostic automation capabilities.
- February 2026: Knightscope, Inc. announced over $2 million in new and recurring contracts for ASR units and remote monitoring packages across residential, commercial real estate, and healthcare sectors. The contract awards for autonomous security robots strengthen revenue visibility and ROI case for deployments across multiple verticals.
- November 2025: Knightscope, Inc. unveiled the K7 Autonomous Security Robot, an outdoor perimeter solution with early production deployment scheduled for the second half of 2026. The new outdoor perimeter robot platform broadens the product line and near-term deployment footprint.
Commercial Security Robot Market Report Scope and Research Methodology
Market Definition and Coverage
For this methodology, the commercial security robot market is defined as revenue generated from robots used by non-military customers to conduct security and surveillance tasks in commercial and public facilities, where the robot platform and its security-oriented software are part of the offering.
Scope exclusions: consumer home security robots and strictly military or battlefield robots are excluded from this market sizing.
Segments Covered in This Report
- By Robot Type
- Wheeled Ground Robots
- Specialized / Premium Platforms (Legged + Hybrid)
- Aerial Security Drones
- Autonomous Marine Surveillance Robots
- By End User
- Commercial Buildings
- Industrial and Logistics Facilities
- Retail and Shopping Malls
- Airports and Transportation Hubs
- Public Infrastructure and Smart City
- By Autonomy Level
- Autonomous
- Tele-operated
- By Component
- Hardware
- Software and Services
- By Geography
- North America
- United States
- Canada
- Mexico
- South America
- Brazil
- Argentina
- Rest of South America
- Europe
- Germany
- United Kingdom
- France
- Italy
- Spain
- Russia
- Rest of Europe
- Asia-Pacific
- China
- Japan
- India
- South Korea
- South-East Asia
- Rest of Asia-Pacific
- Middle East and Africa
- Middle East
- Saudi Arabia
- United Arab Emirates
- Rest of Middle East
- Africa
- South Africa
- Egypt
- Rest of Africa
- Middle East
- North America
Data Sources, Market Sizing, and Validation
Desk Research
Desk research was used to set clear market boundaries and to build the first layer of inputs that can be checked against public records. We relied on official and non-paywalled sources such as U.S. Bureau of Labor Statistics (security guard employment and wages), International Federation of Robotics (robot adoption signals), ISO and IEC standards references for safety and robotics, and public procurement portals that show how security services and equipment are typically contracted.
Alongside that, we reviewed company annual reports, regulatory filings, investor presentations, and reputable press coverage to understand pricing approaches like robot-as-a-service and typical deployment settings such as campuses, warehouses, retail, and transportation hubs. For cross-checking company scale and patent activity, we also used paid subscriptions for company financials and intelligence and patent databases, then aligned those findings with what we heard in interviews. The desk research sources listed here are illustrative, and other public and paid sources were used to collect, validate, and clarify data points throughout the work.
Primary Interviews and Surveys
Primary interviews and surveys focused on verifying what commercial buyers actually purchase, how deployments are scaled, and how revenue is recognized across hardware sales and recurring service contracts. We spoke with robot OEM teams, security service integrators, component suppliers, and commercial end users, then checked differences across building types and operating environments.
Since demand varies with local labor economics and safety norms, interviews also covered major buying regions. We included people who manage day-to-day security operations, which helped us stress-test utilization, replacement cycles, and the average pricing assumptions used in the model.
Distribution of primary research fieldwork respondents
| Company type | Respondent position | Region |
|---|---|---|
| Top tier: 33% | CXOs: 14% | APAC: 37% |
| Mid tier: 51% | Functional/Unit leaders: 35% | EMEA: 37% |
| Smaller Players: 16% | Managers: 51% | Americas: 26% |
Market-Sizing & Forecasting
Sizing starts with a top-down build where commercial-site security spend and automation adoption are translated into an addressable demand pool for security robots, then split by where robots are most actively deployed. Once that structure was in place, selective bottom-up checks were run using supplier revenue cues, sampled average selling prices, and typical fleet sizes per site to validate totals and adjust obvious gaps.
A few practical model inputs for this market include site security staffing costs, robot unit economics under service contracts, deployment density in high-footfall facilities, replacement and battery refresh cycles, and the pace of sensor price declines that affect overall system pricing. Forecasting used scenario analysis supported by simple trend smoothing on key variables, and we tuned the outlook using what interviewees shared about budget cycles, pilot-to-rollout conversion, and expected pricing changes. Where company disclosures were limited, we used ranges and then narrowed them through channel checks so the final value could be reproduced with the same inputs.
Data Validation & Update Cycle
Outputs were checked through several passes so unusual jumps could be explained before sign-off. We compared model results with independent signals such as security services contracting patterns, robotics adoption indicators, and publicly visible deployment announcements, then reviewed variances by region and by customer setting to keep the overall story consistent.
When a major discrepancy showed up, we revisited assumptions and, where needed, re-contacted experts to confirm what changed, such as pricing structures or refresh cycles. Reports are refreshed annually, with interim updates for material events that can shift demand or pricing, and a final pre-delivery review is completed to reflect the latest available information.
Mordor Intelligence's Commercial Security Robot Market Size Measured Against Other Published Estimates
Published market sizes for commercial security robots often vary because not everyone counts the same revenue streams, and the timing of what gets recognized as market revenue can differ. Differences also come from how firms treat recurring service fees versus one-time hardware sales, and whether estimates assume pilots convert to full deployments quickly.
The spread is usually driven by scope choices, growth assumptions, and refresh cadence. Some figures appear to fold in adjacent categories like broad security robotics or even defense-linked activity, while other estimates may use aggressive adoption curves without checking them against facility-level buying cycles and staffing economics. In those cases, the market size can look much larger or smaller depending on those inputs, which is why this estimate uses a modeling choice applied by Mordor Intelligence.
Benchmark comparison
| Source | Market Size | Gaps in Research Methodology |
|---|---|---|
| Mordor Intelligence | USD 3.50 B (2025) | |
| Global Consultancy A | USD 2.95 B (2025) | Uses a narrower view that emphasizes patrol-only deployments and tends to exclude recurring software and monitoring fees, which reduces the revenue base in the current year. |
| Industry Source B | USD 4.30 B (2025) | Appears to include broader security robotics revenue and assumes faster conversion of pilots to scaled rollouts, with less visible adjustment for contract structure and utilization differences. |
The table shows that most differences can be traced back to what is counted as commercial security robot revenue and how fast adoption is assumed to scale. By keeping inclusions tied to commercial deployments and by checking pricing and utilization against what buyers and integrators report, the estimate is easier to reproduce and remains more transparent.
Key Questions Answered in the Report
What is the size of the commercial security robot market in 2026?
It is valued at USD 4.12 billion and is set to reach USD 9.33 billion by 2031.
Which region leads the adoption of commercial security robots?
North America accounts for 35.85% of 2025 revenue, driven by strong venture funding and early airport deployments.
What robot type is growing fastest?
Aerial security drones are forecast to post a 20.89% CAGR because private 5G enables coordinated multi-drone patrols.
Why do insurers favor robotic guards?
Certified robots cut incident claims, so carriers like Zurich grant 15-25% premium discounts to facilities that deploy them.
What is the main barrier to wider uptake?
High upfront CAPEX, often USD 150,000-500,000 per site, remains the biggest hurdle for mid-sized enterprises.