
Market Overview
| Study Period | 2020 - 2031 |
|---|---|
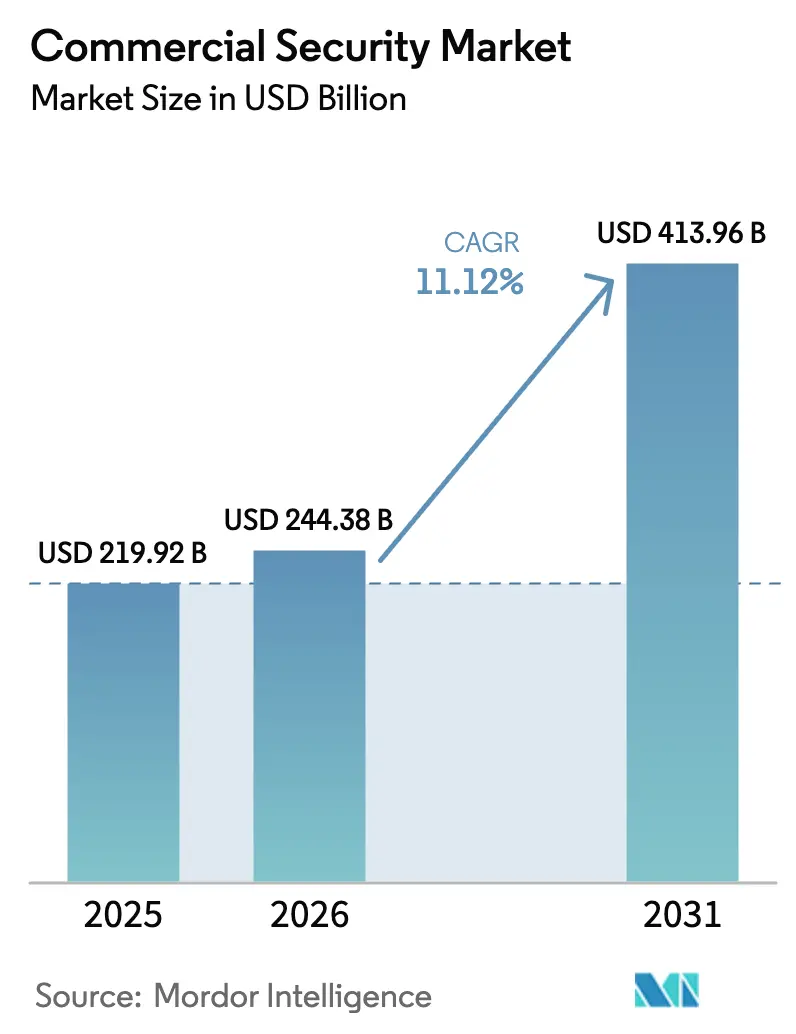
| Market Size (2026) | USD 244.38 Billion |
| Market Size (2031) | USD 413.96 Billion |
| Growth Rate (2026 - 2031) | 11.12 % |
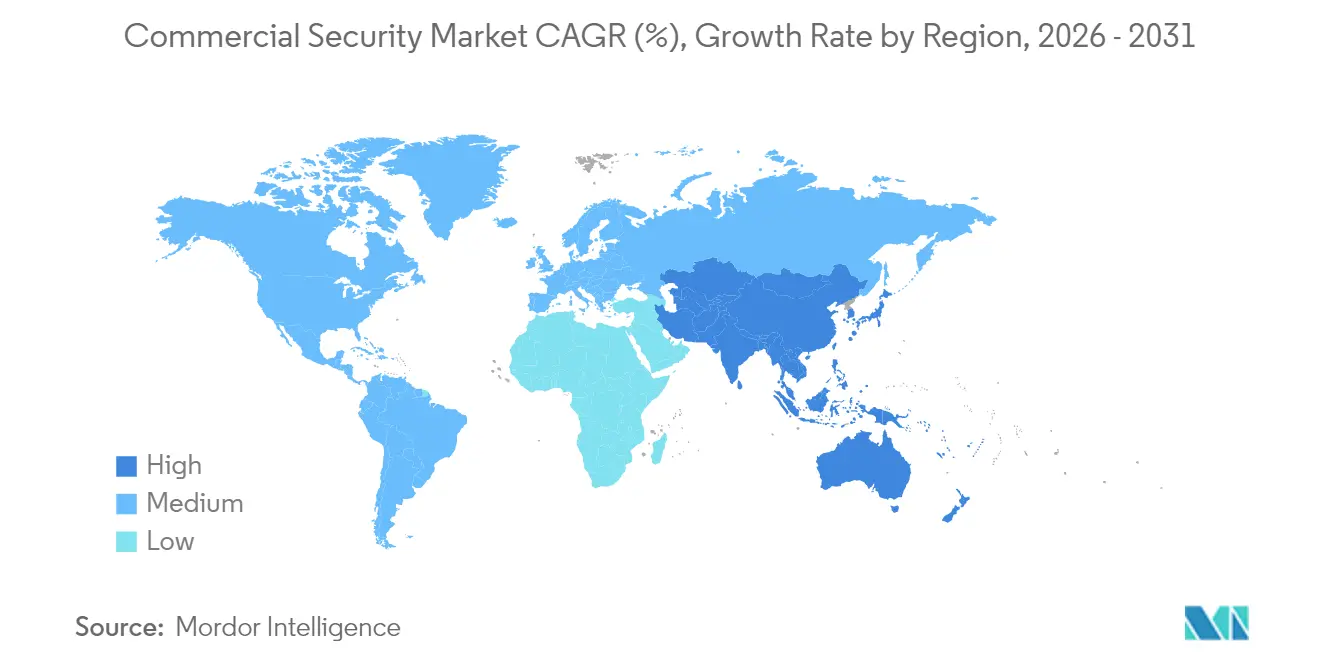
| Fastest Growing Market | Asia-Pacific |
| Largest Market | North America |
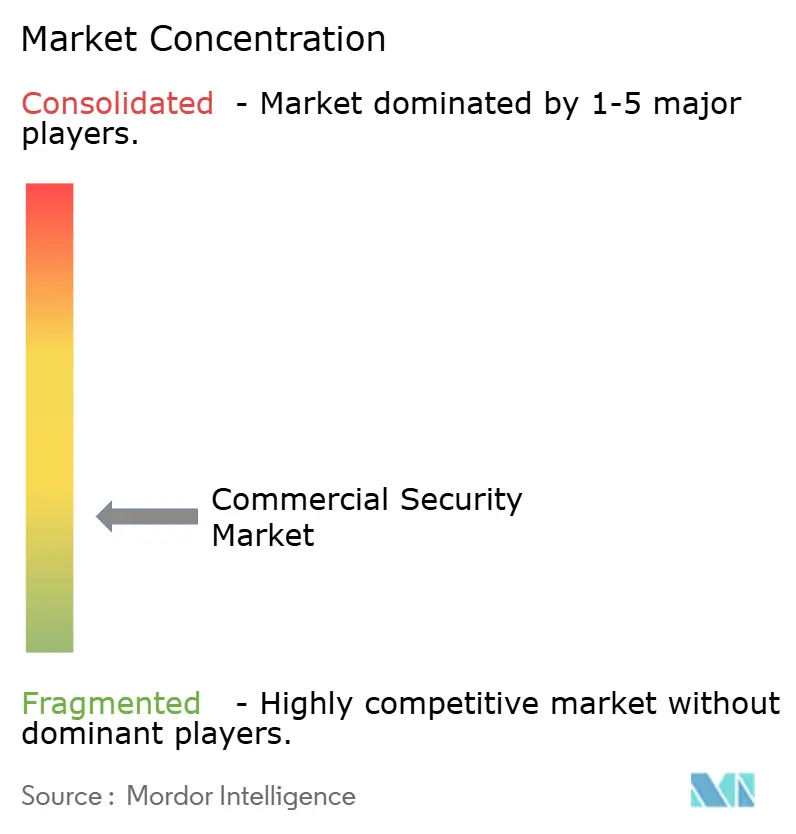
| Market Concentration | Low |
Major Players *Disclaimer: Major Players sorted in no particular order Image © Mordor Intelligence. Reuse requires attribution under CC BY 4.0. | |
Commercial Security Market Analysis by Mordor Intelligence
The Commercial security market size was valued at USD 219.92 billion in 2025 and estimated to grow from USD 244.38 billion in 2026 to reach USD 413.96 billion by 2031, at a CAGR of 11.12% during the forecast period (2026-2031). The step-up reflects how organisations now treat security installations as data-rich operational platforms, not isolated safety gear. Regulations such as Alyssa’s Law in the United States have forced the rapid adoption of multi-sensor solutions that fuse video, access, communication, and analytics. Enterprises are also converging physical and cyber safeguards inside operational-technology networks, driving demand for software-centric platforms that orchestrate both realms. Meanwhile, cloud-native video services are lowering ownership costs for multi-site retailers, and insurers have begun offering premium incentives when AI fire-detection tools are installed. These economic levers amplify purchasing momentum across every end-user segment.
Key Report Takeaways
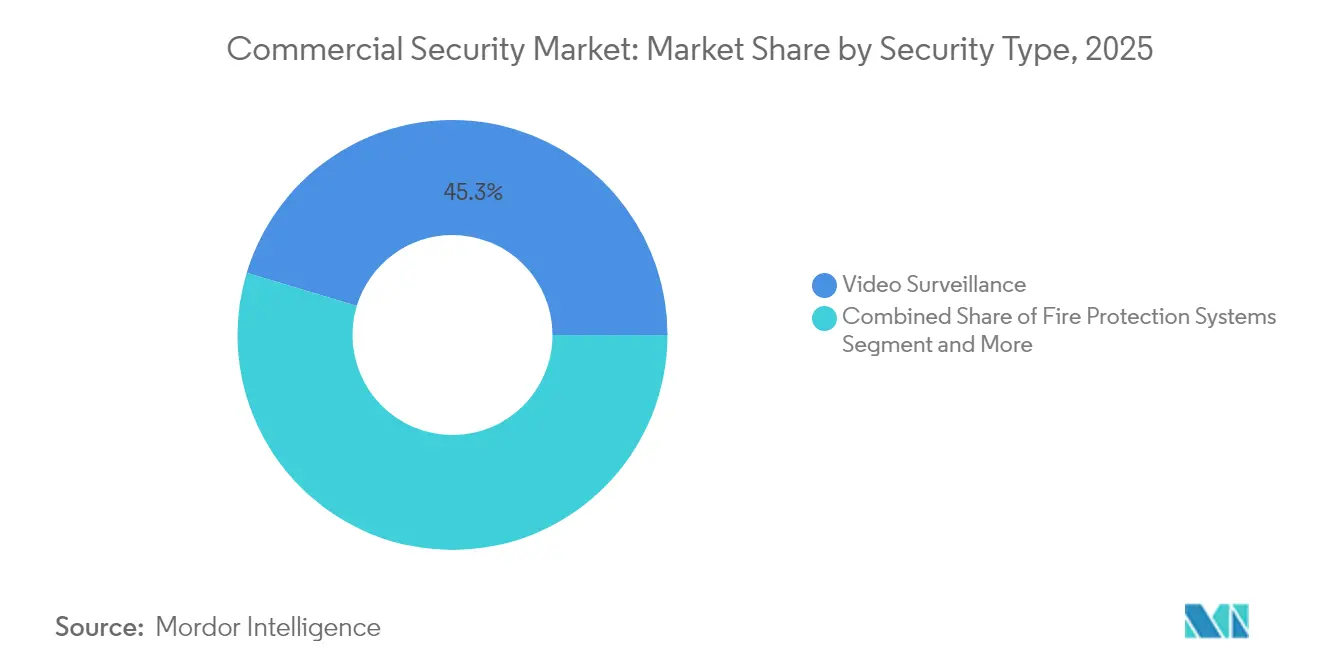
- By security type, video surveillance led with a 45.32% share of the Commercial security market in 2025, while access control is forecast to post the fastest 11.36% CAGR through 2031.
- By component, hardware held a 66.78% share of the Commercial security market size in 2025; services are projected to expand at an 11.75% CAGR during 2026-2031.
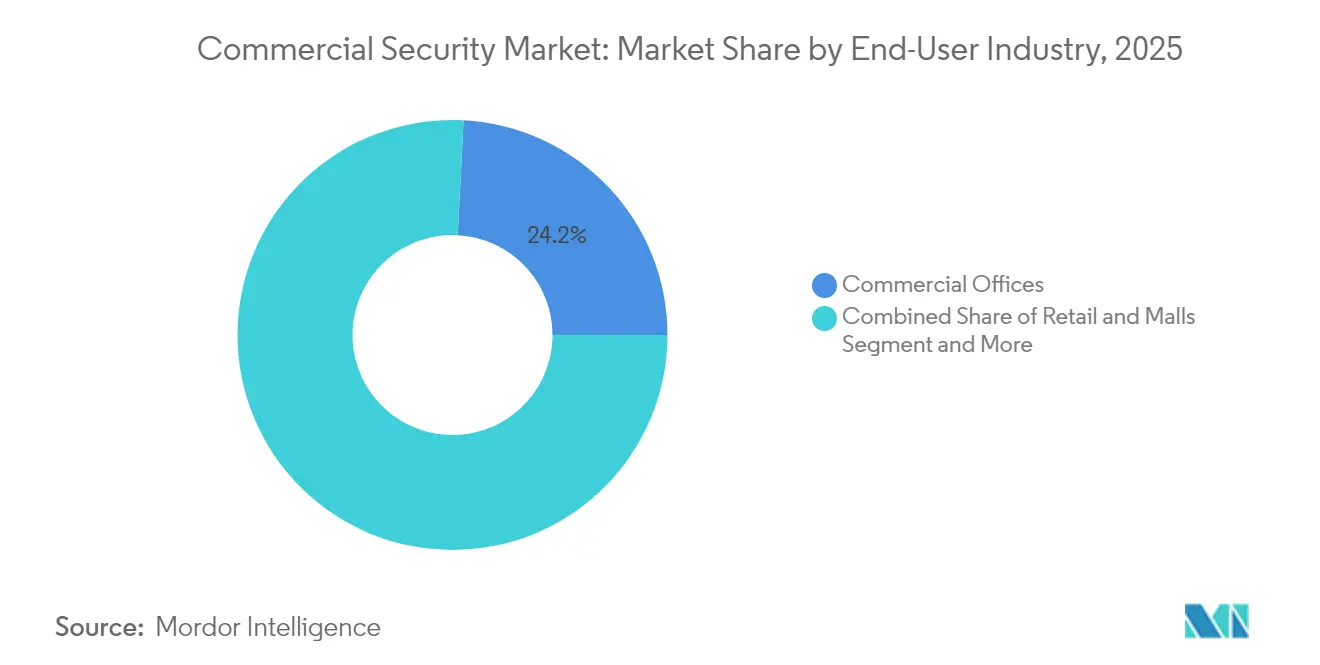
- By end-user industry, commercial offices captured 24.18% of the Commercial security market size in 2025, whereas healthcare facilities are expected to advance at a 11.47% CAGR to 2031.
- By organisation size, large enterprises commanded 71.34% of the Commercial security market share in 2025; SMEs are growing at the fastest rate, with a 11.96% CAGR.
- By geography, North America dominated the market with 33.78% revenue in 2025; however, the Asia Pacific is poised for an 11.06% CAGR through 2031.
Note: Market size and forecast figures in this report are generated using Mordor Intelligence’s proprietary estimation framework, updated with the latest available data and insights as of 2026.
Market Trends and Insights
Drivers Impact Analysis of Commercial Security Market*
| Driver | (~) % Impact on CAGR Forecast | Geographic Relevance | Impact Timeline |
|---|---|---|---|
| Workplace safety mandates driving multi-sensor platforms | +2.1% | North America & EU | Medium term (2-4 years) |
| Convergence of physical and cyber security within OT networks | +1.8% | Global | Long term (≥ 4 years) |
| Cloud-native video surveillance reducing TCO for multi-site retail chains | +1.5% | Global, early gains in North America & APAC | Short term (≤ 2 years) |
| Insurance premium discounts for AI-enabled fire detection systems | +1.2% | North America & EU | Medium term (2-4 years) |
| Rapid uptake of mobile-credential access control in co-working spaces | +1.4% | Global, urban centres | Short term (≤ 2 years) |
| Source: Mordor Intelligence | |||
Workplace Safety Mandates Driving Multi-Sensor Platforms
Legislative frameworks are compelling organizations to deploy comprehensive threat detection systems that extend beyond traditional perimeter security. The implementation of Alyssa's Law across multiple U.S. states requires educational institutions to install panic alert systems with direct law enforcement connectivity, creating demand for integrated platforms that combine access control, video surveillance, and emergency communication capabilities.[1] This regulatory push is driving the adoption of AI-powered security systems that can differentiate between routine activities and potential threats, with 56% of end-users now optimizing operations through their security systems rather than viewing them as purely protective measures. The convergence of safety mandates with technological capabilities is creating a multiplier effect, where compliance requirements become catalysts for broader modernization of security infrastructure. Organizations are discovering that multi-sensor platforms not only satisfy regulatory obligations but also provide operational intelligence that improves facility management and emergency response coordination. The economic impact extends beyond compliance costs, as integrated systems reduce the total cost of ownership through consolidated management interfaces and shared infrastructure components.
Convergence of Physical and Cyber Security within OT Networks
The integration of operational technology networks with physical security systems is creating new attack vectors that require unified defense strategies. Industrial facilities and critical infrastructure are increasingly adopting cyber-physical security convergence frameworks that treat physical access controls as cybersecurity endpoints, necessitating the use of quantum-safe cryptography and advanced authentication protocols. This convergence is particularly evident in healthcare facilities, where unified physical security platforms enable the quick identification and response to incidents while maintaining compliance with data protection regulations.[2] The shift toward three-way security convergence, integrating physical security, OT security, and cybersecurity, is being driven by the recognition that siloed approaches create vulnerabilities that sophisticated threat actors can exploit. Organizations are implementing security frameworks that provide real-time correlation between physical access events and network activity, enabling proactive threat detection and response. The economic rationale for convergence extends beyond security benefits, as unified platforms reduce operational complexity and enable more efficient resource allocation across security functions.
Cloud-Native Video Surveillance Reducing TCO for Multi-Site Retail Chains
The migration to cloud-based video surveillance architectures is fundamentally altering the economics of multi-site security deployments. Retail chains are adopting cloud-native platforms that eliminate the need for on-premises storage infrastructure while providing advanced analytics capabilities that were previously accessible only to large enterprises. Genetec's Security Center SaaS platform, launched in 2024 with pricing starting at USD 149 per device annually, exemplifies this shift by offering enterprise-grade video management capabilities through a subscription model that reduces upfront capital requirements.[3] The total cost of ownership reduction stems from eliminated hardware refresh cycles, reduced IT staffing requirements, and the ability to scale storage capacity dynamically based on actual usage patterns. Cloud-native architectures also enable advanced AI-powered analytics that can identify patterns across multiple locations, providing retailers with insights into customer behavior and operational efficiency that extend beyond traditional security applications. The subscription-based model aligns security costs with business growth, making advanced surveillance capabilities accessible to smaller retailers while providing enterprise clients with predictable operational expenses.
Rapid Uptake of Mobile-Credential Access Control in Co-Working Spaces
The proliferation of flexible work arrangements is driving demand for access control systems that can accommodate dynamic occupancy patterns and temporary access requirements. Mobile credential technology has evolved beyond simple card replacement to encompass multi-layered authentication methods that provide enhanced security while improving user experience. The technology's adoption is particularly pronounced in co-working spaces, where operators must manage hundreds of users with varying access privileges and temporal requirements, creating operational complexity that traditional card-based systems cannot efficiently address. Mobile credentials enable real-time access management that can be modified remotely, reducing administrative overhead while providing detailed audit trails that support compliance requirements. The economic benefits extend beyond operational efficiency, as mobile systems eliminate the costs associated with physical card production, distribution, and replacement, while reducing the risk of credential sharing or loss. The integration of mobile credentials with broader facility management systems is creating new opportunities for space optimization and user experience enhancement, positioning access control as a value-added service rather than a security necessity.
Restraints Impact Analysis of Commercial Security Market*
| Restraint | (~) % Impact on CAGR Forecast | Geographic Relevance | Impact Timeline |
|---|---|---|---|
| Fragmented building codes delaying retrofit projects | –1.3% | Global, acute in emerging markets | Long term (≥ 4 years) |
| Data-residency regulations hindering cross-border video storage | –0.8% | EU & GCC | Medium term (2-4 years) |
| Component lead-time volatility for semiconductors and optics | –1.1% | Global | Short term (≤ 2 years) |
| Low end-user awareness of TCO benefits in MEA | –0.7% | Middle East & Africa | Medium term (2-4 years) |
| Source: Mordor Intelligence | |||
Fragmented Building Codes Delaying Retrofit Projects
Post-disaster rebuilding in Los Angeles reveals permitting cycles that extend past one year for single-family homes, let alone commercial towers. Integrators must navigate diverse fire, accessibility, and cyber addenda, inflating design hours and eroding project IRR. This complexity deters owners from overhauling legacy estates, especially in developing regions where code enforcement varies across municipalities.
Data-Residency Regulations Hindering Cross-Border Video Storage
The UAE’s 2021 Data Protection Law and the EU AI Act classify biometric analytics as high-risk, requiring enterprises to store footage locally or demonstrate adequate safeguards. Retailers with pan-regional portals must fund hybrid clouds that silo EU data, raising the cost per retained hour of video. Compliance audits add operational overhead and constrain vendor selection.
*Our forecasts treat driver/restraint impacts as directional, not additive. The impact forecasts reflect baseline growth, mix effects, and variable interactions.
Commercial Security Market Segment Analysis
By Security Type:
Access Control Systems Accelerate Despite Video DominanceVideo surveillance retained a 45.32% share of the Commercial security market in 2025 by leveraging AI analytics that transform cameras into predictive sensors. The segment benefits from cloud offloading of storage and real-time object recognition, which reduces false alarms and provides valuable insights into customer flow for retailers. Access control, however, is tracking the fastest 11.36% CAGR as smartphone-based credentials and IT security convergence spur refresh activity in offices and healthcare facilities. Mobile solutions deliver password-quality cryptography, while APIs let identity-management tools grant or revoke door rights instantly. Fire detection platforms hold steady demand on the back of code mandates, whereas perimeter-intrusion systems now integrate AI to filter wildlife motion. Integrated security management suites, which overlay analytics and policy engines across multiple device categories, represent a rapidly growing niche for enterprises seeking a single-pane-of-glass view.
Adoption momentum for mobile credentials is sharpest in co-working hubs where tenant turnover is high. Operators appreciate remote issuance, and occupants prefer device-free entry, which cuts badge inventory costs. Healthcare systems value audit trails that correlate patient-care events with staff movement, supporting compliance with life-safety protocols. Genetec’s six-year 28% CAGR in access control symbolises how software innovation is outrunning hardware turnover. Integration with cyber-defence tools also shortens incident-response times, illustrating why investors view access control as a software play within the broader Commercial security systems market.

By Component:
Services Surge as Hardware CommoditisesHardware still comprised 66.78% of the Commercial security market size in 2025, covering cameras, controllers, and sensors that anchor any deployment. Price competition and silicon shortages, however, are squeezing margins, pushing vendors to pivot toward services. Managed security, design consulting, multi-year maintenance contracts, and usage-based cloud storage are rising at an 11.75% CAGR as customers outsource complexity. Software analytics, powered by edge AI chips, extract behavioural patterns and anomaly alerts from raw feeds, creating upsell paths that do not depend on new metal.
The services uptrend dovetails with cybersecurity demands. Continuous vulnerability scans, firmware patches, and compliance reporting are now included in service-level agreements. Johnson Controls’ Metasys 14.0 demonstrates how analytics upgrades are delivered over the air, requiring ongoing subscriptions rather than one-off licences. For channel partners, recurring revenue smooths cash flow and raises customer lifetime value. Cloud storage also eliminates the headache of on-premises RAID refreshes, linking expenditure directly to retention policies and video analysis intensity.
By End-User Industry:
Healthcare Facilities Drive Growth Despite Office DominanceCommercial offices held 24.18% of the Commercial security market share in 2025 as corporate landlords integrated Physical Identity and Access Management suites that span multi-tower campuses. Tenants demand cohesive visitor vetting, package delivery tracking, and elevator dispatch, which central software consoles now manage. While offices retain scale, healthcare is charting an 11.47% CAGR because hospitals require 24/7 monitoring, staff-safety duress buttons, and seamless cross-wing access audits. Regulations governing patient data and narcotic storage further intensify security spending.
Hospitals are layering IoT sensors onto badge events to track equipment and monitor environmental parameters that influence infection control. The blend of life-safety and cybersecurity concerns makes integrated platforms indispensable. Retail venues harness cloud-based VMS to analyze shopper traffic and optimize staffing. Warehouses embed access readers on forklift charge bays to log operator licences, aligning with OSHA audits. Each use case pushes vendors to package sector-specific analytics modules, thereby raising the overall value proposition of the commercial security systems market.
By Organisation Size:
SMEs Embrace Cloud-Based SolutionsLarge enterprises still account for 71.34% of the Commercial security market size due to multi-site estates and compliance mandates. They rely on federated VMS clusters and central security operations centres for real-time situational awareness. Yet SMEs are the growth engine, expanding at 11.96% CAGR. Subscription pricing removes heavy capex hurdles, while plug-and-play devices ship with LTE fail-over, negating the need for dedicated IT staff. The ASSA ABLOY Centrios model, priced at USD 20 per month for 50 doors, resonates with micro-chains and professional services firms that lease rather than own property.
Cloud dashboards provide SME owners with instant insight into alarm status and visitor logs via mobile apps, democratizing features once reserved for Fortune 500 budgets. Integrated cyber-health checks flag weak passwords on routers, underscoring the trend toward convergence. As SME adoption scales, the Commercial security market benefits from a longer tail of customers, diversifying revenue and prompting vendors to widen channel programmes that cater to installers servicing local businesses.
Geography Analysis
North America Commercial Security Market
North America retained 33.78% of global revenue in 2025, driven by stringent life-safety regulations and early adoption of AI. Regulatory momentum, such as Alyssa’s Law, continues to feed hardware refresh cycles, while cloud VMS adoption cuts recurring IT overhead. Supply-chain vulnerabilities, spotlighted by the Spruce Pine quartz mine disruption, underscore the strategic imperative for domestic sensor production.
APAC, Europe and Middle East Commercial Security Market
The Asia Pacific is racing ahead with an 11.06% CAGR, driven by smart-city programs and a vast SME base that values cloud credentials. National AI policies in the UAE and Saudi Arabia (part of the broader Middle East) further stimulate AI-powered deployments compliant with data-sovereignty rules. Europe’s enforcement of the AI Act renders biometric systems high-risk, driving demand for local-edge processing to keep data onshore. GCC data-centre booms and strong infrastructure spending create fresh demand across the region.
The Americas and Africa Commercial Security Market
South America is entering a stabilization phase as inflation eases and governments sharpen public-safety mandates. Mexico’s logistics corridors and Brazil’s retail modernization are accelerating upgrades from analog CCTV to hybrid cloud VMS, while privacy statutes such as Brazil’s LGPD are pushing vendors toward encrypted-edge architectures. In contrast, Africa’s growth is tied to infrastructure resilience, airports, utilities, and industrial parks are prioritising ruggedised sensors and solar-backed surveillance to counter grid volatility. Across both regions, donor-funded city surveillance initiatives and telecom-led cloud bundles are expanding access to enterprise-grade security, boosting baseline demand through 2030.
Regulatory Landscape
Commercial security deployments are increasingly shaped by procurement and technology-risk rules in addition to traditional life-safety codes. In the United States, federal restrictions such as NDAA Section 889 continue to constrain the use of specified surveillance and telecommunications equipment in government and federally funded environments, influencing camera, access control, and communications choices across commercial projects that involve public-sector money. The FCC also adopted rules in October 2025 that phase out the sale of previously approved Hikvision equipment (under its equipment authorization framework), accelerating compliance screening and replacement decisions for installers and multi-site operators.
Privacy and AI governance requirements add a second compliance layer for analytics-driven systems. In Europe, the EU AI Act classifies biometric analytics as high-risk, and the May 7, 2026 Digital Omnibus agreement deferred certain high-risk obligations to December 2027, affecting how quickly end users and vendors operationalize controls for facial recognition and other biometric use cases. Across US states, 2025 cybersecurity statutes and expanding biometric privacy coverage are pushing commercial buyers toward NIST-aligned security controls, tighter vendor due diligence, and clearer data-handling terms for cloud video and access platforms.
Value Chain Analysis
The commercial security value chain spans component suppliers (sensors, optics, chipsets), OEMs and software providers (cameras, controllers, VMS/access platforms, analytics), distribution, systems integrators, and recurring services (monitoring, maintenance, managed security, cloud storage). Value is shifting toward software and services as buyers treat security as an operational platform. At the same time, cloud-delivered updates and cybersecurity requirements are raising the importance of ongoing patching, vulnerability management, and compliance reporting in service-level agreements.
Procurement restrictions and supply-chain risk mandates are also reshaping upstream and channel choices, particularly for video surveillance and adjacent categories that share components and firmware stacks. NDAA-related compliance screening and the risk of forced rip-and-replace elevate the role of compliant product lines and documentation throughout bidding, design, and commissioning, increasing liability for integrators when restricted components are discovered late. Assurance expectations such as SOC 2 have moved from a differentiator to a baseline procurement requirement for cloud-connected security platforms, changing how vendors qualify for enterprise and multi-site commercial rollouts.
Competitive Landscape
Competition is moderate yet intensifying as platform economics overtake pure hardware sales. Honeywell’s USD 4.95 billion purchase of Carrier’s LenelS2, Onity, and Supra lines builds an end-to-end stack spanning cloud VMS, mobile credentials, and analytics, illustrating a pivot toward lifetime-value monetisation. Bosch’s decision to divest its security communications arm to Triton for USD 735 million suggests that scale alone no longer guarantees a strategic fit; software orchestration and recurring services revenue now dominate boardroom agendas.
White-space entrants such as Alarm.com and Suprema AI showcase pure-play AI differentiation, winning industry awards for autonomous deterrence and ATM-fraud prevention. Systems integrators are partnering with consultancies; the Convergint-Deloitte alliance bundles cyber-assessment with physical-device rollout, meeting the C-suite's appetite for a single, accountable partner. Patent activity around risk-scoring engines that weight physical and IT signals suggests the next battlefield will be algorithmic intellectual property rather than camera sensor count.
Vendor strategy centres on three pillars. First, acquire installed bases that can be migrated to cloud service plans. Second, embed AI analytics that extract cross-functional insights, elevating the platform from a cost centre to a productivity engine. Third, offer zero-trust-ready architectures to address board-level cyber liability exposure. Firms executing on all three capture premium margins even as device ASPs soften.
Commercial Security Industry Leaders
-
Honeywell International Inc.
-
Johnson Controls International plc
-
Carrier Global Corporation
-
Bosch Security and Safety Systems
-
Hangzhou Hikvision Digital Technology Co., Ltd.
- *Disclaimer: Major Players sorted in no particular order
Commercial Security Market Companies Covered in this Report
- Honeywell International Inc.
- Johnson Controls International plc
- Carrier Global Corporation
- Bosch Security and Safety Systems
- Hangzhou Hikvision Digital Technology Co., Ltd.
- Zhejiang Dahua Technology Co., Ltd.
- Axis Communications AB
- ASSA ABLOY AB (incl. HID Global)
- Allegion plc
- Stanley Security (SBD)
- Securitas AB
- ADT Inc.
- Panasonic i-PRO
- Hanwha Vision
- Siemens Smart Infrastructure
- LenelS2
- Brivo Inc.
- Genetec Inc.
- Gallagher Group Ltd.
- Nedap N.V.
- Milestone Systems A/S
- Teledyne FLIR LLC
- Avigilon Corporation (Motorola Solutions)
- Verkada Inc.
Market Opportunities and Future Outlook
Compliance-driven refresh cycles create whitespace for vendors and integrators that can deliver verifiable, end-to-end compliant architectures for video, access, and analytics. US procurement constraints tied to NDAA Section 889 and the FCC's October 2025 action affecting Hikvision equipment are pushing buyers to re-check installed bases, supplier bills of materials, and platform roadmaps, opening opportunities for NDAA-aligned alternatives and for services around assessment, redesign, and replacement. As mandates broaden from cameras into adjacent connected building security categories, integrators can package compliance as a managed service that includes device inventory, firmware governance, and documentation for audits.
Data governance and AI accountability are also translating into demand for deployment patterns that keep sensitive video and biometrics controlled by design, not only by policy. The EU AI Act's high-risk framework for biometric analytics, alongside evolving state-level cybersecurity and biometric privacy requirements in the United States, supports demand for edge processing, hybrid-cloud video storage architectures, and privacy-preserving analytics configurations that reduce cross-border data exposure. On the platform side, consolidation and ecosystem building, including Honeywell's integration of LenelS2, Onity, and Supra into a broader cloud-led stack, is reinforcing demand for interoperable, single-pane-of-glass management that links physical security to cyber and operational workflows, especially in multi-site retail, healthcare, and commercial office portfolios.
Recent Industry Developments in Commercial Security Market
- March 2026: Honeywell International Inc. announces Honeywell and Rhombus introduce AI-powered cloud video and integrated access solution for commercial environments. The launch expands cloud based video and access platform integration across end-user sites. The capacity addition strengthens recurring revenue potential through cloud services.
- March 2026: Johnson Controls International plc, ISC West 2026: Johnson Controls launches next-generation access control and video solutions (C-CURE IQ 3.2, exacqVision 26.0, Illustra cameras). The market sees next-gen access control and VMS portfolio expansion. This move broadens platform ecosystem and cross-sell with intrusion and analytics products.
- March 2026: Johnson Controls International plc unveils fifth-generation DSC PowerSeries Neo and IQ Panel enhancements for intrusion detection. Intrusion portfolio upgrades strengthen integrated security offering. The update boosts channel competitiveness.
Commercial Security Market Report Scope and Research Methodology
Market Definition and Coverage
For this study, the commercial security market covers spending on security systems and related services used in non-residential sites like offices, retail, factories, campuses, and public-facing facilities, where the goal is to prevent, detect, and respond to incidents.
Scope exclusions: We exclude purely residential-only security demand, and we also exclude cybersecurity products that do not connect to physical security outcomes.
Segments Covered in This Report
- By Security Type
- Fire Protection Systems
- Video Surveillance
- Access Control Systems
- Intrusion and Perimeter Detection
- Integrated Security Management Platforms
- By Component
- Hardware (Cameras, Sensors, Panels)
- Software/Analytics
- Services (Design, Installation, AMC, Cloud Storage)
- By End-User Industry
- Commercial Offices
- Retail and Malls
- Hospitality and Leisure
- Healthcare Facilities
- Educational Campuses
- Industrial and Warehousing
- BFSI
- Others
- By Organization Size
- SMEs
- Large Enterprises
- By Geography
- North America
- United States
- Canada
- Mexico
- South America
- Brazil
- Argentina
- Rest of South America
- Europe
- Germany
- United Kingdom
- France
- Nordics
- Rest of Europe
- Asia Pacific
- China
- Japan
- India
- South Korea
- Australia
- New Zealand
- Rest of Asia Pacific
- Middle East and Africa
- Saudi Arabia
- UAE
- Turkey
- South Africa
- Kenya
- Rest of Middle East and Africa
- North America
Data Sources, Market Sizing, and Validation
Desk Research
We started by mapping what commercial sites typically buy and how budgets are approved, then translated those inputs into measurable demand signals. Public sources were used to anchor the model with consistent time series and boundary rules, including government construction and nonresidential investment statistics, building and fire code references from standards bodies, and trade and customs data for relevant equipment categories.
Next, we cross-checked market direction and pricing logic using sources such as company annual reports and investor presentations, reputable press coverage of large facility rollouts, peer-reviewed articles on video analytics and access control adoption, and patent databases that show where product development is moving. Where needed, we also used paid subscriptions for company financials and intelligence, news and financials, patent lookups, and shipment-level import and export checks to reduce gaps for private players and cross-border flows. The desk research sources listed above are illustrative only, and we also used other public and paid sources for data collection, validation, and clarification.
Primary Interviews and Surveys
Our fieldwork focused on validating what is really being bought, typical deal sizes, and how projects are phased across new builds versus retrofit sites. We spoke with stakeholders across solution delivery and buying roles, including integrators, distributors, facility managers, security heads, and product specialists, and then used those conversations to tighten adoption rates, service attach assumptions, and regional weighting.
Distribution of primary research fieldwork respondents
| Company type | Respondent position | Region |
|---|---|---|
| Top tier: 33% | CXOs: 12% | APAC: 43% |
| Mid tier: 50% | Functional/Unit leaders: 41% | EMEA: 32% |
| Smaller Players: 17% | Managers: 47% | Americas: 25% |
Market-Sizing & Forecasting
The market size was first reconstructed using a top-down build that ties commercial security demand to nonresidential site counts and spend intensity, then checked against procurement and replacement cycles for installed systems. In practice, we used indicators such as nonresidential construction activity, retrofit intensity in existing buildings, average security spend per site type, the share of sites adopting cloud-managed video and access control, and service attachment rates for monitoring and maintenance.
To keep totals realistic, we corroborated the model using selective bottom-up approximations, including sampled average selling prices for core equipment, channel feedback on typical bundles (camera plus VMS, readers plus controllers, sensors plus panels), and roll-ups of publicly reported security-related revenue where it could be cleanly attributed. Where bottom-up visibility was weak for smaller suppliers, the gap was handled through conservative penetration assumptions, then adjusted after channel checks.
For forecasting, we primarily used scenario analysis so the outlook stays explainable when project timing shifts. Growth paths were tied to drivers like compliance-led upgrades, the pace of multi-site rollouts, and price progression from higher-resolution cameras and analytics, with final scenario weights aligned to what interviewees described as the most likely procurement behavior.
Data Validation & Update Cycle
We validated outputs through a step-by-step set of checks that look for unnatural jumps, region-to-region inconsistencies, and mismatches against independent demand signals. Results were compared with adjacent indicators such as construction spending trends, import and export movements for key equipment classes, and the expected refresh cycle of installed systems, and then anomalies were reviewed before sign-off.
The work is reviewed in more than one internal pass so assumptions, math, and scope boundaries remain consistent. Reports are refreshed annually, and interim updates are made when material events change adoption or pricing, after which respondents may be re-contacted to confirm the direction. Before delivery, a final analyst pass is completed so clients receive the latest updated view.
Mordor Intelligence's Commercial Security Market Size Compared With Other Published Estimates
Published market sizes for commercial security can vary widely because the scope line is not always drawn the same way, and because services and software can be counted differently across studies. Timing also matters because equipment pricing and project deferrals can shift totals from one base year to the next.
By tracking replacement cycles and service attach rates, Mordor Intelligence keeps the model tied to what commercial sites actually deploy and renew, instead of mixing in broader residential demand or counting unrelated cyber-only spend.
Benchmark comparison
| Source | Market Size | Gaps in Research Methodology |
|---|---|---|
| Mordor Intelligence | USD 244.38 B (2026) | |
| Industry Database A | USD 236.90 B (2023) | This estimate is anchored to an earlier year and is typically reported as systems-focused revenue, which can undercount service contracts and cloud subscriptions that expand after installation. |
| Trade Journal B | USD 60.10 B (2024) | This number aligns to physical security equipment only, so services, software platforms, and monitoring revenues are excluded, which naturally makes the total much smaller. |
The spread across sources is mainly explained by where the boundary is drawn between equipment-only views and full commercial security spending that includes recurring services. When the scope is kept consistent by year and by what is included in the spend basket, the sizing becomes easier to follow and to reproduce with clear inputs.
Key Questions Answered in the Report
What is the current value of the Commercial security market?
The sector is valued at USD 244.38 billion in 2026 and is forecast to rise to USD 413.96 billion by 2031.
Which security technology is expanding fastest?
Mobile-credential access control is growing at an 11.36% CAGR, outpacing other security types due to flexible work models and IT-security convergence.
Which is the fastest growing region in Commercial Security Market?
Asia-Pacific is estimated to grow at the highest CAGR over the forecast period (2026-2031).
Why are services gaining momentum versus hardware?
Services post an 11.75% CAGR because cloud storage, managed maintenance and analytics subscriptions provide predictable OPEX and solve skills gaps for users.
Which region offers the highest growth potential through 2031?
Asia Pacific leads with an 11.06% CAGR, supported by smart-city projects and a vast SME base that favours cloud-based deployments.
How are regulations affecting cross-border video surveillance?
Data-residency laws in the EU and GCC force enterprises to store footage locally or adopt hybrid clouds, raising compliance costs but also stimulating regional data-centre investment.
What strategic moves define competitive dynamics?
Large vendors are acquiring software-rich portfolios, shifting toward recurring-revenue cloud models, and partnering with cyber-consultancies to deliver integrated physical-and-IT protection.