
Commercial Seaweed Market Size and Share
Market Overview
| Study Period | 2021 - 2031 |
|---|---|
| Market Size (2026) | USD 22.36 Billion |
| Market Size (2031) | USD 32.98 Billion |
| Growth Rate (2026 - 2031) | 8.08 % |
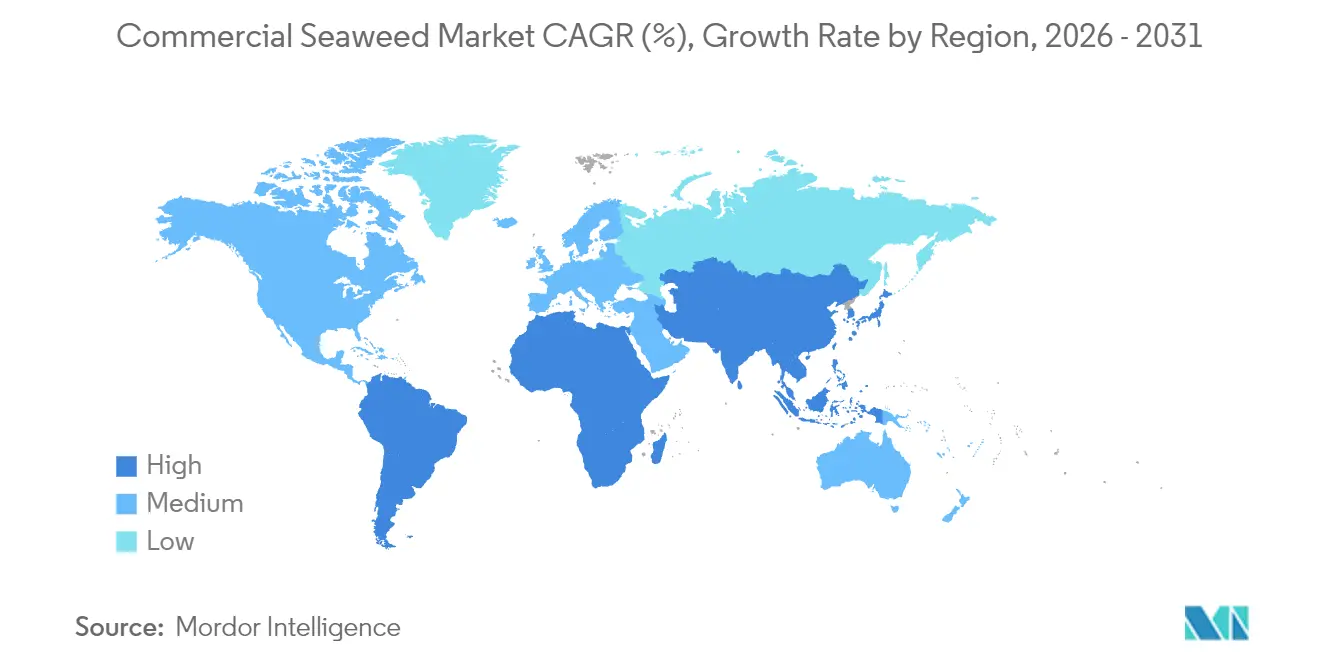
| Fastest Growing Market | Europe |
| Largest Market | Asia Pacific |
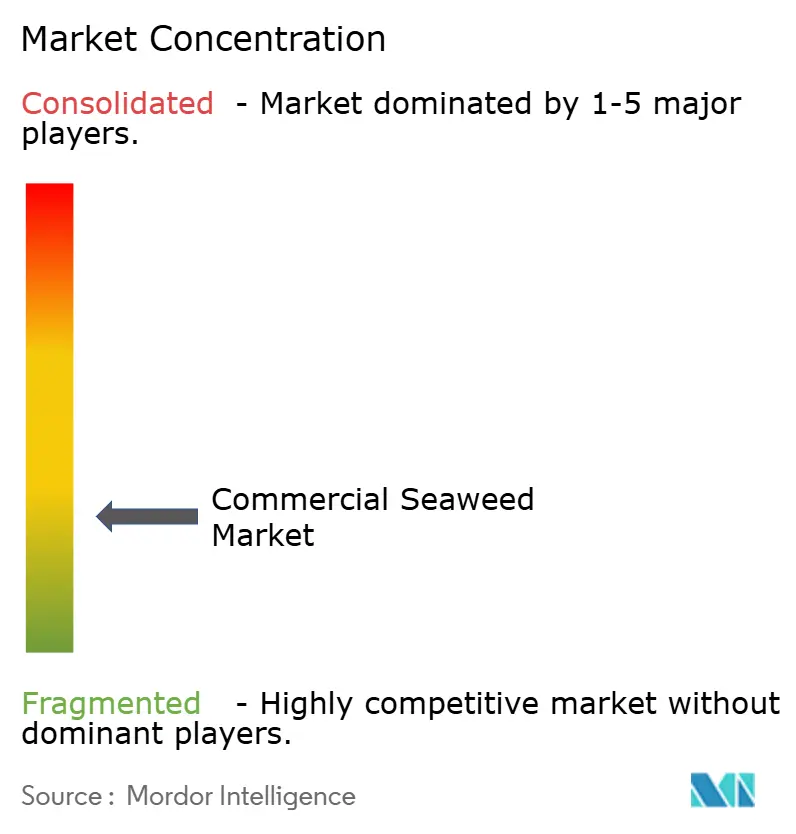
| Market Concentration | Medium |
Major Players *Disclaimer: Major Players sorted in no particular order Image © Mordor Intelligence. Reuse requires attribution under CC BY 4.0. | |
Commercial Seaweed Market Analysis by Mordor Intelligence
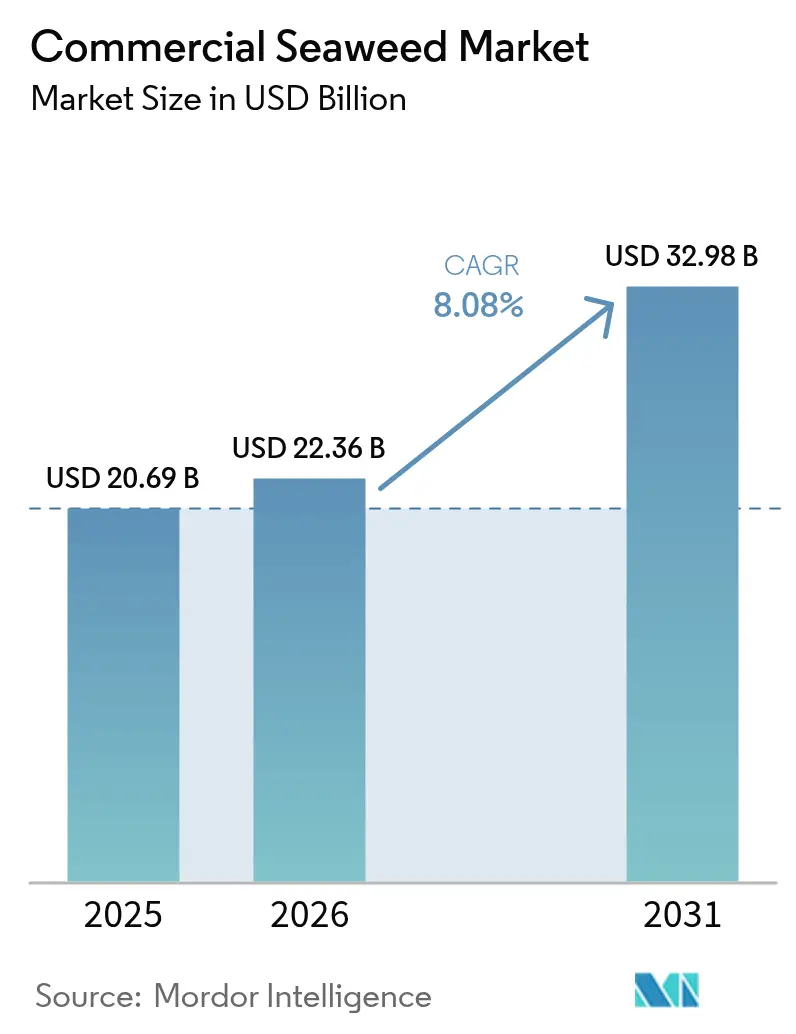
The seaweed market size was valued at USD 20.69 billion in 2025 and estimated to grow from USD 22.36 billion in 2026 to reach USD 32.98 billion by 2031, at a CAGR of 8.08% during the forecast period (2026-2031). This growth is primarily driven by increasing demand for seaweed across food and beverage, pharmaceuticals, agriculture, and personal care applications due to its nutritional value and functional properties. Rising consumer preference for plant-based and sustainable ingredients has further accelerated market adoption globally. Additionally, expanding utilization of seaweed-derived hydrocolloids such as agar, carrageenan, and alginate in processed foods is supporting revenue growth. Technological advancements in seaweed cultivation and harvesting methods are improving production efficiency and supply consistency. Government initiatives promoting sustainable aquaculture and marine resource utilization are also contributing to market expansion. Furthermore, increasing investments in seaweed-based bio-products and alternative protein sources are expected to create new growth opportunities, strengthening the market outlook through the forecast period.
Key Report Takeaways
- By product type, red seaweed led with 47.82% revenue share in 2025, while brown seaweed is projected to expand at a 9.87% CAGR through 2031.
- By flavor, plain formats captured 62.07% of 2025 revenue, and flavored variants are advancing at a 9.57% CAGR to 2031.
- By form, frozen and dried products accounted for 42.11% revenue in 2025; fresh and chilled is the fastest-growing form at a 10.25% CAGR.
- By cultivation method, aquaculture delivered 91.63% of 2025 volume, whereas wild harvest is forecast to rise at a 9.13% CAGR.
- By application, food and beverages commanded 61.34% revenue in 2025; animal feed and pet food record the highest projected growth at 9.74% CAGR.
- By geography, Asia-Pacific held 37.38% of 2025 value, while Europe represents the quickest regional expansion at a 9.48% CAGR.
Note: Market size and forecast figures in this report are generated using Mordor Intelligence’s proprietary estimation framework, updated with the latest available data and insights as of 2026.
Market Trends and Insights
Drivers Impact Analysis of Commercial Seaweed Market*
| Driver | (~) % Impact on CAGR Forecast | Geographic Relevance | Impact Timeline |
|---|---|---|---|
| Growing consumer awareness of health benefits of seaweed | +1.2% | Global, with concentrated uptake in North America, Europe, and urban Asia-Pacific | Medium term (2-4 years) |
| Rising use of seaweed in functional foods and nutraceuticals | +1.5% | North America, Europe, Japan, South Korea | Medium term (2-4 years) |
| Increasing applications in cosmetics and personal care products | +0.9% | Europe, North America, premium segments in Asia-Pacific | Long term (≥4 years) |
| Expansion of seaweed use in animal feed and aquaculture | +1.8% | Global, led by Europe, North America, Australia; spillover to Latin America | Short term (≤2 years) |
| Government support for sustainable aquaculture and seaweed farming | +1.3% | Europe (EU Blue Bioeconomy), Asia-Pacific (China, Indonesia, South Korea), North America (NOAA grants) | Long term (≥4 years) |
| Technological advancements improving seaweed cultivation and processing | +1.1% | Global, with innovation hubs in Norway, Netherlands, United States, Japan | Medium term (2-4 years) |
| Source: Mordor Intelligence | |||
Growing consumer awareness of health benefits of seaweed
Increasing consumer awareness about the nutritional and functional benefits of seaweed is a key driver of the commercial seaweed market. Seaweed is recognized for being rich in vitamins, minerals, dietary fiber, and bioactive compounds, which support immunity, digestion, and cardiovascular health. Rising interest in plant-based, clean-label, and superfood products has encouraged greater incorporation of seaweed into everyday diets. Educational campaigns, media coverage, and health-focused product labeling have further reinforced its image as a natural and sustainable ingredient. Consumers are increasingly seeking functional foods that offer tangible health benefits, which is driving demand for seaweed in both retail and foodservice channels. This growing health consciousness is motivating manufacturers to innovate with new seaweed-based products to meet evolving consumer preferences.
Rising use of seaweed in functional foods and nutraceuticals
The use of seaweed in functional foods and nutraceuticals is rapidly increasing, supporting market growth. Seaweed extracts such as carrageenan, alginate, and fucoidan are widely utilized for their health-promoting properties, including antioxidant, anti-inflammatory, and metabolic benefits. Nutraceutical applications, including dietary supplements and fortified foods, are driving high-value demand for seaweed-based ingredients. Global market data indicates strong adoption in both food and health sectors, with new product launches consistently integrating seaweed as a functional ingredient. The trend toward plant-based nutrition, immunity-boosting products, and clean-label formulations further fuels this growth. Additionally, scientific research validating the bioactive and functional properties of seaweed strengthens its appeal among manufacturers and consumers. Consequently, seaweed is emerging as a preferred ingredient in health-oriented product development, contributing to sustained market expansion.
Technological advancements improving seaweed cultivation and processing
Technological advancements are driving growth in the commercial seaweed market by enhancing cultivation efficiency, processing quality, and overall supply chain reliability. Innovations such as improved long-line and offshore farming techniques, automated harvesting systems, and advanced drying and storage technologies have increased yield, reduced losses, and ensured consistent product quality. Regulatory and standardization developments are also supporting market expansion; for instance, the International Organization for Standardization published ISO 24516 in 2024, establishing quality benchmarks for dried seaweed products[1]. These standards help harmonize international trade, reduce rejection rates during import inspections, and build confidence among global buyers. In addition, advancements in extraction and processing methods are enabling the production of high-value ingredients such as carrageenan, alginate, and fucoidan for functional foods, nutraceuticals, and industrial applications.
Government support for sustainable aquaculture and seaweed farming
Government support for sustainable aquaculture and seaweed farming has strengthened significantly in recent years, particularly through policy-driven initiatives aimed at promoting environmentally responsible marine production. The European Union has reinforced institutional support for seaweed cultivation through new projects funded under the European Maritime, Fisheries and Aquaculture Fund (EMFAF). In 2025, four major initiatives were launched with approximately EUR 5.7 million in funding to scale sustainable algae farming and establish regional innovation hubs across Spain, Portugal, Ireland, and Italy[2]. These initiatives focus on advancing regenerative ocean farming practices, improving cultivation technologies, and supporting collaboration between research institutions and industry stakeholders. The funding also aims to accelerate commercialization while ensuring environmental sustainability and biodiversity protection across coastal regions. Such policy measures are aligned with the EU’s broader blue economy and climate strategies, recognizing seaweed farming as a low-impact aquaculture activity with carbon sequestration potential.
Restraints Impact Analysis of Commercial Seaweed Market*
| Restraint | (~) % Impact on CAGR Forecast | Geographic Relevance | Impact Timeline |
|---|---|---|---|
| Seasonal and geographic limitations impacting year-round production | -0.8% | Temperate zones (North America, Northern Europe, parts of Asia-Pacific) | Short term (≤2 years) |
| High initial investment for seaweed farming infrastructure | -1.0% | Emerging markets (South America, Middle East, Africa), small-scale entrants globally | Medium term (2-4 years) |
| Fluctuations in seaweed yield due to environmental conditions | -0.7% | Global, with acute impact in regions affected by marine heatwaves and ocean acidification | Short term (≤2 years) |
| High cost of processing and extraction technologies | -0.9% | Global, particularly affecting mid-tier processors in Asia-Pacific and Latin America | Long term (≥4 years) |
| Source: Mordor Intelligence | |||
Seasonal and geographic limitations impacting year-round production
Seasonal and geographic limitations pose a significant restraint on the commercial seaweed market, as production is highly dependent on specific coastal regions with suitable water temperature, salinity, and nutrient conditions. Natural growth cycles and seasonal variations restrict year-round harvesting, leading to fluctuations in supply and challenges in meeting consistent demand. Regions prone to extreme weather, such as storms or temperature anomalies, can further disrupt cultivation and harvesting schedules. Geographic constraints also limit the expansion of large-scale operations to areas with optimal marine conditions, increasing reliance on imports in non-producing regions. These limitations can result in higher production costs and supply chain uncertainties, particularly for manufacturers seeking continuous raw material availability. Additionally, variability in seasonal yields affects quality consistency, which is critical for functional foods, nutraceuticals, and industrial applications.
High initial investment for seaweed farming infrastructure
High initial investment requirements pose a major restraint to the commercial seaweed market, as establishing a viable seaweed farming operation demands substantial capital for infrastructure, equipment, and cultivation systems. In regions like Chile, prospective farmers face additional financial and regulatory challenges, including 18–24 month permitting timelines and the need to comply with rigorous environmental impact assessments. Legal and consulting fees associated with these approvals can exceed USD 50,000, significantly increasing the upfront cost burden[3]. Beyond regulatory expenses, farmers must invest in long-line cultivation systems, harvesting machinery, and processing facilities to ensure consistent quality and yield. These high capital requirements can discourage small-scale or new entrants from entering the market. Additionally, the extended time to achieve a return on investment, combined with environmental and operational uncertainties, makes seaweed farming a capital-intensive venture.
*Our forecasts treat driver/restraint impacts as directional, not additive. The impact forecasts reflect baseline growth, mix effects, and variable interactions.
Commercial Seaweed Market Segment Analysis
By Product Type:
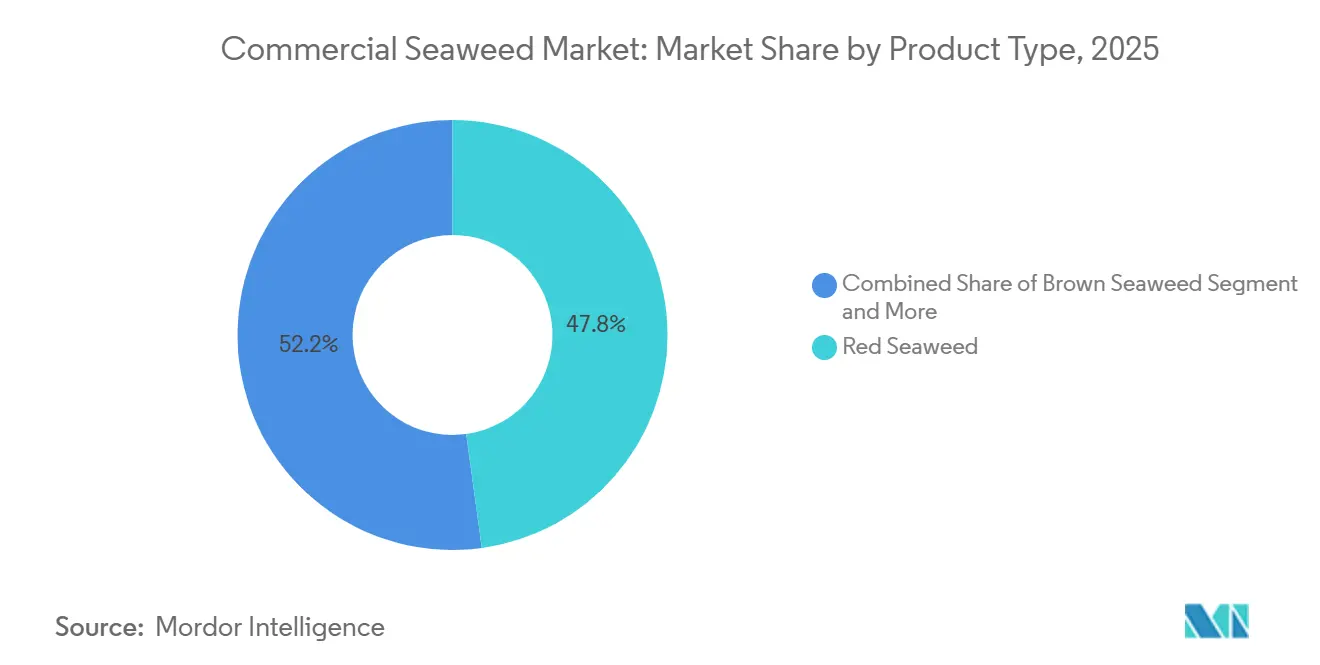
Brown Seaweed Gains on Alginate DemandRed seaweed accounted for the largest revenue share of 47.82% in 2025, establishing itself as the leading segment within the commercial seaweed market. Its dominance is primarily attributed to extensive usage in food processing, particularly for the extraction of hydrocolloids such as agar and carrageenan, which are widely utilized as stabilizing and thickening agents. The strong demand from the food and beverage industry, especially in dairy, confectionery, and processed food applications, continues to support the segment’s growth. In addition, red seaweed benefits from well-established cultivation practices and a stable supply chain across major producing regions. Increasing consumer preference for natural and plant-based ingredients has further strengthened its market position. Moreover, its application in pharmaceuticals and nutraceuticals due to bioactive compounds and nutritional benefits continues to reinforce its leading revenue contribution.
Brown seaweed is anticipated to emerge as the fastest-growing segment, projected to expand at a CAGR of 9.87% through 2031. The growth of this segment is driven by rising demand for alginate extracts used in food, cosmetics, and medical applications owing to their functional and binding properties. Increasing adoption of brown seaweed in agricultural applications, particularly as biofertilizers and soil conditioners, is also contributing to accelerated market expansion. Furthermore, growing research into its potential use in biofuels, alternative proteins, and sustainable packaging solutions is opening new avenues for commercialization. The segment is also benefiting from increased investments in large-scale seaweed farming and improved harvesting technologies.

By Flavor:
Umami Innovation Drives Flavored SegmentPlain formats accounted for the largest share of the commercial seaweed market in 2025, capturing 62.07% of total revenue. The dominance of this segment is largely attributed to its widespread use as a raw material in food processing, hydrocolloid extraction, and industrial applications. Plain seaweed is preferred by manufacturers due to its versatility and ease of incorporation into various end-use products, including soups, snacks, seasonings, and processed foods. It also serves as a foundational ingredient for producing agar, carrageenan, and alginate, which are extensively used as stabilizers and gelling agents. Additionally, bulk procurement of unflavored seaweed by foodservice operators and ingredient manufacturers supports high-volume sales. The segment further benefits from lower processing requirements compared to flavored variants, making it cost-efficient and suitable for large-scale industrial utilization.
Flavored variants are projected to be the fastest-growing segment, expanding at a CAGR of 9.57% through 2031. This growth is driven by rising consumer demand for ready-to-eat and value-added seaweed snacks with enhanced taste profiles. Increasing health consciousness among consumers has fueled interest in convenient, nutrient-rich snack alternatives, positioning flavored seaweed products favorably in retail channels. Manufacturers are introducing innovative flavors tailored to regional preferences, thereby expanding their consumer base. The growing penetration of flavored seaweed in supermarkets, online platforms, and specialty health stores is also supporting segment growth. Moreover, premiumization trends and branding strategies are helping flavored variants command higher margins, further contributing to their accelerated market expansion over the forecast period.
By Form:
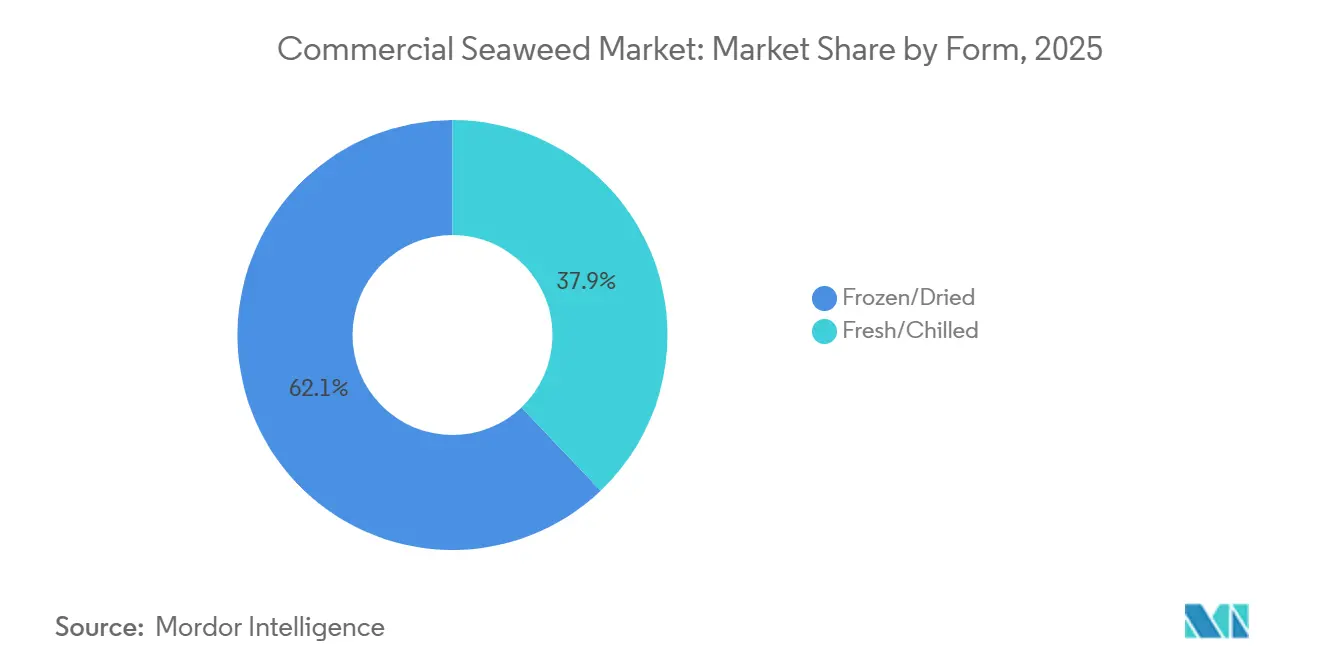
Cold-Chain Logistics Propel Fresh SegmentFrozen and dried products held the largest share of the commercial seaweed market in 2025, accounting for 62.11% of total revenue. The strong market position of this segment is primarily driven by its extended shelf life, ease of storage, and convenience in transportation across domestic and international markets. Frozen and dried seaweed products are widely utilized in food processing, foodservice, and ingredient manufacturing due to their stable quality and year-round availability. These formats also help reduce post-harvest losses while maintaining nutritional content, making them highly preferred by large-scale buyers. In addition, the growing demand for packaged and export-ready seaweed products continues to support the segment’s dominance.
Fresh and chilled seaweed is projected to be the fastest-growing segment, expanding at a CAGR of 10.25% through 2031. The increasing consumer preference for minimally processed and natural food products is a key factor driving growth in this segment. Fresh and chilled seaweed is gaining traction in restaurants and premium retail outlets due to its perceived freshness, taste, and higher nutritional value. Rising demand for authentic Asian cuisine and healthy meal options has further contributed to the growing consumption of fresh seaweed products. Improvements in cold chain logistics and distribution networks are also enabling wider availability of fresh and chilled seaweed beyond traditional coastal markets.
By Cultivation Method:
Aquaculture Dominance Reflects Traceability DemandsAquaculture represented the dominant cultivation method in the commercial seaweed market, accounting for 91.63% of total volume in 2025. The strong share of aquaculture is primarily attributed to its ability to ensure consistent supply, controlled quality, and scalable production compared to wild harvesting. Commercial seaweed farming enables producers to meet rising global demand while reducing dependency on seasonal and environmental variations. Advancements in farming techniques, including rope cultivation and offshore farming systems, have further improved yield efficiency and cost-effectiveness. In addition, government support and investments in sustainable aquaculture practices have encouraged large-scale cultivation across major producing regions. The reliability of aquaculture in supporting industrial applications such as food processing, hydrocolloid extraction, and nutraceutical production continues to reinforce its leading market position.
Wild harvest, on the other hand, is projected to be the fastest-growing cultivation segment, expanding at a CAGR of 9.13% through 2031. Growth in this segment is driven by increasing demand for naturally sourced and minimally processed seaweed, particularly in premium and specialty product categories. Wild-harvested seaweed is often perceived as more natural and environmentally sustainable, which appeals to health-conscious and eco-aware consumers. The segment is also benefiting from growing interest in traditional harvesting practices and artisanal food products. Furthermore, rising demand from niche markets such as organic foods and specialty ingredients is supporting increased harvesting activities.
By Application:
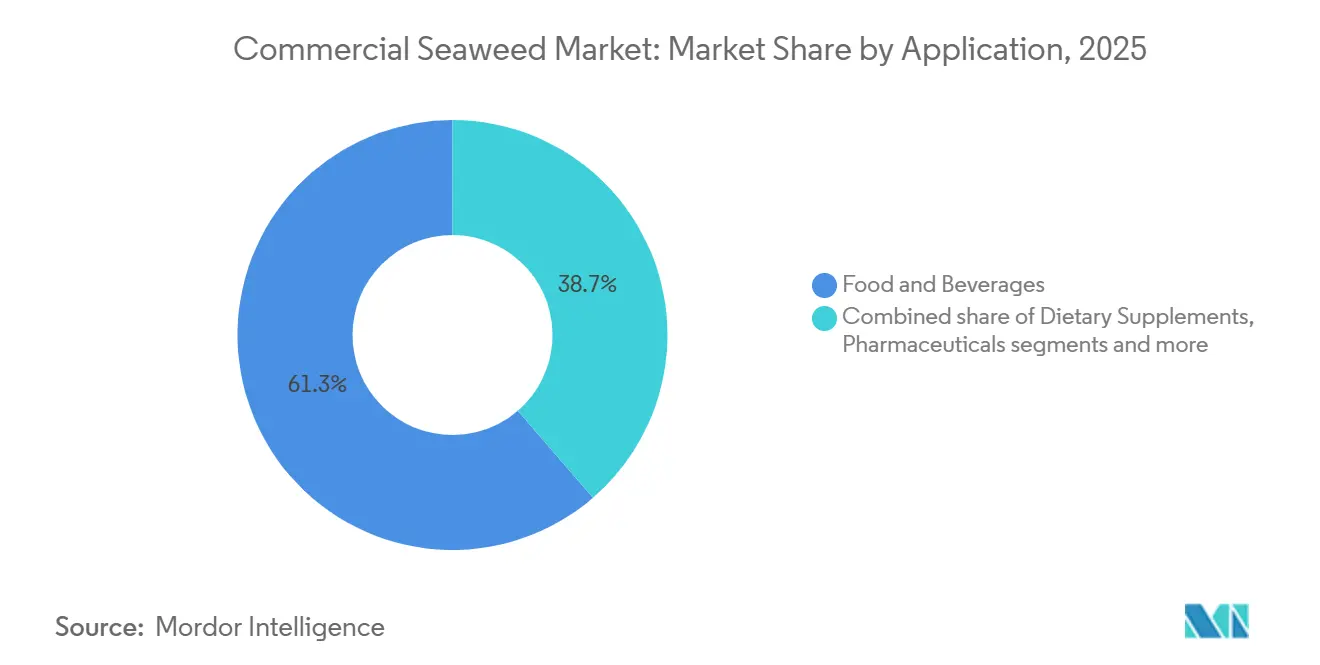
Methane Mitigation Fuels Animal Feed SurgeThe food and beverages segment accounted for the largest share of the commercial seaweed market in 2025, contributing 61.34% of total revenue. This dominance is primarily driven by the widespread use of seaweed as a functional and nutritional ingredient in a variety of food applications, including snacks, soups, salads, seasonings, and processed foods. Seaweed-derived hydrocolloids such as agar, carrageenan, and alginate are extensively used in food processing as stabilizers, thickeners, and gelling agents, further strengthening segment demand. Increasing consumer preference for plant-based, clean-label, and nutrient-rich food products has also supported higher incorporation of seaweed in mainstream diets.
Animal feed and pet food is projected to be the fastest-growing application segment, registering a CAGR of 9.74% through 2031. The growth is driven by increasing recognition of seaweed as a natural source of minerals, vitamins, and bioactive compounds that support animal health and nutrition. Seaweed-based feed additives are gaining traction due to their potential benefits in improving digestion, enhancing immunity, and reducing methane emissions in livestock production. Rising demand for premium and functional pet food products is also contributing to increased adoption of seaweed ingredients in pet nutrition formulations. Furthermore, growing awareness regarding sustainable and alternative feed resources is encouraging manufacturers to incorporate marine-based ingredients into feed products.
Geography Analysis
APAC Commercial Seaweed Market
In 2025, Asia-Pacific commands a 37.38% market share, capitalizing on its established aquaculture infrastructure and traditional consumption habits. However, the region grapples with challenges like climate change repercussions and rising production costs. China stands at the forefront, harnessing advanced cultivation technologies and integrated processing. Yet, it's not without challenges: environmental regulations and surging labor costs squeeze profit margins. Meanwhile, Japan and South Korea are carving niches in premium product segments. Their focus on technological innovations, such as automated harvesting and value-added processing, ensures they maintain a competitive edge, even with elevated production costs. Indonesia and the Philippines enjoy favorable growing conditions and government backing, but face hurdles like disease outbreaks and quality control issues that hinder their export ambitions.
Europe Commercial Seaweed Market
Europe is on a growth trajectory, boasting a 9.48% CAGR through 2031. This surge is fueled by regulatory endorsements for sustainable packaging and pharmaceutical advancements, tapping into the continent's robust bioprocessing expertise. Nordic nations spearhead Europe's cultivation initiatives. Iceland and Norway are pioneering offshore farming systems tailored for challenging marine environments. In contrast, the Netherlands and Germany are advancing land-based cultivation methods, ensuring year-round yields. The European market's stringent quality and traceability standards command premium pricing, creating entry barriers. Yet, compliant suppliers enjoy lucrative margins. Policymakers are also recognizing seaweed's role in carbon sequestration, weaving it into broader blue economy strategies, solidifying Europe's growth narrative.
North America Commercial Seaweed Market
North America is making waves, especially in specialty applications and tech innovations. The U.S. is leading the charge, pouring USD 25 million into offshore seaweed biomass ventures and setting up cutting-edge processing hubs in Maine and Alaska. Canada champions sustainable harvesting, forging partnerships with indigenous communities. Meanwhile, Mexico reaps benefits from Ocean Rainforest's strategic takeover of Alamarsa, ushering in advanced cultivation methods to Latin America. With vast coastal territories ripe for cultivation and a burgeoning appetite for natural food ingredients, North America's growth horizon looks promising.
Note: Regional shares of all individual regions will be available upon report purchase
Regulatory Landscape
International food standards and additive specifications are tightening around edible seaweed and seaweed-derived ingredients, which raises the compliance bar for exporters and processors. At the Codex Alimentarius CCFFP37 session (April to May 2026), members agreed to convert the existing regional standard for laver products into a worldwide Codex standard and started work toward a broader group standard for seaweed plus a code of practice for production, creating a clearer route toward harmonized trade requirements.
In the European Union, seaweed supply chains intersect both food law and additive law. Commission Regulation (EU) 2026/196 (adopted January 2026) updates technical specifications for several food additives, including carrageenan (E 407), with compliance changes taking effect by August 18, 2026, which affects seaweed hydrocolloid processors and food manufacturers using these ingredients. In parallel, edible seaweeds with limited EU consumption before 1997 fall under the Novel Food framework (Regulation (EU) 2015/2283), with EFSA continuing to evaluate safety dossiers for traditional seaweed foods, including its 2025 assessment of Durvillaea incurvata. In the United States, FDA oversight generally treats raw seaweed as a raw agricultural commodity under 21 CFR Part 117 (cGMPs), while widely used seaweed-derived food additives, including carrageenan under 21 CFR 172.620 and 172.625, remain regulated through additive-specific provisions, shaping documentation, testing, and labeling practices for ingredient suppliers serving US food and nutraceutical customers.
Value Chain Analysis
The commercial seaweed value chain typically runs from seedstock and farming inputs (spores/seedlines, ropes/longlines, offshore or near-shore infrastructure, labor and vessels) to cultivation (aquaculture-dominant systems plus selective wild harvest), then to rapid post-harvest handling and stabilization (washing, dewatering, drying, or chilling/freezing), primary processing (milling and grading for food formats), and secondary processing into extracts (agar, carrageenan, alginate and other fractions). Finished outputs move through ingredient distributors and manufacturers into end markets including food and beverages, dietary supplements, pharmaceuticals, animal feed and pet food, and cosmetics and personal care. The chain is highly concentrated upstream, with Asia producing about 98% of farmed seaweed, while downstream demand is more geographically diversified, increasing the importance of export logistics and standardized specifications.
Key value-chain constraints sit in the "missing middle" between farms and industrial users: wet biomass often needs stabilization within hours, and many producing areas have limited nearby drying/extraction capacity and cold-chain coverage, which can translate into inconsistent quality for downstream formulators. This is prompting more vertical integration and localized processing investments, illustrated by processor-side capacity moves and infrastructure builds, including Seaweed Enterprises establishing a UK processing hub in Fife in July 2026 after acquiring assets of Mara Seaweed, and by moves toward controlled production systems to smooth seasonality, including CJ CheilJedang announcing plans in June 2026 for a land-based seaweed farming facility in Cheonan to support year-round supply for its Bibigo brand. For higher-value applications, manufacturers increasingly prioritize traceability and repeatable functional performance, which increases the emphasis on standardized drying/handling protocols and quality-management systems at the processor stage.
Competitive Landscape
The commercial seaweed market is characterized by a moderately fragmented competitive landscape, with the presence of numerous regional and international players operating across cultivation, processing, and distribution stages. Market participants range from large-scale aquaculture companies to small and medium-sized producers specializing in niche or specialty seaweed products. The diversity of applications across food and beverages, pharmaceuticals, agriculture, and personal care industries has enabled multiple companies to coexist without a single dominant market leader. Regional producers, particularly in Asia-Pacific, maintain strong positions due to established cultivation infrastructure and favorable coastal conditions. At the same time, emerging players are entering the market by focusing on value-added products and sustainable production practices. This fragmentation encourages continuous innovation and product differentiation among competitors.
Competition within the market is largely driven by product quality, pricing strategies, processing capabilities, and access to reliable raw material sources. Companies are investing in advanced cultivation technologies and processing methods to enhance yield, maintain consistency, and meet evolving regulatory standards. Strategic collaborations, partnerships, and long-term supply agreements with food manufacturers and ingredient suppliers have become common approaches to strengthen market positioning. In addition, players are increasingly expanding their product portfolios to include organic, clean-label, and functional seaweed ingredients to cater to changing consumer preferences.
Furthermore, sustainability and environmental responsibility have emerged as key competitive factors shaping the market landscape. Companies are emphasizing eco-friendly farming practices, traceability, and responsible harvesting methods to align with global sustainability goals and regulatory expectations. Investments in research and development are increasing as firms explore new applications for seaweed in biotechnology, nutraceuticals, and agricultural solutions. Smaller companies are gaining market visibility by targeting premium and specialty segments, while larger firms are leveraging economies of scale to strengthen their global presence.
Commercial Seaweed Industry Leaders
-
Gelymar
-
Qingdao Bright Moon Seaweed Group
-
Cargill, Incorporated
-
CP Kelco Inc.
-
Acadian Seaplants Limited
- *Disclaimer: Major Players sorted in no particular order
Commercial Seaweed Market Companies Covered in this Report
- Cargill, Incorporated
- CP Kelco Inc.
- Acadian Seaplants Limited
- Gelymar
- Qingdao Bright Moon Seaweed Group
- Ocean Rainforest A/S
- Algaia SAS
- Marinova Pty Ltd
- Seaweed & Co.
- Tropical Seaweed Research Foundation
- North Atlantic Organics
- Algama Foods
- Eucheuma Seaweeds (India) Pvt. Ltd.
- Mara Seaweed
- Ardith Seaweed Co.
- Kelp Blue
- Red Eagle Seafoods
- GreenWave
- Blue Evolution Seaweed
- Sundial Foods
Market Opportunities and Future Outlook
Upgrading from raw biomass sales to value-added derivatives and standardized ingredients remains a primary commercialization whitespace, particularly where upstream farming is strong but processing capacity is limited. UNCTAD highlighted that in 2025, seaweed derivative trade (carrageenan, alginic acid, agar-agar) represented 68% of the USD 3.9 billion total seaweed export value, underscoring how extraction and refining capacity captures a disproportionate share of export earnings. This points to opportunities for drying, milling, and extraction assets near production zones, as well as partnerships with ingredient distributors that can bring compliant, specification-driven seaweed ingredients into food, nutraceutical, and personal care formulations.
Supply stability and industrial-grade consistency are also emerging investment themes as buyers scale beyond niche uses, with land-based and controlled cultivation models gaining traction alongside offshore systems. CJ Foods disclosed plans in June 2026 to break ground in August 2026 on a commercial land-based gim cultivation facility in Cheonan, South Korea, targeting year-round production, and signaling a pathway for brands and ingredient suppliers to reduce seasonality and quality variability. On the demand and industrial policy side, import-substitution programs create another investment avenue for domestic clusters for hydrocolloids and functional ingredients, exemplified by Russia developing a program to reduce reliance on imported seaweed products (agar, alginates, carrageenans) for food and pharmaceutical industries by 60 to 70% through domestic production clusters. Separately, applied R&D is expanding routes for biorefinery-style utilization and improved project economics, with peer-reviewed work on Ulva ohnoi land-based biorefineries demonstrating a 10,000 kg production model and reporting a 0.91-year payback period and 110% ROI, which serves as a reference point for integrated processing concepts where feedstock access and compliance pathways are in place.
Recent Industry Developments in Commercial Seaweed Market
- June 2026: CJ CheilJedang announced plans to build a land-based seaweed farming facility in Cheonan, South Chungcheong Province, to support year-round production for its Bibigo brand. The move addresses seasonal supply variability and creates a more controlled input stream for consistent food-grade seaweed, strengthening downstream manufacturing reliability.
- August 2025: Seadling opened a second processing facility in Malaysia to expand capacity for fermented seaweed-based functional ingredients used in human and pet nutrition. Additional processing throughput increases supply availability for value-added ingredients and supports faster commercialization beyond raw or minimally processed seaweed formats.
- February 2024: Gelymar entered an exclusive distribution partnership with Univar Solutions for North America covering its Gely Blue seaweed ingredient portfolio. The agreement broadens market access and simplifies procurement for regional formulators by leveraging an established distribution network for specialized seaweed-based ingredients.
Commercial Seaweed Market Report Scope and Research Methodology
Market Definition and Coverage
This market is counted as the commercial value of seaweed that is cultivated or harvested and then sold as food, ingredients, or inputs for downstream industrial use, across the full supply chain from raw seaweed to processed forms traded in bulk.
Scope exclusions: We exclude non-commercial household foraging and lab-scale R&D activity that does not result in marketable volumes.
Segments Covered in This Report
- By Product Type
- Brown Seaweed
- Green Seaweed
- Red Seaweed
- By Flavor
- Plain
- Flavored
- By Form
- Fresh/Chilled
- Frozen/Dried
- By Cultivation Method
- Aquaculture (Farmed)
- Wild Harvest
- By Application
- Food & Beverages
- Dietary Supplements
- Pharmaceuticals
- Animal Feed & Pet Food
- Cosmetics & Personal Care
- Others
- By Geography
- North America
- United States
- Canada
- Mexico
- Rest of North America
- Europe
- Germany
- United Kingdom
- Italy
- France
- Spain
- Netherlands
- Poland
- Belgium
- Sweden
- Rest of Europe
- Asia-Pacific
- China
- India
- Japan
- Australia
- Indonesia
- South Korea
- Thailand
- Singapore
- Rest of Asia-Pacific
- South America
- Brazil
- Argentina
- Colombia
- Chile
- Peru
- Rest of South America
- Middle East and Africa
- South Africa
- Saudi Arabia
- United Arab Emirates
- Nigeria
- Egypt
- Morocco
- Turkey
- Rest of Middle East and Africa
- North America
Data Sources, Market Sizing, and Validation
Desk Research
Desk research was used to map the supply base and the demand pull, before any numbers were modeled. We relied on open sources such as FAO fishery and aquaculture statistics, national fisheries and aquaculture ministries, UN Comtrade trade statistics, and customs tariff schedules to understand volumes and how products move across borders.
To avoid building the model only from production totals, we also reviewed practical signals like food safety and labeling guidance, plus seaweed cultivation and processing research from peer reviewed journals. We included association or cooperative publications where they describe farming practices and yield constraints. Company annual reports, investor presentations, and credible industry press were used to cross-check expansion plans and pricing direction, and then paid subscriptions for company financials and shipment level trade intelligence were used selectively to validate key assumptions where public data was thin. These examples are not exhaustive, and many other public sources were reviewed for data collection, validation, and clarification.
Primary Interviews and Surveys
Primary work focused on interviews and short surveys with seaweed growers, processors, ingredient traders, and downstream buyers in food, supplements, and personal care, since pricing and conversion factors change by species and form. Feedback was taken across major consuming and producing regions so desk estimates could be corrected for processing losses, contract pricing patterns, and the share of output that is actually traded versus used internally.
Distribution of primary research fieldwork respondents
| Company type | Respondent position | Region |
|---|---|---|
| Top tier: 39% | CXOs: 13% | APAC: 43% |
| Mid tier: 45% | Functional/Unit leaders: 28% | EMEA: 31% |
| Smaller Players: 16% | Managers: 59% | Americas: 26% |
Market-Sizing & Forecasting
Sizing started with a top-down reconstruction where production and trade statistics were converted into commercial value using form-level price ranges, conversion ratios (wet to dried and extract yields), and application mix shares gathered from interviews. Once that demand pool was built, it was corroborated with selective bottom-up approximations, such as rolling up a sample of processors and traders by capacity, utilization, and realized selling prices, then scaling with coverage factors.
Key inputs used in the model included harvested and farmed output trends, export and import unit values, processing yield and loss rates, the share of aquaculture versus wild harvest, and price spread by species and end use. When a bottom-up trail was incomplete, gaps were handled with conservative proxy assumptions that were explicitly checked back with multiple interviewees, then adjusted when the implied per-capita or per-industry consumption looked inconsistent.
For forecasting, scenario analysis was used, guided by expected cultivation expansion, processing capacity additions, and demand shifts in food ingredients and hydrocolloids, then stress-tested against trade growth and price normalization paths discussed by market participants.
Data Validation & Update Cycle
Validation was done through triangulation across three layers, production and trade signals, price sanity checks, and interview feedback on what was really transacting in the market. Outliers such as sudden jumps in unit values, unusual yield assumptions, or trade flows that did not match seasonality were flagged and reviewed, and follow-up calls were triggered when the variance could not be explained.
Before sign-off, the full model and assumptions go through a multi-step analyst review so that arithmetic, units, and logic stay consistent across regions and years. Reports are refreshed annually, and interim updates are made when material events occur, such as major policy shifts, capacity announcements, or supply disruptions, followed by a final freshness pass right before delivery.
Mordor Intelligence's Commercial Seaweed Market Estimate Compared With Other Published Estimates
Published market values for commercial seaweed can differ more than people expect, even when the year label looks the same. The gaps usually come from how each study treats processed versus raw seaweed, which applications are counted, and how price is translated across wet, dried, and extract forms.
The main gap comes from whether hydrocolloid ingredient value and multi-step processing uplift are counted beyond farmgate trade, and in Mordor Intelligence's model the totals are built from traded and processed commercial forms using yield and conversion factors that are checked with growers and processors, instead of relying only on harvested tonnage.
Benchmark comparison
| Source | Market Size | Gaps in Research Methodology |
|---|---|---|
| Mordor Intelligence | USD 20.69 B (2025) | |
| Global Consultancy A | USD 10.93 B (2025) | Often closer to a raw or minimally processed trade value view, which can understate the uplift from drying, extraction, and ingredient grade pricing, especially when conversion yields are not applied consistently. |
| Industry Publisher B | USD 19.79 B (2025) | Uses a similar market year but can differ on application scope and price progression, where higher forward prices or a broader inclusion of downstream end uses can raise the total even if volumes are comparable. |
Across the three figures, most of the spread is explained by what is treated as the sellable commercial unit and how prices are mapped from wet biomass into standardized traded forms. When scope and conversion assumptions are stated clearly and checked against real transaction patterns, the resulting total is easier to replicate and use for planning.
Key Questions Answered in the Report
How large will the seaweed market be by 2031?
The commercial seaweed market size is projected to reach USD 32.98 billion by 2031, growing at an 8.08% CAGR from 2026-2031.
Which seaweed product type is expanding fastest?
Brown seaweed is advancing at a 9.87% CAGR thanks to rising alginate demand in plant-based dairy and wound dressings.
Why is animal feed a high-growth application?
Regulatory pressure to reduce methane emissions drives adoption of Asparagopsis-based supplements, lifting the segment at a 9.74% CAGR.
What region shows the quickest revenue growth?
Europe leads regional growth at a 9.48% CAGR, propelled by the EU’s EUR 1 billion Blue Bioeconomy initiative that funds offshore farms.
How dominant is aquaculture in global supply?
Aquaculture accounts for 91.63% of total volume, satisfying traceability rules and enabling controlled year-round production.