
Commercial Satellite Imaging Market Size and Share
Market Overview
| Study Period | 2020 - 2031 |
|---|---|
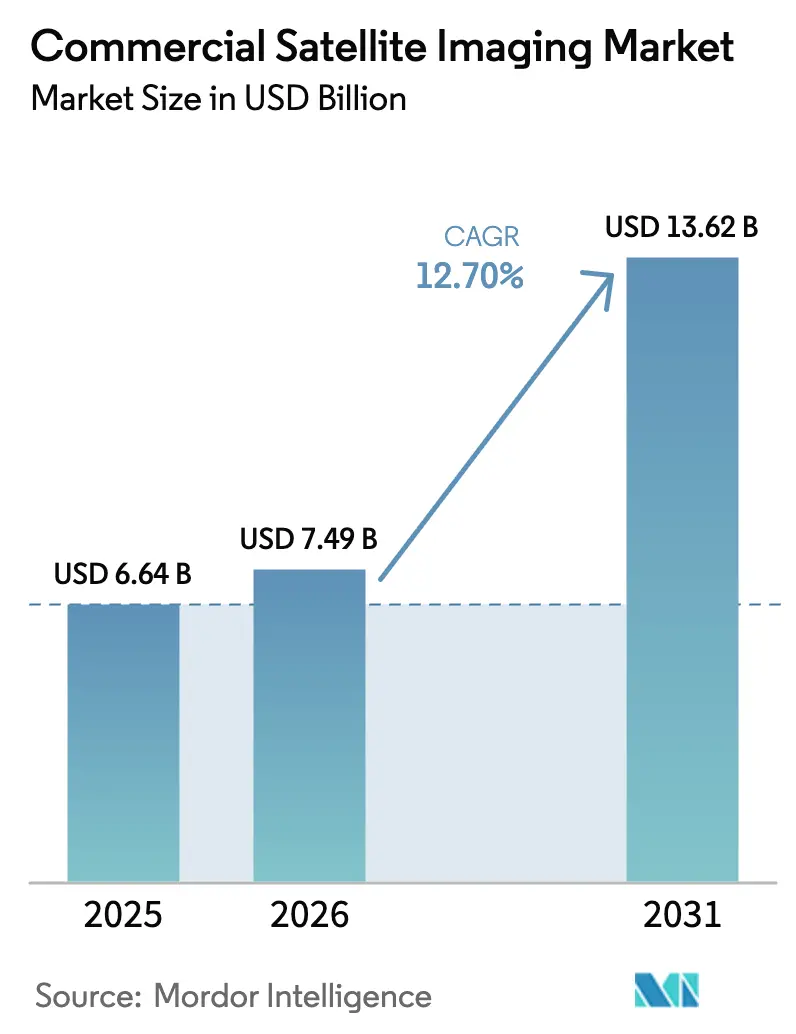
| Market Size (2026) | USD 7.49 Billion |
| Market Size (2031) | USD 13.62 Billion |
| Growth Rate (2026 - 2031) | 12.70% CAGR |
| Fastest Growing Market | Asia-Pacific |
| Largest Market | North America |
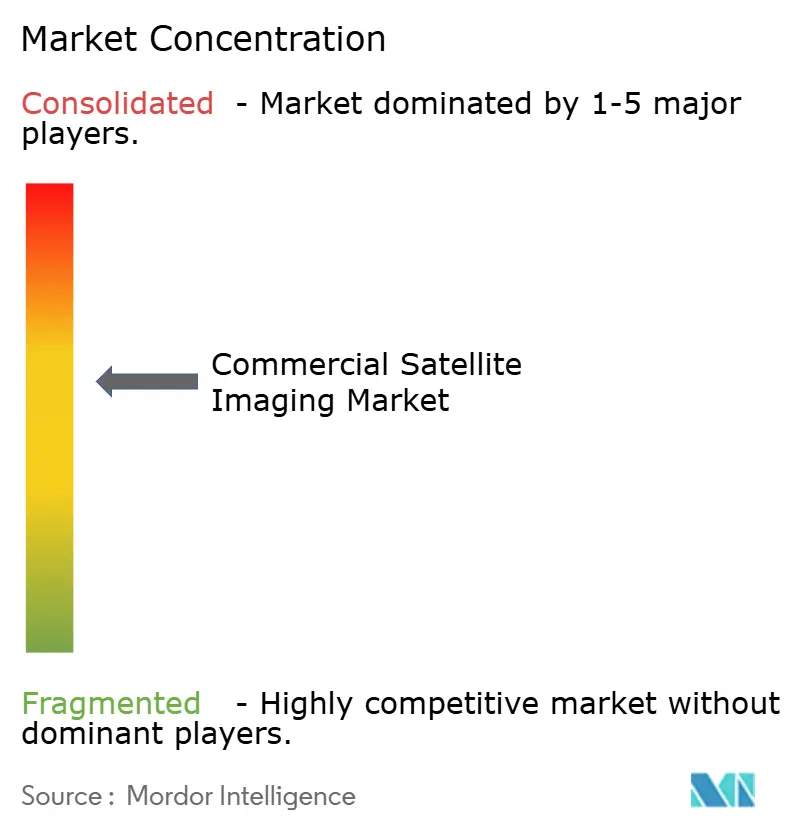
| Market Concentration | Medium |
Major Players *Disclaimer: Major Players sorted in no particular order Image © Mordor Intelligence. Reuse requires attribution under CC BY 4.0. | |
Commercial Satellite Imaging Market Analysis by Mordor Intelligence
The commercial satellite imaging market size reached USD 7.49 billion in 2026 and is projected to attain USD 13.62 billion by 2031, reflecting a 12.7% CAGR. Mandatory methane-emissions verification, AI-driven tip-and-cue tasking, rapid expansion of synthetic-aperture-radar (SAR) microconstellations, and adoption of big-data analytics are reshaping procurement behavior among government and enterprise buyers. Momentum is reinforced by the European Union Methane Regulation, which has converted voluntary monitoring into a compliance obligation across North Sea and Mediterranean basins. Venture-backed operators undercut incumbents on price while delivering higher temporal resolution, accelerating commoditization yet widening the addressable customer base. Rising smart-city projects in Asia-Pacific, persistent Arctic surveillance requirements, and cloud-native analytics subscriptions are broadening use cases and supporting long-run demand elasticity. Capital-intensive constellation builds, data-sovereignty constraints, and orbital-safety bottlenecks, however, continue to strain margins and elongate payback periods, prompting providers to seek differentiated sensor modalities and proprietary analytics.
Key Report Takeaways
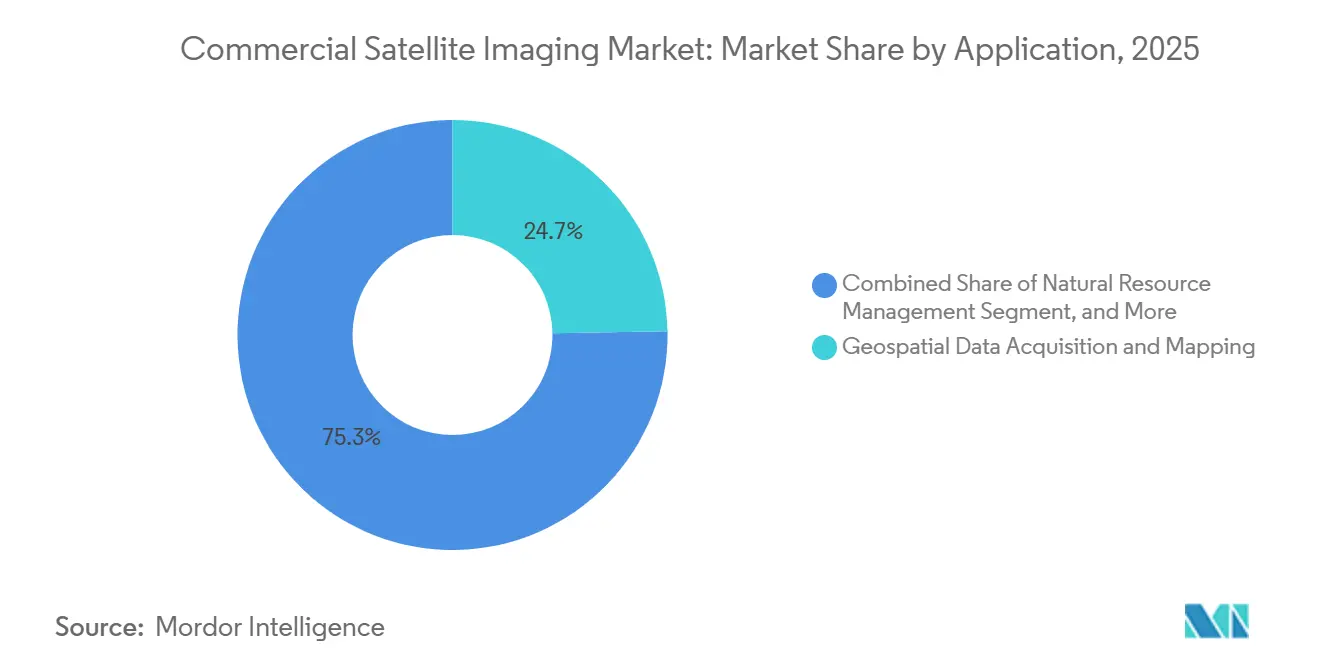
- By application, geospatial data acquisition and mapping led with 24.73% revenue share in 2025; defense and intelligence is forecast to expand at a 13.04% CAGR through 2031.
- By end-user, government agencies held 23.72% of 2025 revenue, while military and defense buyers are projected to grow at 13.11% over the same period.
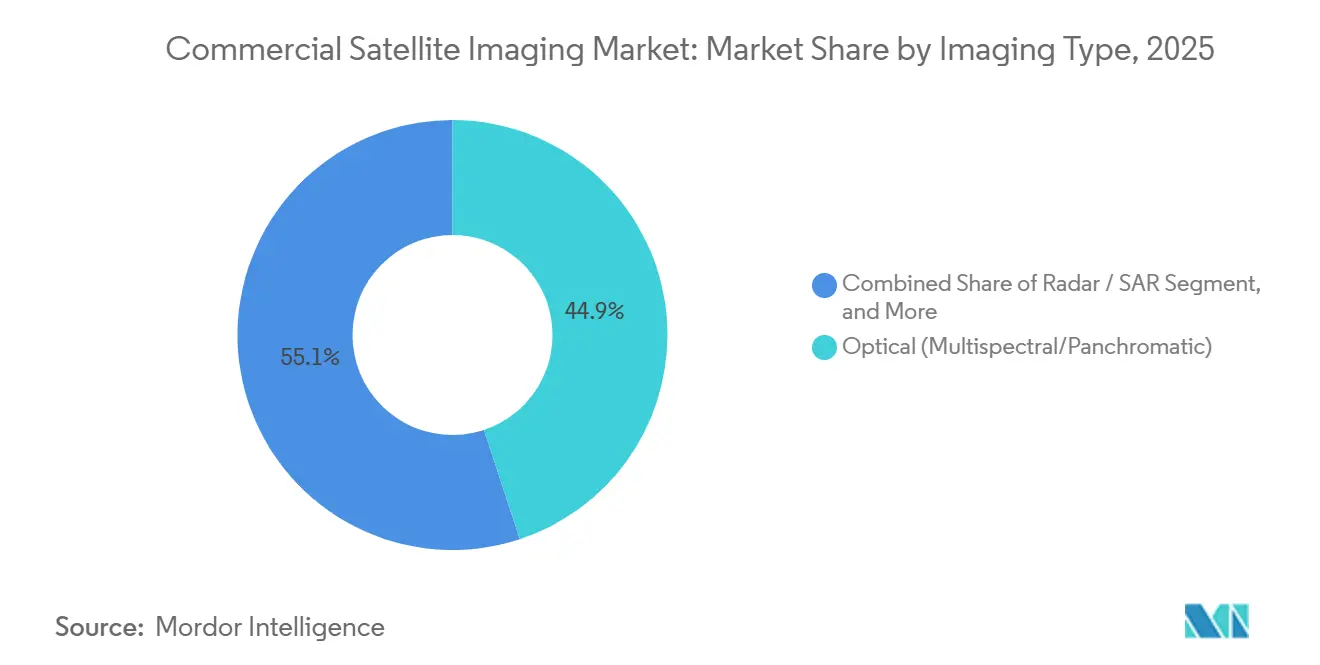
- By imaging type, optical multispectral and panchromatic systems captured 44.92% of 2025 demand; SAR platforms are projected to increase at a 13.78% CAGR.
- By spatial resolution, imagery below 0.3 meters accounted for 43.72% of 2025 sales and is expected to grow at 13.84% through 2031.
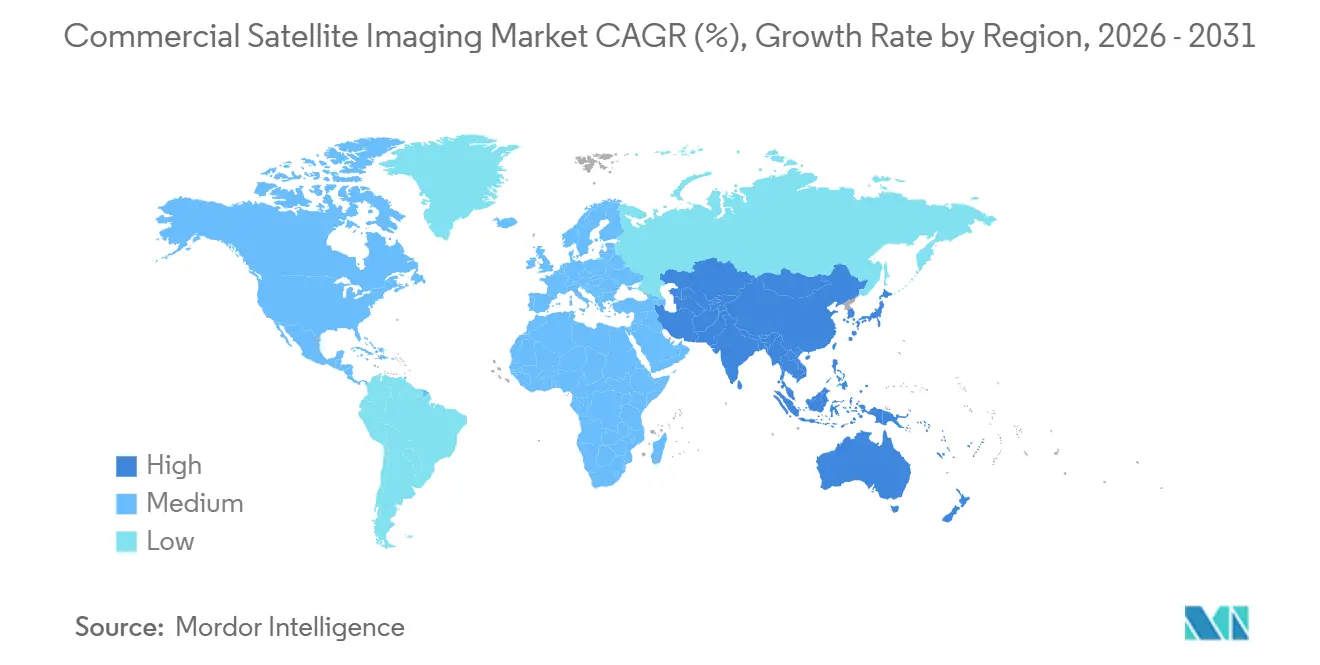
- By geography, North America commanded 38.73% of 2025 revenue, while Asia-Pacific is anticipated to register the fastest 13.67% CAGR to 2031.
Note: Market size and forecast figures in this report are generated using Mordor Intelligence’s proprietary estimation framework, updated with the latest available data and insights as of January 2026.
Market Trends and Insights
Drivers Impact Analysis of Commercial Satellite Imaging Market*
| Driver | (~) % Impact on CAGR Forecast | Geographic Relevance | Impact Timeline |
|---|---|---|---|
| Mandatory methane-emissions verification via satellite (post-2025 ESG rules) | +2.8% | Global, concentrated in North America, Europe, Middle East oil and gas basins | Medium term (2-4 years) |
| AI tip-and-cue tasking driving sub-hour revisit economics | +2.3% | Global, early adoption in United States, Europe, Asia-Pacific defense sectors | Short term (≤ 2 years) |
| Proliferation of SAR micro-constellations enabling all-weather revisit | +2.1% | Global, highest demand in Northern Europe, Canada, Southeast Asia monsoon regions | Medium term (2-4 years) |
| Big-data and imagery-analytics adoption across industries | +1.7% | Global, led by North America and Europe, expanding in Asia-Pacific | Long term (≥ 4 years) |
| Rising smart-city initiatives fueling geospatial demand | +1.5% | Asia-Pacific core, spillover to Middle East and South America | Medium term (2-4 years) |
| Increasing requirement for efficient monitoring of vast land areas | +1.3% | Global, particularly South America, Africa, Australia for agriculture and resource management | Long term (≥ 4 years) |
| Source: Mordor Intelligence | |||


Mandatory Methane-Emissions Verification Via Satellite
Regulatory mandates have transformed satellite imaging from an optional sustainability measure into a compliance necessity. The United States Environmental Protection Agency Super Emitter Program obliges oil and gas operators to respond within five days to third-party satellite alerts that detect discharges above 100 kilograms per hour, redirecting spend from voluntary offsets to contracted satellite services.[1]United States Environmental Protection Agency, “EPA Finalizes Rule on Super Emitter Response Program to Cut Methane Emissions,” epa.gov The European Union Methane Regulation introduced quarterly reporting duties that underpin multi-year subscriptions for dedicated methane-detection constellations.[2]European Union, “Regulation on Methane Emissions Reduction in the Energy Sector,” eur-lex.europa.eu GHGSat operates 17 satellites focused on shortwave-infrared sensing, reducing revisit over major basins to three days. The International Energy Agency projects satellite-verified super-emitter events will halve by 2028, implying sustained demand for high-cadence thermal imagery. Operators in the Permian Basin and North Sea now allocate annual budgets of USD 200-300 million for third-party verification, securing recurring revenue and insulating suppliers from commodity imagery price swings.
AI Tip-and-Cue Tasking Driving Sub-Hour Revisit Economics
Artificial-intelligence tasking shortens the interval between event detection and high-resolution capture, creating near-real-time intelligence value. NASA’s ConstellAI project demonstrated autonomous wildfire monitoring that cues higher-resolution satellites within 30 minutes, cutting latency by 80%.[3]NASA Jet Propulsion Laboratory, “ConstellAI Project Demonstrates Autonomous Satellite Coordination,” jpl.nasa.gov Planet Labs integrates Dove cubesats with SkySat assets to deliver sub-meter imagery inside one hour, a premium service tier priced 40% above daily revisit. United States Space Force contracts illustrate military appetite for AI-driven tasking that supports dynamic targeting. The economic upside arises from fewer unnecessary collects, lower downlink costs, and faster actionable insights, a combination that can cut acquisition cost per intelligence event by roughly 60%. Insurance underwriters, emergency-response agencies, and logistics firms are beginning to replicate defense-grade workflows, signaling broader commercial adoption.
Proliferation of SAR Micro-Constellations Enabling All-Weather Revisit
SAR technology overcomes cloud and illumination limits, enabling persistent coverage in high-latitude or monsoon regions. ICEYE’s 62-satellite fleet images any point every four hours, supporting Arctic monitoring and maritime surveillance. Capella Space operates a 14-satellite network that provides 50-centimeter-resolution data to United States federal agencies in contested theaters. Umbra Lab has achieved 25-centimeter resolution, offering optical-class detail through adverse conditions. Northern European governments integrate SAR feeds into Arctic infrastructure dashboards where optical systems deliver usable imagery less than one-third of the time. Falling launch prices and on-orbit compression have improved SAR unit economics, pushing optical-centric providers toward joint ventures or sensor diversification.
Big-Data and Imagery-Analytics Adoption Across Industries
Value creation is shifting from pixels to analytics-as-a-service. United States National Spatial Data Infrastructure policy requires agencies to procure analysis-ready geospatial products rather than raw scenes, elevating cloud-native providers. NOAA mandates that climate datasets be compatible with Amazon Web Services and Microsoft Azure, spurring investment in automated, scalable processing pipelines. Energy Department initiatives prioritize geospatial analytics for renewable-site planning, driving demand for fused multi-spectral and terrain intelligence. Commercial agriculture is following suit; for example, South American cooperatives purchase crop-stress indices at three-to-five-times the price of equivalent raw imagery. The analytics premium rewards providers with machine-learning pipelines and cross-domain data partnerships, yet raises capital barriers for smaller operators that cannot sustain cloud and talent investment.
Restraints Impact Analysis of Commercial Satellite Imaging Market*
| Restraint | (~) % Impact on CAGR Forecast | Geographic Relevance | Impact Timeline |
|---|---|---|---|
| Capital-intensive constellation deployment and launch costs | -1.9% | Global, acute for venture-backed startups in North America and Europe | Short term (≤ 2 years) |
| Data-privacy regulations slowing commercial licensing | -1.4% | Europe (GDPR), United States (NDAA), China (data-sovereignty laws) | Medium term (2-4 years) |
| High-resolution imagery available from alternative airborne platforms | -0.9% | Regional, concentrated in North America and Europe where drone regulations permit commercial operations | Medium term (2-4 years) |
| Orbital-congestion and spectrum-management bottlenecks | -0.7% | Global, most acute in low Earth orbit bands below 600 kilometers | Long term (≥ 4 years) |
| Source: Mordor Intelligence | |||
Capital-Intensive Constellation Deployment and Launch Costs
Satellite manufacturing, launch, and ground infrastructure consume USD 100-500 million before first revenue, burdening balance sheets. Satellogic disclosed an additional USD 400 million in funding requirements to achieve its 300-satellite vision following a USD 25 million Series D round. BlackSky’s 2024 net loss of USD 48 million, despite top-line growth, illustrates depreciation drag under rapid expansion. Launch remains a gating cost even as SpaceX rideshare pricing approaches USD 1 million per 200 kilograms, implying USD 50 million in lift fees for a 100-satellite network. Insurance premiums add another 10-15%, and on-orbit anomalies can erase years of investment. Venture funding for space technology fell 35% in 2024, forcing operators to prioritize cash preservation and strategic partnerships.
Data-Privacy Regulations Slowing Commercial Licensing
Legislative constraints are elongating sales cycles and complicating cross-border data flows. United States National Defense Authorization Act Section 1260H bars federal agencies from sourcing imagery from vendors with significant Chinese, Russian, North Korean, or Iranian ownership, excluding constellations such as Jilin-1 from western government tenders. The European Union General Data Protection Regulation (Article 6) compels providers to implement automated face- and license-plate obfuscation, thereby inflating processing costs by up to 30%. China’s Data Security Law forces localization of raw geospatial data, delaying foreign licensing by more than a year in some cases. Federal Communications Commission licensing backlogs reached 18 months in 2024, compressing the revenue runway for venture-backed entrants.
*Our forecasts treat driver/restraint impacts as directional, not additive. The impact forecasts reflect baseline growth, mix effects, and variable interactions.
Commercial Satellite Imaging Market Segment Analysis
By Application:
Diversifying Intelligence Spending Outpaces Mapping DemandDefense and intelligence spending is projected to expand at a 13.04% CAGR, reflecting a strategic pivot toward commercial subscriptions that furnish higher revisit rates at lower cost compared with bespoke government satellites. Geospatial data acquisition and mapping, which secured 24.73% of 2025 revenue, remains the largest slice of the commercial satellite imaging market, yet its growth is moderating as global basemap coverage approaches saturation. Surveillance and security contracts across Asia and the Middle East are scaling, favoring SAR and tip-and-cue workflows that deliver actionable intelligence during night or adverse weather. Disaster-relief agencies increasingly integrate ultra-high-resolution captures with drone footage to expedite damage assessments, aligning civil-protection budgets with military-grade imaging standards.
The defense buyer community views commercial feeds as both gap-filler and disrupter, reallocating classified budgets to obtain responsive tasking without lifecycle ownership risk. Intelligence analysts now consume multi-sensor mosaics comprising optical, SAR, and hyperspectral layers stitched in cloud platforms, an evolution that elevates analytics value over raw pixels. Geospatial startups partner with integrators to deliver domain-specific dashboards for border security, maritime domain awareness, and illicit-activity detection. Meanwhile, mapping agencies migrate from periodic nationwide refresh cycles to continuous update models, employing automated change-detection algorithms that flag infrastructure growth, land-use shifts, and environmental compliance violations. These workflows ensure that the commercial satellite imaging market remains integral to governmental modernization even as free public-sector datasets proliferate.


By End-User:
Military Outlays Lead, Civilian Buyers Widen Use-Case PortfolioMilitary and defense entities are forecast to record a 13.11% CAGR, reinforcing their premium-priced weighting within the commercial satellite imaging market. Government civil agencies, holding 23.72% of revenue in 2025, maintain demand for environmental monitoring, cadastral updates, and disaster response, but face budget scrutiny that pressures per-scene pricing. Energy companies have emerged as growth accelerants, purchasing methane-detection and infrastructure-integrity subscriptions that convert compliance pain points into predictable operating expenses. Logistics operators deploy daily imagery for route-optimization and port-congestion forecasting, using AI-derived vessel counts and traffic heat maps. Forestry and agriculture cooperatives in South America buy normalized-difference vegetation index dashboards priced on acreage rather than pixels, creating volume-based but lower-margin revenue streams.
The construction and telecom sectors exploit frequent, medium-resolution imagery for site selection and network coverage planning, particularly in Asia-Pacific smart-city projects. Insurance underwriters embrace edge-processed damage assessments that accelerate claims resolution and reduce fraud. Defense prime contractors integrate commercial feeds into command-and-control software, reinforcing demand for assured-access contracts that insulate providers from commodity cycles. Non-governmental organizations leverage open-source analytics to monitor humanitarian corridors and conflict-zone violations, although these engagements generate limited revenue. Overall, diversification lowers concentration risk while intensifying competition for enterprise accounts, compelling providers to balance high-margin defense deals with scalable civilian volumes.
By Imaging Type:
SAR Acceleration Challenges Optical SupremacyOptical multispectral and panchromatic systems retained 44.92% revenue share in 2025, underscoring their centrality for color-faithful, high-resolution tasks. The commercial satellite imaging market share held by radar and SAR platforms is, however, expanding quickly as customers recognize their all-weather advantage and relatively low incidence of unusable scenes. SAR’s 13.78% projected CAGR reflects fleet expansions by ICEYE, Capella Space, and Umbra Lab, each combining short revisit with improving resolution. Hyperspectral sensors, although nascent, are attracting capital for mineral exploration, crop nutrient analysis, and atmospheric-pollution detection, use cases that optical and SAR cannot unlock. Thermal constellations fill a growing niche in methane leak detection and wildfire early warning, leveraging infrared physics that complement visible and radar modalities.
Platform economics increasingly depend on fusion; buyers seek sensor-agnostic outputs that integrate optical clarity, radar persistence, and spectral depth. This convergence drives alliance formation, as optical incumbents license SAR data, and SAR entrants partner for color layers. Edge computing further differentiates imaging types such as SAR providers compress raw phase history on-orbit, slashing downlink volume, while optical operators run onboard cloud-masking to deliver analysis-ready scenes. The interplay among modalities elevates switching costs and cements multi-sensor procurement as the default architecture for enterprise and government programs.
By Spatial Resolution:
Ultra-High Clarity Commands Premium PricingUltra-high-resolution captures below 0.3 meters, which accounted for 43.72% of 2025 sales, are forecast to grow at 13.84% through 2031, reinforcing their critical role in defense reconnaissance, critical-infrastructure surveillance, and insurance claims validation. Maxar’s WorldView Legion and Airbus’s Pléiades Neo constellations furnish 30-centimeter scenes with daily or twice-daily revisit, setting performance benchmarks for peer providers. High-resolution imagery between 0.3–1 meter remains pivotal for urban planning, right-of-way monitoring, and logistics, balancing cost and detail. Medium-resolution data in the 1–5 meter range dominates agriculture and forestry analytics, delivering field-level insights at cost points acceptable to price-sensitive sectors. Low-resolution scenes above 5 meters continue to lose relevance as Sentinel-2 and Landsat Next raise the free-data performance floor.
Price-performance dynamics increasingly hinge on revisit rather than resolution alone. Defense actors pay premiums for 30-centimeter data refreshed multiple times per day, whereas agribusiness prefers 10-meter imagery every five days if bundled with seasonality models. Providers responding to this spectrum tailor tasking queues, allocating optical apertures to defense windows and dedicating medium-resolution fleets to broad-acre demands. The commercial satellite imaging market thus segments not only by spatial clarity but also by temporal cadence and analytical context.
Geography Analysis
North America Commercial Satellite Imaging Market
North America captured 38.73% of 2025 revenue, anchored by United States government procurement frameworks that guarantee multi-year volume commitments. The National Geospatial-Intelligence Agency’s Commercial GEOINT Strategy diversified suppliers beyond legacy monopolies, channeling funds toward BlackSky, Planet, and Capella feeds. Canada employs SAR imagery for Arctic sovereignty patrols, leveraging ICEYE and MDA services to complement limited icebreaker fleets. Mexico’s metropolitan governments integrate medium-resolution optical scenes into heat-island mitigation programs, signaling spillover demand across the continent. Regulatory clarity under NOAA remote-sensing and Federal Communications Commission licensing has encouraged venture investment, although International Traffic in Arms Regulations still curb high-resolution exports.
APAC Commercial Satellite Imaging Market
Asia-Pacific is projected to grow at a 13.67% CAGR, the fastest among regions. India’s Bhuvan-NICES 2.0 portal combines domestic and commercial data for urban-planning and disaster-relief dashboards. China’s Jilin-1 constellation of 108 satellites supplies sub-meter coverage across Belt and Road corridors, challenging western vendors in Southeast Asian tenders. Japan’s ALOS-4 SAR platform supports national disaster countermeasures and adjacent commercial services. Smart-city network pilots across Indonesia, Thailand, and Vietnam employ daily imagery for flood-risk mitigation, urban-transport modeling, and environmental compliance, translating infrastructural expansion into enduring imaging demand. Currency stability and digital-government mandates further underpin spending momentum.
EMEA and South America Commercial Satellite Imaging Market
European demand benefits from the Copernicus open-data backbone and Common Security and Defence Policy procurements. Germany’s Cartography and Geodesy agency complements Sentinel-1 with commercial SAR as flood events intensify. United Kingdom defense procurement favors regional providers to ensure sovereignty following data-localization debates. France’s CNES co-invests in hyperspectral ventures to support agricultural competitiveness. Elsewhere, Brazil and Argentina leverage vegetation-index analytics for soy and corn production despite macroeconomic volatility. Middle East and Africa growth centers on Saudi Arabia and the United Arab Emirates, where space-agency initiatives channel oil-derived capital into domestic imaging capability.

Regulatory Landscape
Commercial satellite imaging providers operate under tightening remote-sensing and data-governance regimes that affect licensing timelines, allowable performance, and cross-border sales. In the United States, the Department of Commerce, via Commercial Remote Sensing Regulatory Affairs (CRSRA), licenses private remote sensing systems under 15 CFR Part 960 using a three-tier risk matrix (Tier 1 routine, Tier 2 moderate/available, Tier 3 novel/sensitive) and requires annual compliance certifications from licensees. Alongside this framework, the Commercial Remote Sensing Amendment Act of 2025 (H.R. 1325), introduced in February 2025, targets a reduction of NOAA-related license review periods from 120 days to 60 days, reflecting ongoing pressure to streamline approvals while retaining national-security checks.
In Europe, policy is moving toward unified authorization to reduce fragmentation across national licensing regimes for constellation operators and downstream service providers. The European Commission published its proposal for an EU Space Act in June 2025 to harmonize space activity regulation, including authorization for satellite constellations and space services, and the European Parliament adopted revisions to the proposal in March 2026 as negotiations continued. Compliance-led demand is reinforced by methane and ESG-related obligations referenced in the market context, notably the European Union Methane Regulation, which shifts voluntary monitoring toward procurement requirements for verified satellite-based reporting across energy operators.
Value Chain Analysis
The commercial satellite imaging value chain runs from (1) payload and satellite manufacturing and integration, to (2) launch and in-orbit commissioning, (3) ground segment operations (TT&C, downlink, archiving), (4) data processing into analysis-ready products, (5) distribution through APIs, marketplaces, and cloud platforms, and (6) analytics and sector applications such as defense ISR, methane monitoring, maritime domain awareness, agriculture indices, and disaster response. Value capture has shifted downstream as buyers prioritize insights, change detection, and fused products rather than raw scenes, while the proliferation of optical and SAR constellations and the availability of free public datasets compress margins for commodity imagery.
Distribution and analytics layers are increasingly mediated through cloud-native platforms and aggregators that reduce transaction friction by offering multi-sensor catalogs and standardized delivery. Marketplaces and integration platforms (including those aggregating multiple sensor sources) place greater emphasis on interoperability, licensing compliance automation, and scalable processing pipelines suited to enterprise procurement. On the demand side, defense remains a key revenue anchor and a driver of assured-access subscriptions, while regulatory workflows such as methane verification draw imaging providers into recurring monitoring contracts. On the supply side, capital intensity for constellation build-out and licensing backlogs continue to gate expansion, pushing operators toward partnerships, vertical integration, and differentiated modalities (SAR, thermal, hyperspectral) paired with proprietary analytics.
Competitive Landscape
The commercial satellite imaging market exhibits moderate concentration, as the top five players accounted for a substantial portion of 2025 revenue, while more than 60 operators fought for the remainder. Vertically integrated incumbents such as Maxar and Airbus defend their share with deep-queue government contracts and proprietary ground networks. Micro-constellation entrants, Planet, BlackSky, ICEYE, Capella, and Umbra, gain ground by offering higher revisit and usage-based pricing that attract agencies seeking agility. Analytics-first firms like Orbital Insight and SpaceKnow differentiate through machine-learning toolkits that consume imagery from multiple providers, monetizing insights rather than pixels.
Innovation cycles now focus on sensor fusion, on-orbit processing, and automated licensing compliance. Planet’s edge-compute modules cut data volume by 80%, supporting sub-hour delivery of change-detection alerts. ICEYE’s radar beams leverage cloud-based apertures to sharpen resolution without increasing satellite mass, sustaining daily revisit economics. Pixxel’s 150-band hyperspectral cubesats attract mining and agricultural customers whose requirements exceed the capabilities of broadband optical and SAR systems. GHGSat exploits regulatory tailwinds, locking in multi-year subscriptions for methane monitoring under new environmental rules.
Regulation is an emerging moat. Western ownership requirements under United States legislation and European data-privacy rules favor operators with transparent capital structures and automated anonymization pipelines. Chinese, Russian, and Iranian affiliated platforms find themselves restricted from lucrative government procurements, ceding share to compliant western constellations. Margin pressure persists, however, as commodity price erosion in raw imagery outpaces cost declines in launch and manufacturing, compelling providers to upsell analytics, sell capacity wholesale, or specialize in niche spectral bands.
Commercial Satellite Imaging Industry Leaders
Planet Labs PBC
BlackSky Technology Inc.
Maxar Technologies Inc.
Airbus Defence and Space SAS
L3Harris Technologies Inc.
- *Disclaimer: Major Players sorted in no particular order
Commercial Satellite Imaging Market Companies Covered in this Report
- Maxar Technologies Inc.
- Airbus Defence and Space SAS
- Planet Labs PBC
- BlackSky Technology Inc.
- L3Harris Technologies Inc.
- ICEYE Oy
- Capella Space Corp.
- Satellogic Inc.
- Ursa Space Systems Inc.
- European Space Imaging GmbH
- ImageSat International N.V.
- Galileo Group, Inc.
- SpaceKnow Inc.
- SI Imaging Services Co., Ltd.
- Deimos Imaging S.L.U.
- GHGSat Inc.
- Spire Global, Inc.
- Umbra Lab, Inc.
- Earth-i Ltd.
- Capella Federal LLC
- Satellogic USA Inc.
- Orbital Insight, Inc.
- Pixxel Space Technologies Pvt. Ltd.
- Kuva Space Oy

Market Opportunities and Future Outlook
Opportunities are widening as operators turn imagery into higher-margin, decision-ready products and reduce time-to-insight through AI-enabled tasking and analytics subscriptions. Recent industry actions reinforce this shift: in July 2026, MDA Space agreed to acquire a 70% majority stake in CLS (France) for about EUR 567 million, signaling active vertical integration aimed at strengthening downstream analytics and data services. In June 2026, Planet Labs introduced a private beta for an agentic AI application that combines satellite imagery, change detection, and public information via a chat interface, aligning with the broader move away from pixels toward operational workflows for government and enterprise users.
Product whitespace is also forming in new modalities and formats that expand use cases beyond traditional 2D optical basemaps. In July 2026, SatVu began commercial operations for its HotSat-2 thermal imaging satellite, expanding options for heat-based monitoring use cases connected to methane detection and wildfire intelligence discussed in the market context. In July 2026, Vantor (formerly Maxar Intelligence) unveiled WorldView 3D products enabling 50 cm and 15 cm 3D mapping from satellite imagery, adding demand in engineering-grade mapping and infrastructure monitoring where aerial capture has historically dominated. On the distribution side, Esri expanded high-resolution imagery sources (including Nearmap and Airbus) within ArcGIS Living Atlas in July 2026, supporting scaling through embedded access in widely used GIS platforms, while ongoing US licensing modernization efforts under 15 CFR Part 960 and legislative attention to review clocks (H.R. 1325) influence how quickly new imaging capabilities can be commercialized.
Recent Industry Developments in Commercial Satellite Imaging Market
- June 2026: Planet Labs secured an 8-figure contract extension from the US National Geospatial-Intelligence Agency for Maritime Domain Awareness and received a new award tied to crisis-response monitoring. The actions deepen Planet's position in subscription-style government demand where persistent monitoring and rapid tasking economics drive procurement.
- April 2026: BlackSky won a USD 25 million multi-year Assured contract with a major international defense customer for space-based intelligence services. The award strengthens BlackSky's contracted backlog and supports dedicated-capacity offerings that differentiate providers beyond per-scene imagery sales.
- December 2025: ICEYE secured a multi-year EUR 18 million contract with the European Maritime Safety Agency to supply SAR imagery for oil-spill detection and illegal-fishing enforcement. The win highlights institutional demand for all-weather maritime surveillance and reinforces SAR as a core modality for operational monitoring programs.


Commercial Satellite Imaging Market Report Scope and Research Methodology
Market Definition and Coverage
This market covers revenue earned from selling or licensing satellite imagery and related imaging data products to paying customers, where the images are captured by commercially operated earth observation satellites.
Scope exclusions: We exclude imagery generated by satellites that are owned and used only for internal military missions and not sold or licensed externally.
Segments Covered in This Report
- By Application
- Geospatial Data Acquisition and Mapping
- Natural Resource Management
- Surveillance and Security
- Conservation and Research
- Construction and Development
- Disaster Management
- Defense and Intelligence
- By End-User
- Government
- Construction
- Transportation and Logistics
- Military and Defense
- Energy
- Forestry and Agriculture
- Other End-Users
- By Imaging Type
- Optical (Multispectral / Panchromatic)
- Radar / SAR
- Hyperspectral
- Thermal
- By Spatial Resolution
- Below 0.3 m (Ultra-High)
- 0.3 m – 1 m (High)
- 1 m – 5 m (Medium)
- Above 5 m (Low)
- By Geography
- North America
- United States
- Canada
- Mexico
- South America
- Brazil
- Argentina
- Rest of South America
- Europe
- Germany
- United Kingdom
- France
- Italy
- Spain
- Rest of Europe
- Asia-Pacific
- China
- Japan
- India
- South Korea
- ASEAN
- Rest of Asia-Pacific
- Middle East and Africa
- Middle East
- Saudi Arabia
- United Arab Emirates
- Rest of Middle East
- Africa
- South Africa
- Rest of South Africa
- Middle East
- North America
Data Sources, Market Sizing, and Validation
Desk Research
Desk research started with anchoring the demand pool to public earth observation activity, budgets, and mission pipelines, and then narrowing it to paid commercial imagery transactions. Sources used include public materials such as NOAA and USGS remote sensing and imagery program pages, NASA earth science program releases, ESA and Copernicus open data notes for context, and ITU satellite filings to understand orbital and spectrum activity.
To keep assumptions realistic, we also reviewed satellite launch and fleet updates reported in reputable press, company annual reports and investor decks where available, and procurement signals from public tenders and contract notices. When needed, paid subscriptions for company financials and intelligence, news and financials, patent databases, and global contracts and tenders were used to cross-check revenues, partnership timing, and capability claims. These examples are not exhaustive, and many other public sources were reviewed to collect data, validate assumptions, and clarify gaps.
Primary Interviews and Surveys
Primary work focused on confirming what is actually monetized as commercial imagery, how pricing moves by resolution and revisit rate, and where services are bundled with analytics or tasking fees. We spoke with a spread of imagery providers, downstream integrators, and large buyers across civil, enterprise, and security use cases, and then used follow-up checks to confirm regional demand differences and the timing of large contract ramps.
Distribution of primary research fieldwork respondents
| Company type | Respondent position | Region |
|---|---|---|
| Top tier: 26% | CXOs: 14% | APAC: 41% |
| Mid tier: 56% | Functional/Unit leaders: 35% | EMEA: 36% |
| Smaller Players: 18% | Managers: 51% | Americas: 23% |
Market-Sizing & Forecasting
Sizing begins with a top-down reconstruction from earth observation spending pools and commercial procurement signals, which are then filtered to paid imagery and imagery data product revenues. The model is organized around a small set of practical drivers, including satellite constellation additions, usable imaging capacity by sensor type, average price trends by resolution tier, tasking versus archive purchase mix, and demand intensity from defense and intelligence, mapping, energy, agriculture, and disaster response workflows.
Once the totals are built, results are checked with selective bottom-up approximations so we can see if the scale makes sense in the real world. This includes sampled supplier revenue ranges from public filings, a reasonableness check using estimated scenes delivered times typical price bands, and channel feedback on how often analytics is bundled with imagery in large deals. If some revenue sits in blended geospatial contracts, it is allocated using interview-based splits and then stress-tested against contract language and typical deliverables.
For forecasting, scenario analysis is used because the market is sensitive to step changes, such as new satellite launches, contract awards, and policy shifts that speed up adoption. A base case is built from expected constellation growth and demand continuity, and then alternative cases adjust pricing erosion, revisit-rate demand, and public sector budget timing based on what experts consider most likely over the forecast window.
Data Validation & Update Cycle
Validation is done through repeated cross-checks between the model outputs and independent signals, such as launch cadence, fleet capacity statements, government procurement momentum, and observable shifts in end-user adoption. When a number looks inconsistent, the assumptions behind pricing, utilization, or contract timing are revisited, and targeted follow-ups are done with interviewees to understand the variance.
Before sign-off, the full model is reviewed in steps, starting with input sanity checks and moving to year-on-year movement checks at the regional and application level. Reports are refreshed annually, and interim updates are made when material events occur such as major launches, acquisitions, or unusually large multi-year awards. Right before delivery, an analyst makes a final pass so clients receive the latest updated view.
Mordor Intelligence's Commercial Satellite Imaging Market Size Compared With Other Published Estimates
Published market sizes for commercial satellite imaging do not always line up, mainly because different studies draw the boundary in different places and do not treat bundled geospatial work the same way. Differences also show up when the base year is not aligned, when currency conversion timing changes, or when pricing is assumed to fall faster than what current contracts suggest.
By tracking pricing by resolution and tasking frequency, and then separating imagery licensing from adjacent geospatial analytics work, Mordor Intelligence keeps the total tied to what buyers pay for imagery products rather than the broader earth observation value chain. Some estimates also start from earlier base years and then project forward using a single CAGR, which can miss step changes from constellation expansions and large public sector awards that move revenue in jumps.
Benchmark comparison
| Source | Market Size | Gaps in Research Methodology |
|---|---|---|
| Mordor Intelligence | USD 7.49 B (2026) | |
| Industry Research Firm A | USD 5.83 B (2025) | Uses a different base year and typically counts a wider mix of commercial satellite imaging related revenues, which can shift the 2025 starting point versus a 2026 anchored model. |
| Trade Journal B | USD 3.30 B (2021) | Starts from an earlier base year and relies more on a smooth CAGR progression to 2031, which can understate later-year step changes from new satellite capacity and large contract ramps. |
The table mainly shows a year and scope effect, rather than a disagreement that cannot be reconciled. When scope is kept to paid commercial imagery and the timeline is aligned, the spread narrows and the remaining gap is usually explained by pricing curves, how archive versus tasking is handled, and how bundled contracts are split across services.


Key Questions Answered in the Report
What is the current value of the commercial satellite imaging market?
The commercial satellite imaging market size was USD 7.49 billion in 2026 and is on course to reach USD 13.62 billion by 2031.
Which application segment is expanding the fastest?
Defense and intelligence is projected to grow at a 13.04% CAGR, outpacing all other application categories through 2031.
Why are SAR satellites gaining share against optical systems?
SAR delivers day-night, all-weather coverage, and recent micro-constellation launches have cut revisit times to hours, making it attractive for defense, maritime, and Arctic monitoring.
How do environmental regulations influence demand?
Post-2025 methane-emissions rules in the United States and Europe require satellite-verified reporting, driving recurring contracts for dedicated methane-detection constellations.
What is the main barrier to entry for new providers?
Capital-intensive constellation deployment, including manufacturing, launch, and insurance expenses that can exceed USD 100 million before first revenue, remains the primary obstacle.
Page last updated on:






