Market Overview
| Study Period | 2020 - 2031 |
|---|---|
| Base Year For Estimation | 2025 |
| Forecast Data Period | 2026 - 2031 |
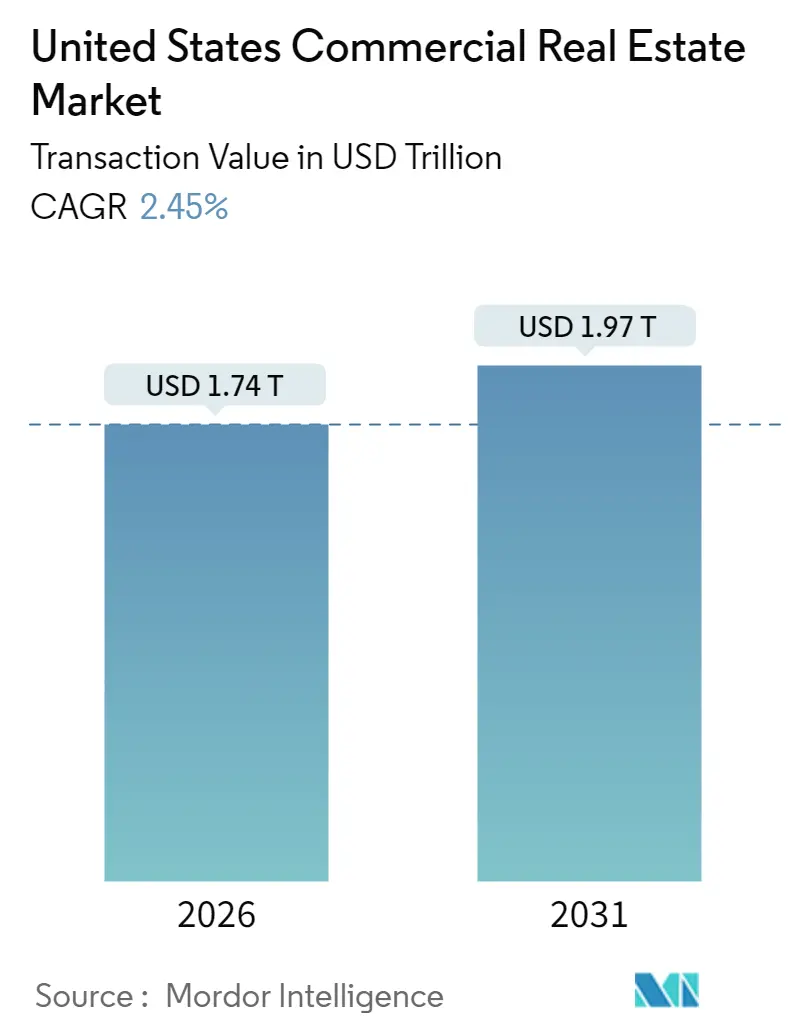
| Market Size (2026) | USD 1.74 Trillion |
| Market Size (2031) | USD 1.97 Trillion |
| Growth Rate (2026 - 2031) | 2.45% CAGR |
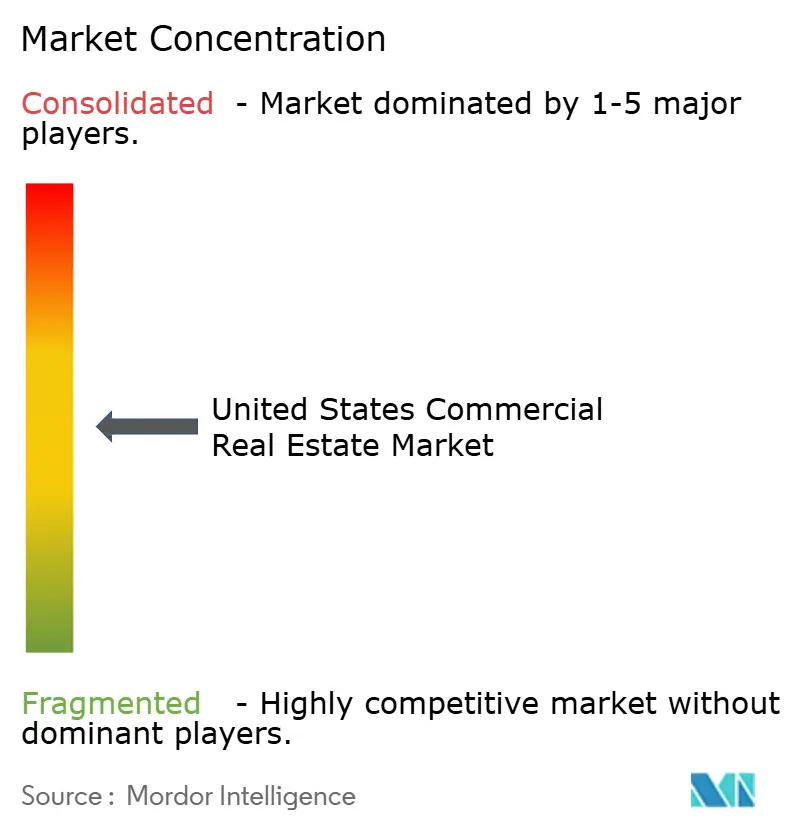
| Market Concentration | Medium |
Major Players *Disclaimer: Major Players sorted in no particular order Image © Mordor Intelligence. Reuse requires attribution under CC BY 4.0. | |
United States Commercial Real Estate Market Analysis by Mordor Intelligence
The United States Commercial Real Estate Market size in 2026 is estimated at USD 1.74 trillion, growing from 2025 value of USD 1.7 trillion with 2031 projections showing USD 1.97 trillion, growing at 2.45% CAGR over 2026-2031.
Stabilizing interest-rate expectations are restoring underwriting confidence, while abundant public-market liquidity enables real estate investment trusts (REITs) to resume debt issuance at favorable spreads. Capital is rotating toward logistics and data-center assets, although elevated office vacancies in Tier 1 cities continue to suppress rent growth. Insurance-premium inflation linked to climate risk is widening return differentials between coastal and inland assets, encouraging portfolio diversification. Forward-looking developers emphasize adaptive-reuse projects and AI-enabled building systems that lower operating costs and attract technology-sensitive tenants.
Key Report Takeaways
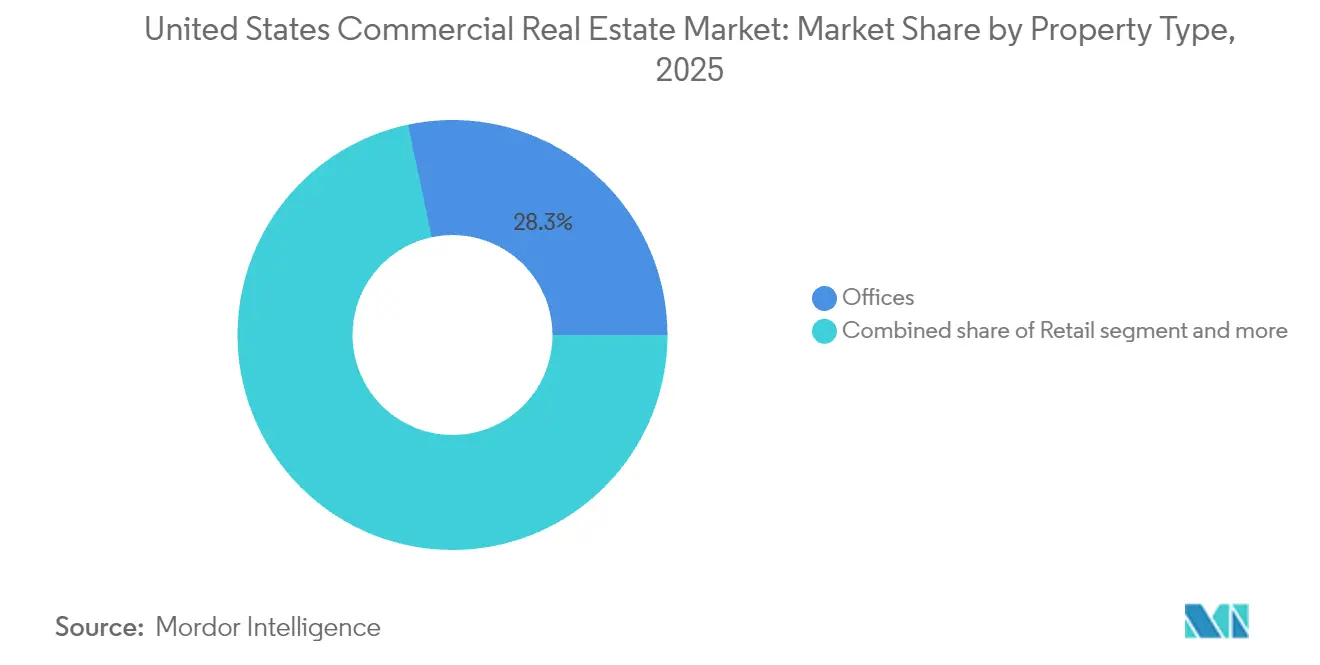
- By property type, logistics captured a 3.92% CAGR growth, the fastest within the portfolio, while offices retained a 28.32% revenue share of the US commercial real estate market in 2025.
- By business model, rental structures held a 68.20% share of the US commercial real estate market size in 2025; sales transactions are projected to advance at a 2.84% CAGR through 2031.
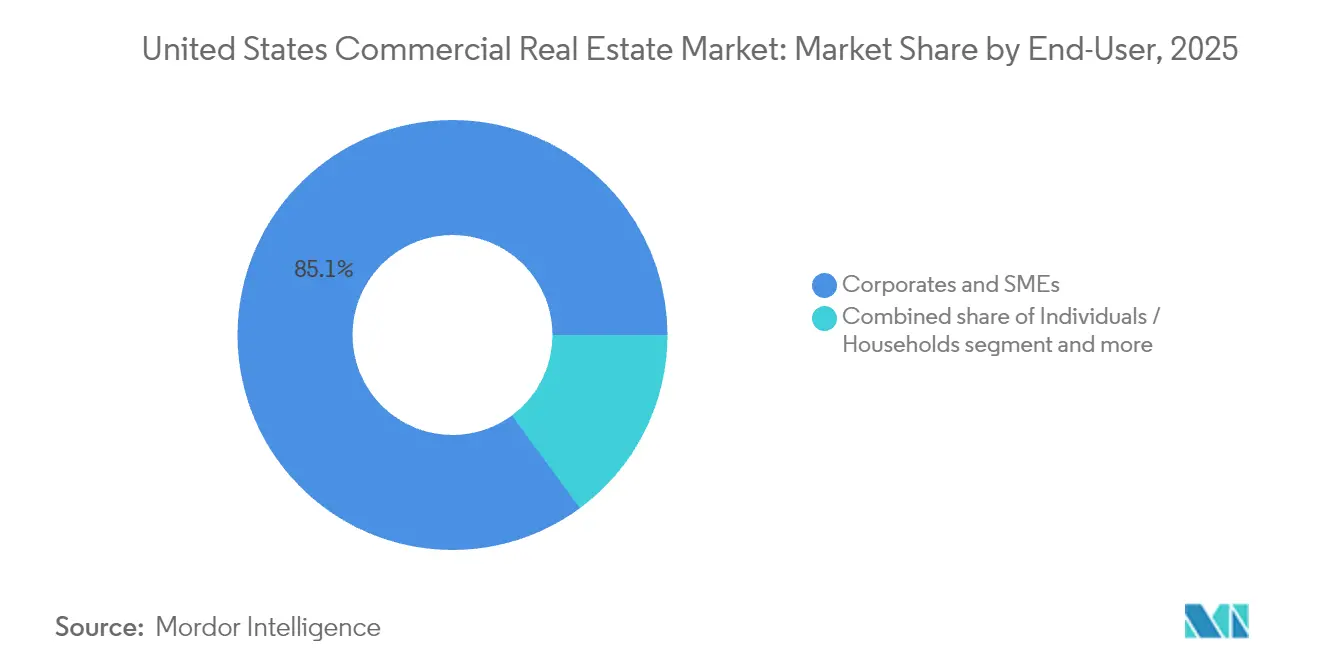
- By end-user, corporates and SMEs commanded 85.10% of the US commercial real estate market share in 2025, whereas individual and household users are expanding at a 3.55% CAGR through 2031.
- By geography, California led with 18.60% revenue in 2025, while the Rest of US category is poised to grow at a 5.55% CAGR to 2031.
Note: Market size and forecast figures in this report are generated using Mordor Intelligence’s proprietary estimation framework, updated with the latest available data and insights as of January 2026.
United States Commercial Real Estate Market Trends and Insights
Drivers Impact Analysis
| Driver | % Impact on CAGR Forecast | Geographic Relevance | Impact Timeline |
|---|---|---|---|
| Normalization of interest-rate expectations | +0.8% | National, with early gains in gateway cities | Medium term (2-4 years) |
| Resurgent REIT capital inflows | +0.6% | National, concentrated in institutional-grade assets | Short term (≤ 2 years) |
| Accelerating e-commerce & 3PL demand for logistics space | +0.4% | National, with emphasis on distribution hubs | Long term (≥ 4 years) |
| AI-optimized workplace re-configurations | +0.3% | National, led by technology corridors | Medium term (2-4 years) |
| Secondary-market liquidity for LP stakes in private real-estate funds | +0.2% | National, focused on institutional markets | Long term (≥ 4 years) |
| Source: Mordor Intelligence | |||
Normalization of Interest-Rate Expectations
Federal Reserve signaling has ended the volatility that constrained deal flow, and transaction volumes are projected to rebound to USD 322 billion in 2024 and USD 387 billion in 2025. Cap-rate expansion is slowing as financing costs stabilize, enabling value-add sponsors to model renovation budgets with greater certainty. Gateway-city Class A properties are again priced on forward cash-flow metrics instead of distress discounts, although secondary markets still command premium risk spreads. Lenders’ willingness to fix terms for five-to-seven-year paper supports bridge-loan takeouts and mezzanine recapitalizations. The shift from crisis-mode capital preservation toward strategic deployment underpins moderate yet durable growth in the US commercial real estate market[1]Jerome H. Powell, “Monetary Policy in 2025: Balancing Inflation and Growth,” Federal Reserve Board, federalreserve.gov.
Resurgent REIT Capital Inflows
Nareit data indicate a record USD 42.5 billion in potential debt issuance for 2025 as REITs exploit lower spreads relative to private credit. Blackstone’s USD 10 billion AIR Communities acquisition and a USD 7 billion data-center joint venture illustrate renewed appetite for scale transactions. Public-market access lets REITs arbitrage liquidity by acquiring distressed assets that privately sponsored funds cannot quickly finance. Healthcare and data-center verticals receive disproportionate flows because secular demand for senior living and cloud infrastructure decouples them from GDP cycles. The liquidity advantage is accelerating consolidation, further professionalizing asset management across the US commercial real estate market[2]Steven A. Wechsler, “REIT Capital Markets Outlook 2025,” National Association of Real Estate Investment Trusts, nareit.org.
Accelerating E-commerce & 3PL Demand for Logistics Space
Prologis recorded 58 million ft² of lease signings in Q1 2025 and portfolio occupancy of 94.9%. Reshoring initiatives and last-mile distribution pressures push users to pre-lease facilities near population centers despite construction costs topping USD 150 per ft² in key corridors. Automated sortation, cold-chain modules, and electric-vehicle charging bays justify premium rents that outpace headline inflation. Limited land zoned for industrial use constrains new supply, so existing landlords report double-digit mark-to-market spreads at renewal. E-commerce penetration keeps ratcheting higher, anchoring the logistics segment as the structural growth engine within the US commercial real estate market.
AI-Optimized Workplace Re-configurations
Enterprise tenants are deploying AI-driven space-utilization tools that integrate sensors, HVAC automation, and desk-booking analytics to trim energy costs up to 30% while boosting employee satisfaction. Buildings outfitted with these systems secure higher occupancy and can charge technology premiums of 8-12% over comparable spaces lacking digital controls. Owners retrofit lobbies with computer-vision security and dynamic signage, creating interactive tenant experiences that enhance retention. The divergence between smart and legacy offices is widening as lenders apply ESG and technology-readiness screens to underwriting. AI-enabled upgrades, therefore, serve as both a revenue enhancer and a de-risking strategy for participants in the US commercial real estate market.
Restraint Impact Analysis
| Restraint | % Impact on CAGR Forecast | Geographic Relevance | Impact Timeline |
|---|---|---|---|
| Sticky remote-/hybrid-work-driven office vacancy | -0.7% | National, concentrated in central business districts | Long term (≥ 4 years) |
| Elevated debt-service costs & tighter bank underwriting | -0.5% | National, with emphasis on leveraged assets | Medium term (2-4 years) |
| Climate-risk-linked insurance-premium shock | -0.4% | National, concentrated in coastal and wildfire-prone regions | Long term (≥ 4 years) |
| Zoning lag on office-to-mixed-use conversions | -0.3% | National, with emphasis on urban core markets | Medium term (2-4 years) |
| Source: Mordor Intelligence | |||
Sticky Remote-/Hybrid-Work Office Vacancy
Office vacancy is projected to hit 24% by 2026, erasing USD 8-10 billion in annual rental income and endangering up to USD 250 billion of asset value. Long-dated leases signed pre-pandemic are expiring, and tenants are rightsizing footprints to hybrid usage models that require fewer individual workstations. Central business districts reliant on commuter inflows face slow demand recovery and mounting civic-fiscal stress. Adaptive-reuse policies promise relief but entail large capital budgets and zoning approvals that prolong payback periods. Persistent structural vacancy will continue to weigh on growth prospects for the US commercial real estate market until hybrid norms stabilize.
Elevated Debt-Service Costs & Tighter Bank Underwriting
Regional bank retrenchment is forcing borrowers into layered capital stacks comprising senior mortgages, mezzanine debt, and preferred equity, as seen in Net Lease Office Properties’ USD 335 million mortgage and USD 120 million mezzanine package. Debt-service-coverage ratios have compressed, prompting equity infusions that dilute returns. Spreads on floating-rate loans remain wide even after headline yield moderation, reflecting regulatory scrutiny of commercial-real-estate exposure. Non-bank lenders provide rescue capital but at higher coupons and tighter covenants, raising break-even occupancy thresholds. Financing constraints will therefore temper expansion across the US commercial real estate market until credit conditions loosen[3]Janet M. Yellen, “Report on the Financial Stability of U.S. Commercial Real Estate,” U.S. Department of the Treasury, home.treasury.gov.
Segment Analysis
By Property Type: Logistics Outpaces Traditional Sectors
Logistics assets contributed a 3.92% CAGR to the US commercial real estate market between 2026 and 2031, whereas offices maintained the largest 28.32% share in 2025 despite continued demand headwinds. The logistics boom stems from e-commerce growth, supply-chain redundancy mandates, and tax incentives that favor near-shoring, producing sustained pre-leasing momentum even as capital costs rise. Highland prices near intermodal nodes restrict speculative development, allowing landlords to lock in above-trend rent escalations. By contrast, the US commercial real estate market size associated with offices is contracting in absolute square footage as occupancy rationalization offsets modest rent increases at trophy buildings. Tenant preferences are splitting the office universe into tech-ready Class A towers and commodity Class B assets destined for redevelopment, compressing yield expectations across investor classes.
Second-order effects reinforce logistics leadership. Prologis reported cash same-store NOI growth of 4.9% in Q2 2025 and a 53.4% mark-to-market upon rollover, confirming durable pricing leverage. Investors redeploy capital from underperforming office funds toward industrial platforms that bundle development, cold-chain, and automation capabilities. Developers weighing office-to-logistics conversions must navigate structural column spacing, dock-door requirements, and community pushback on truck traffic factors that complicate but do not preclude asset repurposing. Retail centers are stabilizing through experiential offerings and last-mile pick-up hubs, yet vacancy persists among legacy enclosed malls. Hospitality properties rebound on travel recovery, but RevPAR gains vary sharply by metro, underscoring the nuanced allocation required within the wider US commercial real estate market.
Note: Segment shares of all individual segments available upon report purchase


By Business Model: Rental Stability Amid Transaction Recovery
Rental structures accounted for 68.20% of the US commercial real estate market in 2025, underscoring investor demand for predictable income streams during a period of macro uncertainty. Inflation-indexed clauses and net-lease designs pass through operating-expense shocks, preserving owner margins even as utilities and insurance premiums escalate. Corporate tenants favor leases that treat occupancy as an operating expense, prompting build-to-suit developers to deliver turnkey facilities under long-term rental contracts. Meanwhile, the US commercial real estate market size flowing through sales transactions is set to expand at a 2.84% CAGR as price discovery and credit availability improve.
Transaction volume growth remains episodic, clustering around distressed portfolio trades and REIT take-privates when pricing reaches equilibrium. Capital-gains-oriented sponsors face underwriting friction because exit cap assumptions must reflect tighter financing and slower NOI growth. Conversely, long-duration allocators such as insurers and pension funds accept lower initial yields in exchange for contractual escalations, reinforcing rental model dominance. Structured-sale strategies involving partial leasebacks allow owner-occupiers to monetize embedded equity without sacrificing operational control, broadening liquidity avenues within the US commercial real estate market.
By End-User: Corporate Demand Drives Market Fundamentals
Corporates and SMEs supplied 85.10% of demand in 2025, anchoring occupancy trends across premier submarkets. Technology, healthcare, and professional-services firms continue to absorb high-specification space equipped with advanced ventilation, digital connectivity, and wellness certifications. Small-business resilience is fortified by state legislation such as California’s SB 1103, which imposes phased notice periods on rent hikes, thereby supporting tenancy continuity. Individual and household users are, however, the fastest-growing cohort at a 3.55% CAGR, reflecting policy-backed conversion of excess office stock into residential or mixed-use amenity hubs.
Hybrid living-working formats foster micro-retail and coworking nodes within redeveloped assets, broadening foot-traffic diversity. Flexible workspace operators now design suites compatible with day-pass and short-term memberships that appeal to freelancers and satellite teams, expanding addressable demand. Corporate tenants are recalibrating footprints toward collaborative zones and client-facing meeting suites, shrinking dedicated desk ratios. ESG and wellness metrics increasingly inform site selection; landlords integrating energy-efficient retrofits and biophilic design attract longer lease terms and rental premia, reinforcing the adaptive demands shaping the US commercial real estate market.
Note: Segment shares of all individual segments available upon report purchase
Geography Analysis
California retained an 18.60% revenue share of the US commercial real estate market in 2025, supported by technology-sector concentration, aggressive adaptive-reuse incentives, and robust venture-capital inflows. The state’s 30-by-30 plan aims to convert 5 million ft² of surplus office inventory into housing by 2030, accelerating mixed-use densification and alleviating supply-side constraints in urban cores. Wildfire and seismic risks elevate insurance premiums, yet inland metros such as Sacramento and Riverside benefit from migration out of coastal zones, capturing spillover demand for industrial and residential assets.
Texas, Florida, New York, and Illinois each contribute distinctive growth vectors. Texas leverages pro-business tax regimes and diversified energy innovation to attract corporate relocations, although commodity price swings inject cyclical volatility into office absorption. Florida’s population inflow sustains multifamily and logistics uptake, but escalating hurricane premiums threaten asset-level cash flows. New York City’s “City of Yes” reforms permit ground-floor commercial-to-residential conversions, mitigating vacancy while stimulating construction trades. Illinois faces fiscal headwinds that constrain infrastructure upgrades, yet Chicago’s life-science corridor draws specialized lab tenants less sensitive to macro swings.
The Rest of US segment, including Carolinas, Mountain West, and select Midwest metros, is forecast to grow at a 5.55% CAGR, surpassing gateway peers. These markets combine favorable cost-of-living metrics with improving transportation links, enticing both industrial occupiers and remote-first professionals seeking quality-of-life upgrades. State-level zoning flexibility shortens entitlement cycles, allowing developers to respond more quickly to tenant demand. Secondary-market cap-rate spreads of 150-200 bps over coastal comparables continue to lure yield-oriented capital into the broader US commercial real estate market.
Competitive Landscape
Competition in the US commercial real estate market is intensifying around technology enablement, portfolio scale, and ESG credentials. CBRE, JLL, and Cushman & Wakefield lead advisory and property-management segments, collectively servicing assets worth more than USD 5 trillion. CBRE’s USD 400 million acquisition of Industrious expanded its recurring revenue base and created a Building Operations & Experience unit expected to generate USD 20 billion in annual revenue. Institutional landlords such as Equity Residential and Simon Property Group are redeploying capital toward adaptive-reuse projects, while private-equity firms aggregate logistics portfolios to exploit e-commerce tailwinds.
Data-center, life-science, and healthcare facilities command premium valuations due to entry barriers such as power redundancy, biosafety standards, and regulatory licensing. Smaller regional players differentiate via hyper-local relationship networks and specialized service bundles, but must invest in PropTech ecosystems to remain competitive. ESG compliance and climate-risk analytics evolve from optional branding to lender-mandated reporting, rewarding early adopters who integrated carbon-reduction roadmaps into asset strategies.
Market structure remains moderately fragmented; the top five public REITs control under 35% of investable stock, yet rising capital requirements signal future consolidation. Non-traditional entrants, including sovereign wealth funds and insurance companies, favor co-investment platforms with seasoned operators, reinforcing the capital gravity around established managers. Technology-driven efficiency gains coupled with capital-intensive retrofits will likely widen performance dispersion, shaping the next consolidation wave within the US commercial real estate market.
United States Commercial Real Estate Industry Leaders
CBRE
JLL
Cushman & Wakefield
Newmark
Colliers
- *Disclaimer: Major Players sorted in no particular order

Recent Industry Developments
- April 2025: Simon Property Group unveiled a transformation of Smith Haven Mall and announced a premium outlet project in the Nashville metro.
- January 2025: CBRE Group completed the acquisition of Industrious National Management Company for USD 400 million, forming a Building Operations & Experience segment aimed at USD 20 billion in revenue.
- October 2024: San Francisco launched its 30×30 Plan to convert 5 million ft² of office space into residential units by 2030.
- April 2024: Simon Property Group and Brookfield Properties formed a venture, “Phoenix,” with WHP Global to acquire Express Inc. out of Chapter 11 bankruptcy.


United States Commercial Real Estate Market Report Scope
Commercial property refers to real estate used for commercial activities, like offices and large rental residential properties. The owners of these buildings or lands need to pay additional taxes in compliance with the government's policies and laws. These buildings are rented out to generate a profit, either from capital gains or rental income.
The report provides key insights into the US Commercial Real Estate market. It includes the technological developments, the trends, and the initiatives taken by the government in this sector. The report sheds light on the factors driving the market, restraints to the market growth, and opportunities. Additionally, the competitive landscape of the commercial real estate market is depicted through the profiles of key players.
The market is segmented by type (office, retail, industrial, logistics, hospitality, and multi-family) and key city (New York, Chicago, Los Angeles, San Francisco, Boston, Denver, Houston, Phoenix, Atlanta, and Salt Lake City). The report offers the market size and forecasts in terms of value (USD billion) for all the above segments.
By Property Type
| Offices |
| Retail |
| Logistics |
| Others (industrial real estate, hospitality real estate, etc.) |
By Business Model
| Sales |
| Rental |
By End-user
| Individuals / Households |
| Corporates & SMEs |
| Others |
By Geography
| Texas |
| California |
| Florida |
| New York |
| Illinois |
| Rest of US |
| By Property Type | Offices |
| Retail | |
| Logistics | |
| Others (industrial real estate, hospitality real estate, etc.) | |
| By Business Model | Sales |
| Rental | |
| By End-user | Individuals / Households |
| Corporates & SMEs | |
| Others | |
| By Geography | Texas |
| California | |
| Florida | |
| New York | |
| Illinois | |
| Rest of US |


Key Questions Answered in the Report
How large is the US commercial real estate market in 2026?
The sector is valued at USD 1.74 trillion in 2026 and is forecast to reach USD 1.97 trillion by 2031.
What is the expected CAGR for US commercial real estate through 2031?
The market is projected to expand at a 2.45% CAGR over the 2026-2031 period.
Which property type is growing fastest in US commercial real estate?
Logistics properties lead growth with a 3.92% CAGR thanks to sustained e-commerce and third-party-logistics demand.
Why are REITs positioned advantageously in 2026?
REITs hold record liquidity and can issue debt at attractive spreads, enabling them to acquire distressed assets quickly.
Page last updated on:


