
Market Overview
| Study Period | 2020 - 2031 |
|---|---|
| Forecast Data Period | 2026 - 2031 |
| Base Year Market Size (2025) | USD 51.65 Billion |
| Market Size (2026) | USD 56.11 Billion |
| Market Size (2031) | USD 84.91 Billion |
| Growth Rate (2026 - 2031) | 8.64 % |
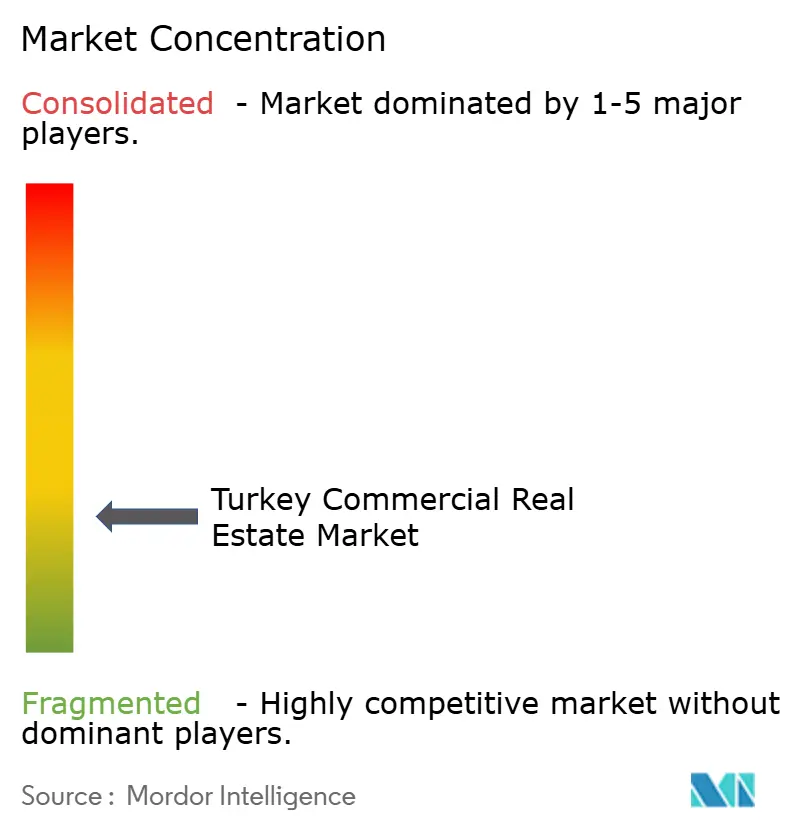
| Market Concentration | Low |
Major Players *Disclaimer: Major Players sorted in no particular order Image © Mordor Intelligence. Reuse requires attribution under CC BY 4.0. | |
Turkey Commercial Real Estate Market Analysis by Mordor Intelligence
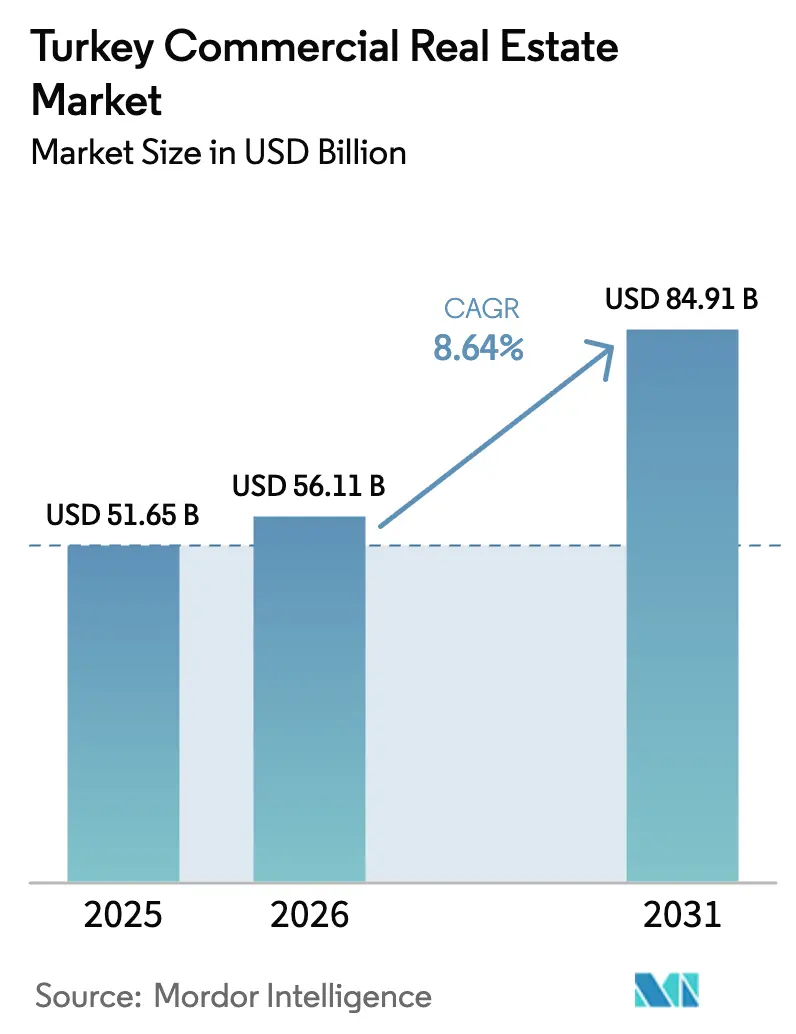
The Turkey Commercial Real Estate Market size is expected to increase from USD 51.65 billion in 2025 to USD 56.11 billion in 2026 and reach USD 84.91 billion by 2031, growing at a CAGR of 8.64% over 2026-2031.
This expansion is underpinned by nearshoring-led manufacturing, e-commerce-driven logistics absorption, and sustained tourism receipts that keep hospitality and retail occupancy elevated[1]. Tight supply of Grade-A assets, currency-hedged lease structures, and seismic-code-compliant redevelopment further bolster rental yields despite a 50% policy-rate environment. Logistics leads all property types in growth as warehouse demand outpaces new completions, while data-center commitments from Google and other hyperscale operators signal rising appetite for digital infrastructure. Fragmented ownership among domestic GYOs, private developers, and global advisory firms keeps competition fluid and transaction pipelines diversified.
Key Report Takeaways
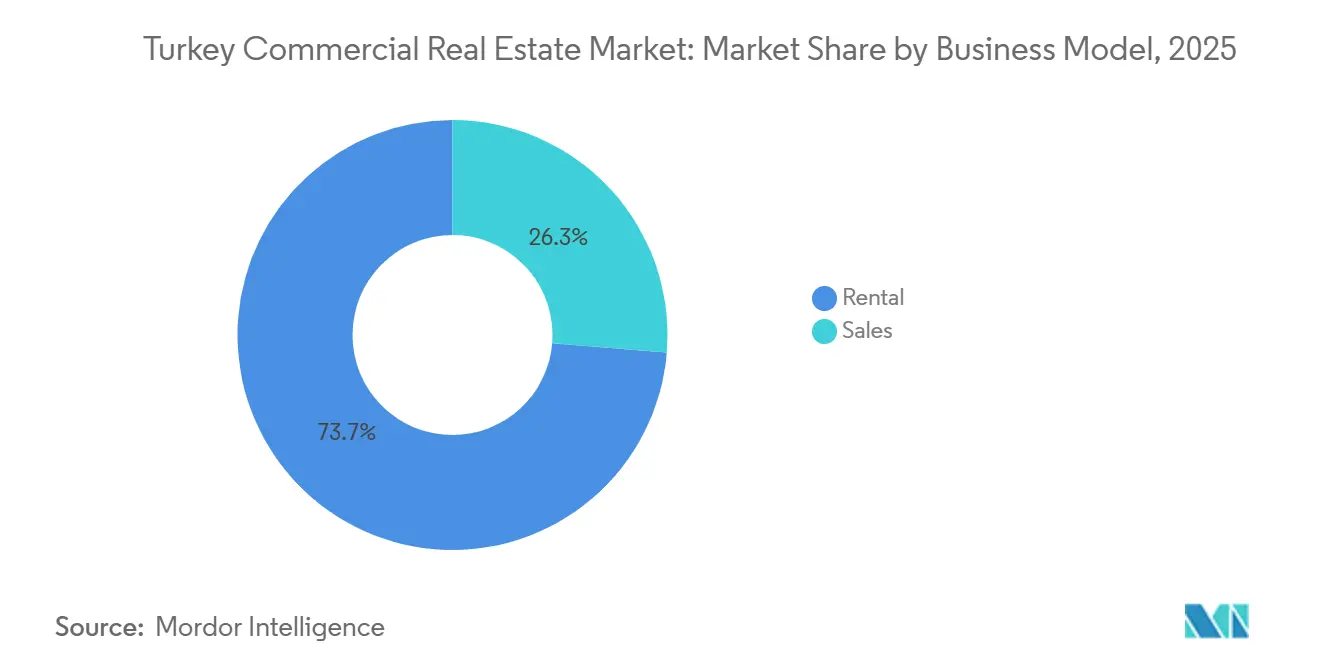
- By business model, rentals captured 73.7% of the Turkey commercial real estate market share in 2025; sales are expected to log the fastest 9.42% CAGR through 2031.
- By property type, retail led with a 37.1% revenue share in 2025, while logistics is projected to grow at a 9.81% CAGR through 2031.
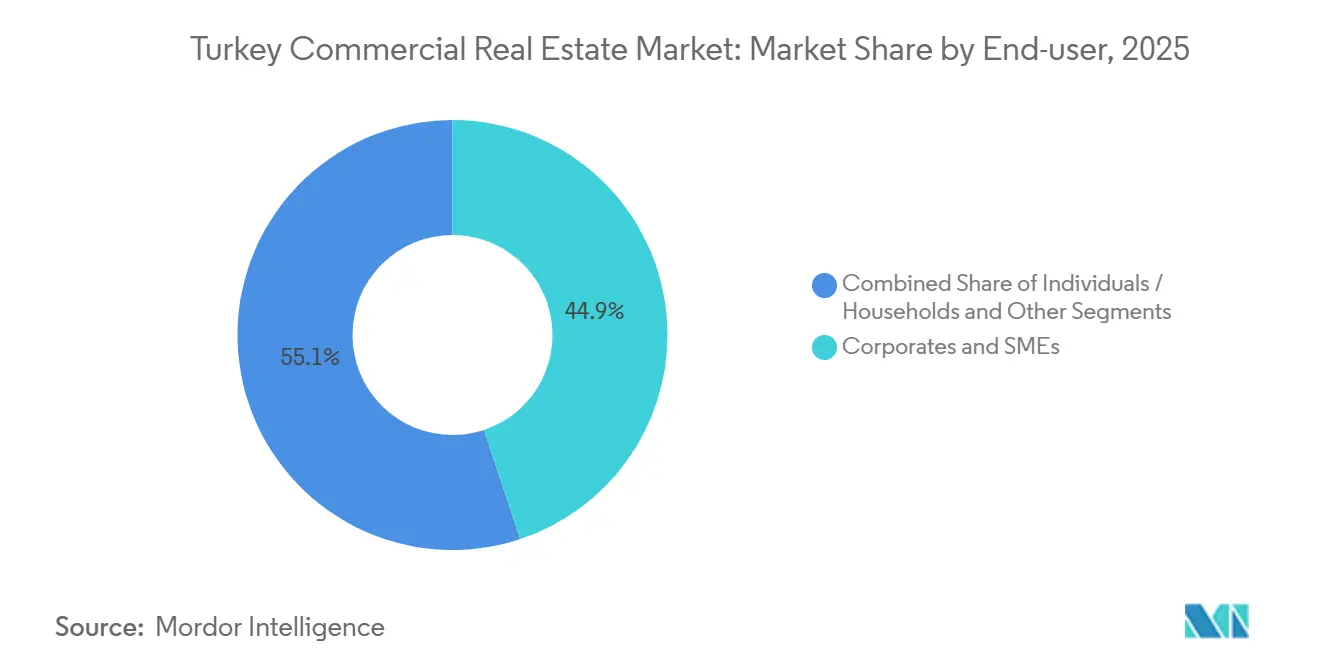
- By end-user, corporates and SMEs accounted for 44.9% of the Turkey commercial real estate market size in 2025; the same cohort is poised for the highest 10.03% CAGR to 2031.
- By city, Istanbul accounted for 37.3% of the value in 2025, whereas Izmir is set to expand at a 10.23% CAGR through 2031.
Note: Market size and forecast figures in this report are generated using Mordor Intelligence’s proprietary estimation framework, updated with the latest available data and insights as of January 2026.
Turkey Commercial Real Estate Market Trends and Insights
Drivers Impact Analysis*
| Drivers | (~) % IMPACT ON CAGR FORECAST | Geographic Relevance | Impact Timeline |
|---|---|---|---|
| Nearshoring and export-led manufacturing boost logistics/industrial demand | +2.1 | Marmara and Aegean corridors | Medium term (2–4 years) |
| Growing e-commerce accelerates modern warehousing and last-mile hubs | +1.9 | National with Istanbul focus | Medium term (2–4 years) |
| Tourism rebound supports hotels, retail, and mixed-use in coastal and heritage cities | +1.8 | Coastal regions and Cappadocia | Short term (≤ 2 years) |
| Urban renewal and seismic-resilient rebuilds create Grade-A development pipelines | +1.6 | Istanbul, Izmir, Bursa | Long term (≥ 4 years) |
| Data centers and business parks benefit from strategic location | +1.2 | Ankara and Istanbul | Long term (≥ 4 years) |
| Source: Mordor Intelligence | |||
Nearshoring And Export-Led Manufacturing Boost Logistics/Industrial Demand
European automakers expanded capacity in Turkey during 2024, prompting a 100% rise in industrial rents as Organized Industrial Zones filled rapidly. Renault’s USD 220 million Bursa outlay lifted EV output and sparked ancillary warehouse leasing within a 100-kilometer radius. Manufacturing FDI climbed 32.5% year-on-year to USD 2.3 billion, diversified across Dutch, German, and U.S. investors. Government policy now targets USD 10 billion per year of fresh FDI, chiefly by enlarging OIZ capacity and streamlining permits. These measures shorten supply chains to Europe, trimming logistics costs up to 18% versus central Anatolia locations.
Tourism Rebound Supports Hotels, Retail, And Mixed-Use In Coastal And Heritage Cities
Tourism receipts hit USD 61.1 billion in 2024 as 52.6 million visitors flocked to coastal resorts and historic districts. Five-star occupancy in Antalya exceeded 85% between May and October, reviving stalled hotel pipelines. Istanbul’s Tersane waterfront melds shopping, dining, and museums across 140,000 square meters to capture visitor spending.[2] Luxury high-street rents on Bağdat Avenue reached USD 250 per square meter per month, a 40% premium over secondary sites. A VAT-exemption program for hotel renovations over 50 rooms accelerates cap-ex cycles and sustains tourism-led demand.
Urban Renewal And Seismic-Resilient Rebuilds Create Grade-A Development Pipelines
Law 6306 mandates demolition of non-compliant stock, generating a multi-decade Grade-A pipeline. ISMEP financing of USD 1.26 billion will retrofit 1,095 public buildings by end-2024. New code compliance adds 15%–25% to costs but secures rent premiums of up to 30% as tenants prioritize safety and insurers lower premiums[3]. Emlak Konut’s USD 150 million Yeni Fikirtepe scheme outlines 11,000 seismically sound units plus retail amenities. Istanbul, Izmir, and Bursa host 70% of transformation sites, setting long-run demand for engineering and materials.
Growing E-Commerce Accelerates Modern Warehousing And Last-Mile Hubs
Online sales jumped to USD 66.6 billion equivalent in 2023, lifting warehouse take-up to 179,700 square meters in H1 2024—a 138% leap. FedEx opened a USD 130 million, 25,000-square-meter hub at Istanbul Airport in September 2025, slicing regional transit times by 30%. Amazon’s Tuzla fulfillment center employs 1,500 staff and handles same-day delivery across Marmara. SMARTIST’s 205,000-square-meter first phase underscores Istanbul’s air-cargo prominence. Government-designated logistics zones supply land 40% cheaper than private sites, catalyzing national distribution footprints.
Restraints Impact Analysis*
| Restraints | (~) % IMPACT ON CAGR FORECAST | Geographic Relevance | Impact Timeline |
|---|---|---|---|
| Currency volatility, high inflation, and financing costs complicate underwriting | -1.5 | Nationwide | Short term (≤ 2 years) |
| Seismic code compliance and construction inflation elevate project budgets | -0.9 | Istanbul, Izmir, Bursa | Medium term (2–4 years) |
| Permitting variability and geopolitical/policy uncertainty extend timelines | -0.7 | National | Medium term (2–4 years) |
| Source: Mordor Intelligence | |||
Currency Volatility, High Inflation, And Financing Costs Complicate Underwriting
The Turkish lira lost 30% against the dollar in 2024 while inflation reached 64.77%, squeezing unhedged returns. A 50% policy rate translates into 55%–65% commercial loan costs, rendering leverage unworkable unless rents reset 40% yearly. Dollar-pegged leases and swaps offset exposure but erode 3%–5% of gross yield spreads. İş GYO and Akfen postponed equity raises after the REIT index fell 18% in lira terms during the first nine months of 2024. Cash-rich conglomerates and sovereign funds thus dominate acquisitions, sidelining highly leveraged private equity.
Seismic Code Compliance and Construction Inflation Elevate Project Budgets
Mandatory seismic isolators and reinforced concrete add 15%–25% to baseline costs, while steel and cement outpaced CPI by up to 15 points in 2024. Retrofitting a 10-story block in Kadıköy can cost USD 800–1,200 per square meter versus USD 600–900 for new builds on vacant land. Permit approvals average 18–24 months in fragmented ownership scenarios, inflating carrying costs and deferring revenue. Insurers now refuse non-compliant buildings, pushing landlords toward upgrades or tenant churn. Smaller developers without deep balance sheets exit or merge, catalyzing consolidation.
*Our forecasts treat driver/restraint impacts as directional, not additive. The impact forecasts reflect baseline growth, mix effects, and variable interactions.
Segment Analysis
By Business Model: Rental Dominance Reflects Yield-Seeking Capital
Rental assets accounted for 73.7% of the Turkey commercial real estate market share in 2025, driven by investors favoring dollar-indexed income streams that protect against lira depreciation. Pension funds and GYOs structure triple-net leases delivering 8%–10% annualized returns on Grade-A offices and malls. The build-to-rent wave is expanding the stock aimed at young professionals as home ownership dips to 58%. Fractional ownership via the August 2025 tradable certificate launch on the USD 1.51 billion Damla Kent project could narrow the rental-sales gap by unlocking liquidity for retail investors. Sales transactions remain smaller but command premiums in luxury coastal enclaves, where Bodrum villas appreciated 12%–18% during 2024.
Sales activity is forecast to grow at a robust 9.42% CAGR, even as it faces headwinds from higher citizenship thresholds and mortgage costs exceeding 30%. Long-run upside exists for sales via digital platforms that shorten settlement cycles and through master-planned communities that offer integrated amenities. Still, rentals will remain the ballast of the Turkey commercial real estate market as institutions prioritize predictable cash flows and dividend visibility.
By Property Type: Logistics Surge Contrasts With Retail Maturity
Retail led the 2025 revenue table at 37.1%, underpinned by 441 shopping centers totaling nearly 14 million square meters of GLA. Yet logistics assets are projected to post the fastest 9.81% CAGR as e-commerce and nearshoring tighten warehouse vacancies. Warehouse rents in Istanbul’s Tuzla corridor doubled year-on-year, while Izmir’s port expansion supports cost-effective distribution into Europe. FedEx’s USD 130 million airport hub and SMARTIST’s scalable air-cargo campus exemplify institutional bets on Turkey’s logistics spine.
Although brick-and-mortar retail faces online cannibalization, experiential formats—cinemas, indoor ski slopes, and food halls—keep occupancy above 95% at flagship centers like Mall of Istanbul. High-street strips in Nişantaşı achieve USD 250 per square meter rents, leveraging tourist luxury appetite. Office demand rebounded strongly, with Grade-A Istanbul occupancy touching a 12-year peak of 89.7% on the back of consolidations into seismic-compliant towers. Data-center and hospitality pipelines diversify the asset mix, ensuring that the traditional office-retail dyad no longer dominates the Turkey commercial real estate market.
By End-User: Corporations and SMEs Lead Occupier Mix
Corporates and SMEs held 44.9% revenue share in 2025, underlining their role as primary drivers of the Turkey commercial real estate market. The country’s 3.5 million registered enterprises, plus USD 1.2 billion in 2023 venture-capital inflows, feed a constant appetite for modern offices, light-manufacturing sheds, and data-center plots. Multinationals rented 60% of Istanbul’s new Grade-A supply in 2024, gravitating to seismic-proof towers with LEED certification that slash insurance costs. SMEs, especially e-commerce startups, favor co-working environments; flexible-space operators expanded footprints by 25% in 2024.
Individuals and households account for a smaller slice but sustain luxury coastal schemes. Bodrum villas appreciated 18% in 2024 after a wave of high-net-worth buyers from Gulf markets piled into branded residences with marina access. Government-subsidized rent support for tech startups under the KOSGEB program nudges SMEs into specialized tech parks in Ankara and Istanbul, reinforcing the forecast 10.03% CAGR for corporate-driven demand. The Turkey commercial real estate market share of corporates is expected to inch higher as crowd-funded certificates begin to finance tenant-specific shells.

Geography Analysis
Istanbul’s 37.3% grip on national value rests on unmatched infrastructure density and deep consumer spending. The city absorbed 138,597 square meters of Grade-A office stock in H1 2024, a 32.9% increase from the prior year, while the Istanbul Financial Center reached full occupancy in its anchor towers, housing the central bank and the capital markets regulator. Prime logistics rents inside the airport corridor doubled as tenants fought for the last developable plots within the third-ring highway. Even so, seismic retrofitting curbs older stock; ISMEP demolished 592 sub-standard buildings by end-2024 and unlocked a USD 1.26 billion pipeline of code-compliant reconstruction.
Ankara, long a bureaucratic town, sharpened its tech profile after Google committed USD 1.2 billion to a data-center campus in Sincan. Office rents at USD 18 per square meter per month offer 60% savings versus Istanbul, prompting state agencies and foreign embassies to pre-lease Grade-A space in Çankaya. Government incentives reimburse up to 50% of rent for startups in the Bilkent and Hacettepe technoparks, meeting SME demand. Meanwhile, Izmir’s 10.23% CAGR outlook reflects the Aegean port expansion that will quadruple container throughput by 2030 and pull in nearshoring manufacturers seeking duty-free land.
Rest-of-Turkey markets exhibit pockets of resilience. Antalya’s 52.6 million national tourist arrivals in 2024 generated USD 61.1 billion in visitor receipts, which spill over into hotel and retail schemes. Bursa’s automotive corridor benefited from Renault’s EUR 200 million plant upgrade, sparking demand for ancillary warehouses within a 100-kilometer radius. Municipal digitization of permit workflows cuts project timelines by 20-30% in the largest metros, but smaller municipalities still struggle with fragmented land titles, sustaining higher carrying costs for developers.
Regulatory Landscape
Turkey's commercial real estate market is governed by a regulatory stack spanning zoning, construction supervision, capital-market oversight, and transaction rules. Urban transformation continues to be anchored in Law No. 6306, and February 2026 amendments to its implementation rules further streamlined transformation processes, including adjustments to contractor collateral ratios for licenses issued from January 1, 2024. Land-development feasibility is also shaped by the Value Appreciation Share framework, updated in April 2025, which sets the public take at 90% of value uplift created by zoning plan changes and formalizes valuation and appraisal committee requirements.
In 2026, transaction and asset operation rules tightened further. April 2026 amendments to the Real Estate Trade Regulation introduced a secure payment system for property sales to align title transfer with payment flow, with mandatory application for sales starting July 1, 2026 under the Ministry of Trade. For managed multi-owner assets, May 2026 amendments to the Property Ownership Law (Law No. 634) limited discretionary increases in site and apartment maintenance fees, linking increases above the revaluation rate to majority approval by the Property Owners Board, which affects budgeting and operating-cost pass-through structures in mixed-use and retail-led sites.
Value Chain Analysis
The Turkey commercial real estate value chain begins with land assembly and zoning feasibility (municipal plan permissions and DAP/value-uplift calculations), moves into project financing (bank debt constrained by high rates, equity through GYOs and partners, and alternative instruments such as SPK-supervised real-estate certificates used in Istanbul's Damla Kent model), and then proceeds through design and permitting (BIM-led design, seismic compliance and supervision). Construction follows, involving general contractors, specialty MEP, and upstream steel and cement inputs. Leasing and brokerage are handled by local and global advisory firms, and the chain ends with property and facilities management, where operational transparency and service-charge governance have gained importance.
Along the chain, compliance capacity and infrastructure delivery are increasingly decisive. Contractor qualification and monitoring are supported by the Ministry of Environment, Urbanization and Climate Change's contractor classification and registry regime (with unique permit numbers accessible via SHANTIYE-M), while site-chief limits and supervision rules target better build quality and lower execution risk. On the demand side, major infrastructure programs raise location value for logistics and business parks: in March 2026 the World Bank approved USD 2 billion financing for the 127 km Istanbul North Rail Crossing (INRAIL), and by May 2026 the project moved into an expression-of-interest stage for consultancy with multiple tender packages, extending the development timeline for industrial, warehousing, and transit-oriented commercial projects around new freight and passenger connectivity.
Competitive Landscape
Competition remains highly fragmented, with the leading GYOs controlling only a modest share of total gross asset value—leaving substantial headroom for industry consolidation. Emlak Konut deploys its tax-advantaged REIT structure to pre-sell residential units that fund mixed-use master plans, while Torunlar leans on mall management to recycle cash into logistics footprints. İş GYO and Akfen delayed 2024 secondary offerings after the REIT index lost 18% in lira terms, underlining the funding squeeze triggered by 50% policy rates. Cash-rich conglomerates such as Orjin Group exploit the gap: its USD 500 million acquisition of 42% of IstinyePark in April 2024 re-priced trophy retail assets north of USD 13,500 per square meter.
Foreign sovereign funds from Qatar, Abu Dhabi, and Kuwait concentrate on income-indexed office and hospitality plays, often teaming with local developers for permitting and construction expertise. Koc Holding’s USD 504 million marina buy in May 2025 diversifies into leisure while locking in dollar cash flows. Private developers Rönesans, NEF, and DAP Yapı increasingly use modular construction and off-site prefabrication to cut build cycles by up to 25%, a tactical hedge against volatile cement prices.
PropTech disruptors add another competitive vector. Tradable real-estate certificates, first issued for the USD 1.5 billion Damla Kent project, let individual investors buy blockchain-recorded slices of rental income, trimming transaction fees to 0.4%. Digital twin platforms that optimize energy use shave operating expenses 8-12%, a selling point for institutional buyers bound by ESG covenants. Consulting majors—Cushman & Wakefield, JLL, Colliers—package these technologies into asset-management mandates, chasing higher-margin advisory fees as pure brokerage spreads compress.
Turkey Commercial Real Estate Industry Leaders
-
Emlak Konut GYO
-
Torunlar GYO
-
Rönesans Gayrimenkul
-
NEF
-
Sinpaş GYO
- *Disclaimer: Major Players sorted in no particular order
Market Opportunities and Future Outlook
A clear whitespace sits at the intersection of seismic-resilient renewal and institutional-grade operations. Law 6306-driven transformation, supported by programs such as ISMEP and reinforced by 2026 implementation updates, keeps a large pipeline of rebuilds and retrofits active across Istanbul and other high-risk metros. That environment creates a workable lane for developers and investors that can package engineering capability, phased tenant decanting, and green-building upgrades into bankable redevelopment packages. The regulatory settings also shape feasibility decisions, since the 90% value appreciation share tied to zoning plan amendments (within the 2025 updated framework) favors projects that align with existing rights, reposition brownfields, or use partnership structures that accommodate the fiscal take.
Mixed-use regeneration and modern retail-led destinations also offer investable openings where tourism and footfall support experiential formats. Istanbul's waterfront reuse projects and large-format mixed-use schemes illustrate that developer appetite is not confined to traditional office or single-use retail. Supply activity is continuing outside Istanbul as well: Maximum Life A.Ş. launched the Maximum Life Eryaman project in Ankara in April 2026, including 38,000 square meters of retail space alongside offices and 900 residential units, and Vakif GYO signed a February 2026 construction contract for the VYeniKonak mixed-use project in Izmir targeting LEED Gold certification. In parallel, June 2026 legislative updates that expanded the regulatory framework for the Istanbul Finance Center reinforce the role of regulated financial-district ecosystems in shaping Grade-A office and serviced retail demand around anchor institutions.
Recent Industry Developments
- June 2026: Emlak Konut GYO completed the issuance of USD 650 million in 5-year lease certificates (sukuk) with a 7.75% coupon and listed them on the London Stock Exchange. The transaction broadened funding options beyond high-cost domestic credit and strengthened the REIT's ability to finance large mixed-use pipelines under tighter local liquidity conditions.
- September 2025: FedEx opened a USD 130 million, 25,000-square-meter hub at Istanbul Airport with a processing capacity of 7,000 packages per hour. The facility increased the attractiveness of the airport corridor for modern logistics real estate by shortening transit times and supporting higher-throughput fulfillment networks.
- October 2024: BLG Capital sold Galataport Istanbul to Dogus Group for USD 2.2 billion, marking one of Turkey's largest property transactions. The deal reset pricing benchmarks for trophy mixed-use waterfront assets and highlighted sustained investor appetite for hard-currency, tourism-linked cash flows in prime locations.
Research Methodology Framework and Report Scope
Market Definition and Coverage
This market is sized as the annual value of commercial property transactions and leasing activity in Turkey, converted into USD for consistent comparison across years, and reflecting demand across major income-producing asset classes.
Scope exclusions: pure residential housing transactions, agricultural land, and undeveloped land without an active commercial use are not counted.
Segmentation Overview
- By Business Model
- Sales
- Rental
Data Sources, Market Sizing, and Validation
Desk Research
Desk research set the base structure for the model and helped anchor the demand drivers that typically move commercial property activity in Turkey. We relied on public macro and sector indicators, such as TurkStat releases, the Central Bank of the Republic of Turkey data, and Ministry of Treasury and Finance publications, to understand inflation, credit conditions, and the investment context.
To connect these signals to real estate, we also reviewed sources such as Land Registry and Cadastre transaction statistics, municipal planning and permitting disclosures where available, and reports from industry bodies and large broker research pages that publish non-paywalled snapshots of leasing and investment trends. Company filings, investor presentations, and audited financial statements for listed developers and REITs were used to sanity-check price assumptions and portfolio growth. In a few cases, paid subscriptions were used for company financials and intelligence, and an import-export shipment-level database was used for construction-related activity checks. The sources listed above are illustrative, and additional public documents and filings were also used for data collection, cross-checking, and clarifying gaps.
Primary Interviews and Surveys
Primary work was used to confirm what is actually transacting versus what is being marketed, which tightened assumptions on occupancy, incentives, and effective pricing. We spoke with a mix of landlords, developers, brokers, property managers, lenders, and large tenants across key Turkish hubs, and we also collected viewpoints that reflect national-level demand.
Where answers diverged, we revisited the model drivers and re-checked inputs like currency conversion timing, lease structures, and the split between investment sales and rental markets, so the final sizing reflects how deals are being priced and closed in the current cycle.
Distribution of primary research fieldwork respondents
| Company type | Respondent position |
|---|---|
| Top tier: 36% | CXOs: 15% |
| Mid tier: 43% | Functional/Unit leaders: 31% |
| Smaller Players: 21% | Managers: 54% |
Market-Sizing & Forecasting
Sizing starts with a top-down build where national transaction and leasing signals are reconstructed into a commercial demand pool, and then translated into USD using consistent currency timing. Once the market total is formed, it is tested with selective bottom-up approximations such as sampled rent multiplied by occupied area checks, and supplier and channel feedback on deal volumes, which are then used to adjust outliers.
Key inputs used in the model include commercial property price movement, leasing absorption and vacancy direction, new supply pipeline and completions, credit availability and commercial loan pricing, foreign investor appetite, and inflation-linked rent behavior where it is common in contracts. For forecasting, scenario analysis is used because interest rates, inflation, and FX shifts can move deal timing sharply, and then the chosen path is validated with expert consensus on the likely leasing and investment recovery pace. When bottom-up indicators are missing for a city or asset type, we fill gaps through proxy metrics like comparable asset yields and observed rent bands, then re-balance the totals back to the national-level demand pool.
Data Validation & Update Cycle
Outputs are validated through multiple checks so obvious breaks are caught early, such as unusually high value per square foot, implausible year-to-year jumps, or mismatches versus known credit and transaction conditions. We also compare results against independent signals like property price index direction, construction pipeline momentum, and disclosed REIT portfolio changes, and then follow up with respondents when a variance cannot be explained.
Before sign-off, an analyst review pass is completed across assumptions, calculations, and narrative logic, and any material change triggers a targeted re-check of the affected inputs. The report is refreshed annually, with interim updates when major policy or macro events materially change financing, FX, or transaction activity, and a final pre-delivery sweep is completed so clients receive the most current view available.
Mordor Intelligence's Turkey Commercial Real Estate Market Size Versus Other Published Estimates
Published numbers for Turkey commercial real estate can look far apart because the market boundary is not treated the same way, and because pricing and currency choices create big swings in USD terms. Differences also show up when some studies blend residential and commercial value, or when they mix investment transaction value with development pipeline value without making the bridge clear.
The spread is often driven by refresh cadence and FX timing, where USD conversion can be taken at a single spot rate or averaged across the year, followed by different treatment of effective rents versus asking rents and vacancy assumptions. By forcing consistent currency timing, re-checking rent and yield inputs against deal feedback, and updating conversion and pricing assumptions as of January 2026, Mordor Intelligence reduces overstatement that can come from stale FX, headline rent use, or untested vacancy levels.
Benchmark comparison
| Source | Market Size | Gaps in Research Methodology |
|---|---|---|
| Mordor Intelligence | USD 51.65 B (2025) | |
| Global Consultancy A | USD 99.10 B (2025) | The figure appears to use a broader regional and end-use scope and can also reflect higher headline pricing and different FX conversion timing, which can inflate USD totals in high-volatility periods. |
| Strategy Consultancy B | USD 61.20 B (2025) | This estimate is presented at an overall real estate level, so the boundary can include adjacent categories beyond commercial property, and the supporting variables for leasing versus investment splits are not clearly separated. |
The table shows that the largest gaps come from scope boundaries and from how rents, prices, and FX are translated into a single USD value for the year. When the same year is restated with consistent conversion timing and deal-tested effective pricing, the market total becomes easier to trace and repeat, which is what users typically need for planning and comparisons.
Key Questions Answered in the Report
How big is the Turkey commercial real estate market in 2026?
It is estimated at USD 56.11 billion in 2026, growing at a CAGR of 8.64% through 2031.
Which property type is growing fastest in Turkey?
Logistics facilities are pacing the quickest expansion, with a forecast 9.81% CAGR driven by e-commerce and nearshoring demand.
Why are rental models favored over sales transactions?
Dollar-indexed leases hedge against lira volatility, provide 8–10% nominal yields, and benefit from tax-exempt dividend rules for GYOs.
What city offers the highest growth rate?
Izmir leads with a 10.23% CAGR outlook thanks to port expansion and lower land costs.
How is seismic regulation influencing development costs?
The 2018 Earthquake Code adds 15–25% to construction budgets, pushing developers toward new builds or JV structures that can absorb the premium.
Who are the leading players in Turkey's commercial real estate?
Emlak Konut GYO, Torunlar GYO, Sinpaş GYO, and Akfen - together holding 26% of gross asset value.