
Market Overview
| Study Period | 2020 - 2031 |
|---|---|
| Forecast Data Period | 2026 - 2031 |
| Base Year Market Size (2025) | USD 9.99 Billion |
| Market Size (2026) | USD 10.72 Billion |
| Market Size (2031) | USD 15.26 Billion |
| Growth Rate (2026 - 2031) | 7.31 % |
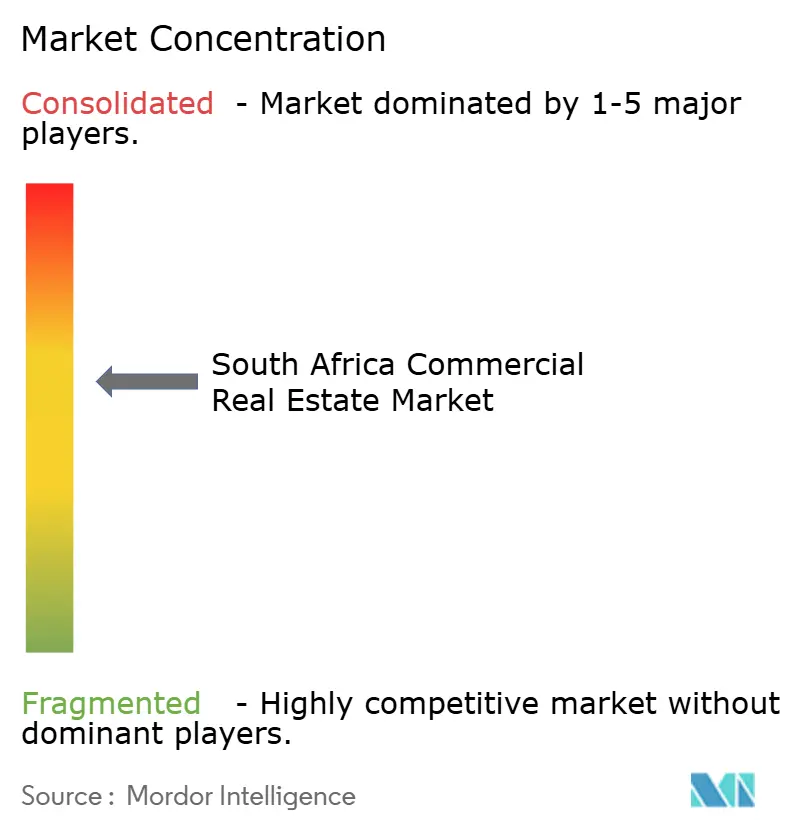
| Market Concentration | Medium |
Major Players *Disclaimer: Major Players sorted in no particular order Image © Mordor Intelligence. Reuse requires attribution under CC BY 4.0. | |
South Africa Commercial Real Estate Market Analysis by Mordor Intelligence
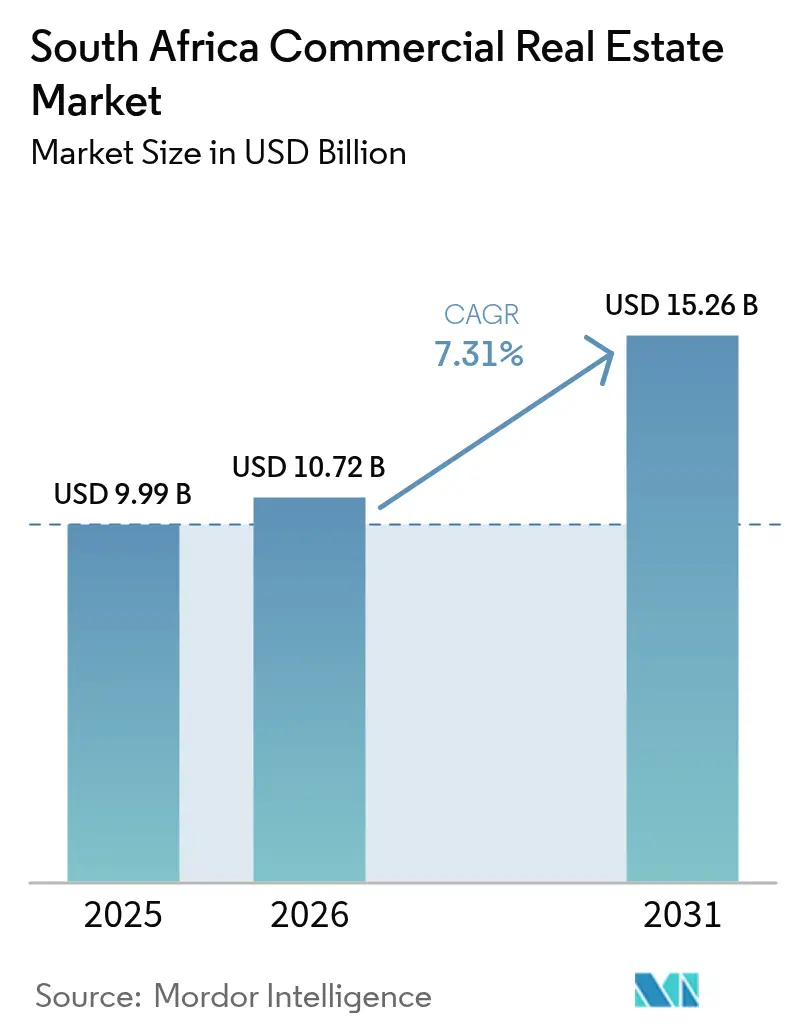
South Africa Commercial Real Estate Market size in 2026 is estimated at USD 10.72 billion, growing from 2025 value of USD 9.99 billion with 2031 projections showing USD 15.26 billion, growing at 7.31% CAGR over 2026-2031. Developers are pivoting toward hybrid facilities that combine warehousing with server capacity as e-commerce and cloud computing converge, while flexible-office providers capture space vacated by traditional tenants adapting to hybrid work. Energy-efficiency mandates and carbon-pricing rules are pushing landlords to retrofit assets, which improves tenant retention and translates into lower operating expenditure amid persistent power-supply instability. As a result, capital flows continue to target certified green assets, even as elevated interest rates keep overall transaction volumes below pre-2020 peaks.
Key Report Takeaways
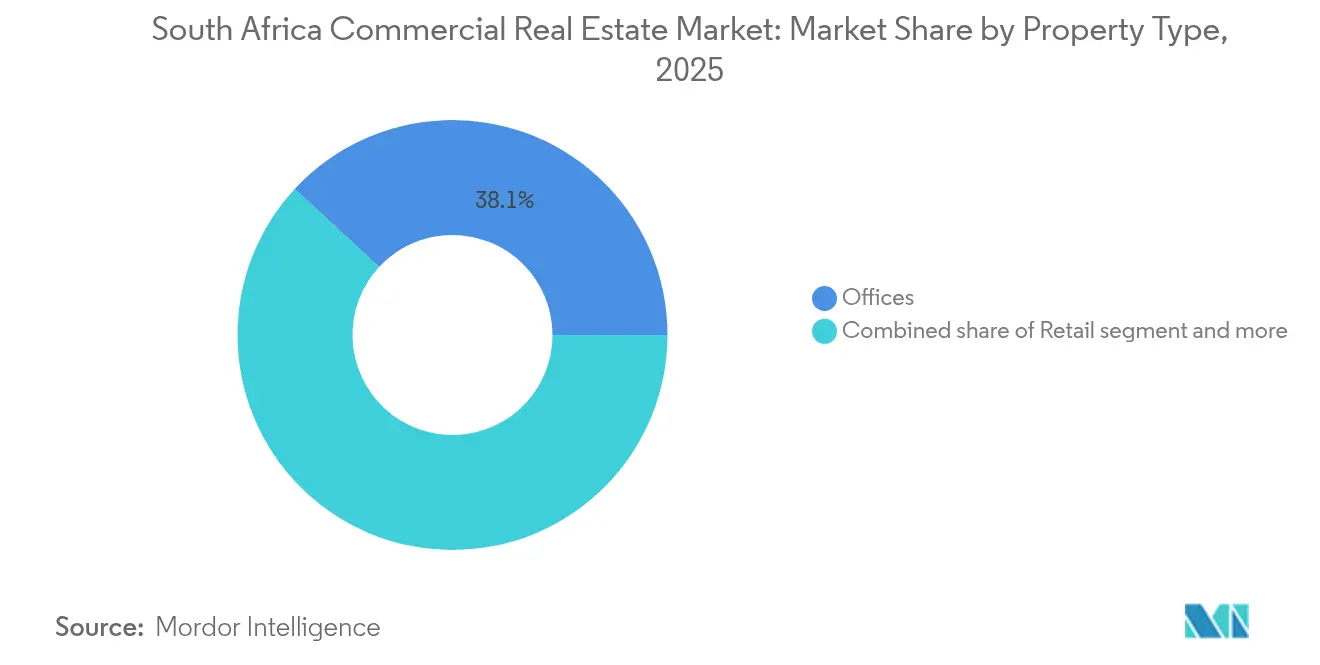
- By property type, the office segment led with 38.12% revenue share in 2025; logistics is forecast to expand at a 9.47% CAGR through 2031.
- By business model, the rental segment held 72.86% of the South Africa commercial real estate market share in 2025, while the sales segment records the highest projected CAGR at 8.37% through 2031.
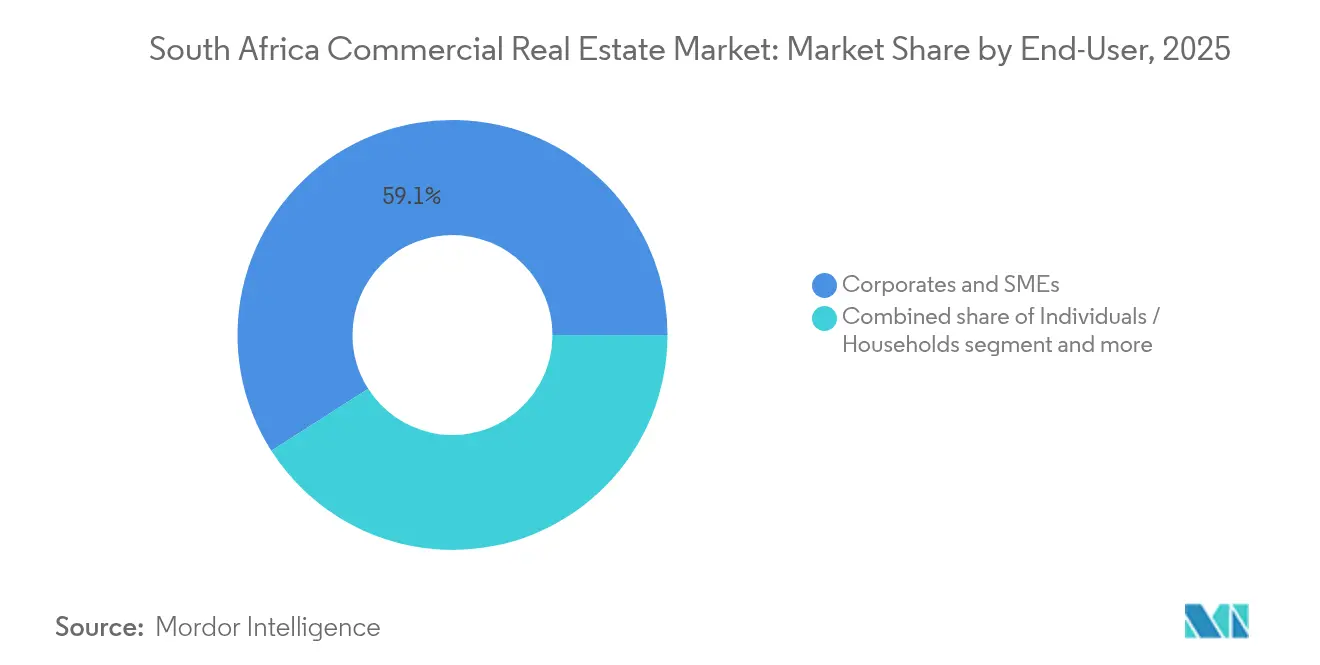
- By end-user, corporates and SMEs accounted for 59.05% of demand in 2025, and individual households are advancing at a 9.05% CAGR to 2031.
- By geography, Johannesburg commanded 35.32% of 2025 revenue, whereas the Rest of South Africa segment is set to grow at a 8.90% CAGR to 2031.
Note: Market size and forecast figures in this report are generated using Mordor Intelligence’s proprietary estimation framework, updated with the latest available data and insights as of 2026.
South Africa Commercial Real Estate Market Trends and Insights
Drivers Impact Analysis*
| Driver | % Impact on CAGR Forecast | Geographic Relevance | Impact Timeline |
|---|---|---|---|
| Urbanization & Population Growth | +1.8% | National (Gauteng, Western Cape, KwaZulu-Natal) | Long term (≥ 4 years) |
| Growing FDI in Infrastructure | +1.5% | Johannesburg, Cape Town | Medium term (2–4 years) |
| Rising Demand from Data-Centers & Last-Mile Logistics | +1.4% | Johannesburg, Cape Town, secondary cities | Medium term (2–4 years) |
| Expansion of Shared Workspaces & Hybrid Offices | +1.2% | Major urban centers | Short term (≤ 2 years) |
| Green-Building Incentives & Energy-Efficiency Mandates | +0.9% | National | Medium term (2–4 years) |
| REIT Tax Reforms Stimulating Investment | +0.8% | JSE-listed markets | Short term (≤ 2 years) |
| Source: Mordor Intelligence | |||
Urbanization & Population Growth
Rapid migration toward Gauteng, the Western Cape, and KwaZulu-Natal keeps occupational demand resilient across offices, light-industrial parks, and convenience retail. Government spatial-planning programs, accompanied by USD 25.89 million earmarked for land acquisition, aim to unlock mixed-use nodes that knit commercial space with affordable housing. These initiatives improve urban land governance and shorten project lead times, which encourages developers to start schemes outside traditional cores. Over the long term, consistent population inflows underpin the South Africa commercial real estate market by broadening the tenant base and lowering absorption risk for new projects.
Growing FDI in Infrastructure
A pipeline of USD 24.72 billion in new infrastructure projects, including USD 5.28 billion in private commitments, is accelerating construction of ports, rail links, and digital corridors. A streamlined approval regime under Infrastructure South Africa has already moved 34 strategic projects, worth USD 15.61 billion, into execution, which directly lifts demand for site offices, warehousing, and accommodation. High-profile technology deployments—such as Google’s USD 1.39 billion cloud region and Equinix’s data-center build—signal confidence in the South Africa commercial real estate market, especially for grade-A campuses that can guarantee redundant power. Medium-term spillovers include stronger rental growth in adjacent micro-markets as multinational suppliers co-locate to leverage clustering benefits[1].
Rising Demand from Data-Centers & Last-Mile Logistics
Africa’s internet economy, forecast at USD 180 billion in 2025, is catalyzing a dual requirement for warehousing near consumption hubs and edge facilities that handle low-latency workloads. Johannesburg alone will add more than 40,000 digital jobs by 2030 on the back of Google’s investment, spurring the construction of cross-docked sheds with expandable power envelopes. Logistics assets in the South Africa commercial real estate market now trade at cap-rate premiums to offices because occupiers sign longer leases to secure tailored fit-outs. Medium-term growth will also emerge in secondary cities as e-commerce platforms chase faster delivery windows, widening the geographic footprint of institutional-grade stock[2].
Expansion of Shared Workspaces & Hybrid Offices
The Remote Work Visitor Visa, open to foreigners earning at least USD 36,165 annually, is drawing digital nomads to Cape Town and Johannesburg. Occupiers are consequently renegotiating lease terms in favor of shorter cycles and higher service intensity, which propels coworking penetration beyond pre-pandemic highs. One-bed apartment rents in Cape Town climbed 28% in 2024 as flexible-office operators absorbed converted residential stock to satisfy hot-desk demand. This structural shift trims long-term space requirements for corporates yet increases take-up of plug-and-play suites that command premium yields. Short-term upside, therefore, persists for landlords that retrofit secondary buildings into adaptable, tech-enabled environments[3].
Restraints Impact Analysis*
| Restraint | % Impact on CAGR Forecast | Geographic Relevance | Impact Timeline |
|---|---|---|---|
| Power-Supply Instability & Infrastructure Deficits | -2.1% | National | Medium term (2–4 years) |
| Economic Uncertainty & Unemployment | -1.6% | National | Short term (≤ 2 years) |
| Regulatory Complexity & Land-Tenure Issues | -1.2% | National | Medium term (2–4 years) |
| Climate Risk & Insurance-Cost Escalation | -0.8% | Coastal areas | Long term (≥ 4 years) |
| Source: Mordor Intelligence | |||
Power-Supply Instability & Infrastructure Deficits
Rolling outages translate into unbudgeted fuel outlays. Stage 6 load-shedding lifted diesel spend for a leading REIT to USD 28,417 per day from USD 9,474 at Stage 2. Retail-linked landlords suffer doubly as generator costs coincide with subdued consumer traffic, compressing net-operating income. The government has allocated USD 12.18 billion for energy assets, yet capacity additions will not materially ease the strain before 2027. In the interim, occupiers gravitate toward buildings with solar arrays and storage, prompting brownfield retrofits but also raising entry barriers for fringe players lacking access to low-cost funding.
Economic Uncertainty & Unemployment
GDP growth remains below 2%, which tempers new-build demand and delays speculative starts. Construction value-added fell to USD 6.11 billion in 2023 from USD 8.33 billion in 2017 as governance gaps and policy ambiguity extended tender cycles. Although the real-estate sector still posted a 3.5% uptick in 2024, credit costs weigh on small-business expansion that traditionally absorbs secondary office inventory. The coalition government’s uneven reform pace erodes confidence, pushing some landlords to prioritize defensive capex over expansionary projects while they await clearer fiscal signals.
*Our forecasts treat driver/restraint impacts as directional, not additive. The impact forecasts reflect baseline growth, mix effects, and variable interactions.
Segment Analysis
By Property Type: Logistics Drives Digital Economy Growth
Logistics assets captured 9.47% CAGR through 2031, outstripping the office segment’s entrenched 38.12% share. This acceleration elevates logistics’ contribution within the South Africa commercial real estate market, especially around data-center clusters where dual-use footprints are emerging. Developers are layering high-density racks above conventional warehousing bays, creating blended facilities that serve both packet traffic and parcel flow. Landlords report pre-let ratios above 70% on such schemes because occupiers value integrated security and power resiliency. Conversely, traditional retail faces churn as anchor grocers evaluate smaller formats, reducing expansion pipelines and nudging owners to explore mixed-use repositioning.
Momentum in certified green projects is strongest in offices where corporate ESG targets drive leasing. Over 2 million sq m of certified space enjoys vacancy rates 350 basis points below the national office average, a metric that continues to support re-rating of prime CBD towers. While hospitality and industrial parks benefit from special-economic-zone incentives, their combined slice of the South Africa commercial real estate market remains modest, though capital appreciation prospects rise near new transport corridors.

By Business Model: Rental Dominance Amid Sales Recovery
Rental income accounted for 72.86% of the South Africa commercial real estate market in 2025 as REIT structures favor predictable cash flows. Embedded escalations averaging 6% mitigate inflation exposure, but higher generator expenses compress distributable earnings, prompting issuers to offer scrip options to preserve liquidity. At the same time, the sales model is reviving with 8.37% CAGR, buoyed by foreign buyers hunting yield pick-up against developed-market compression. Direct deals are clustering around Cape Town’s Atlantic seaboard and Johannesburg’s northern nodes, where infrastructure upgrades link projects to the ring-road network.
The South Africa commercial real estate market size for strata-titled offices and small-bulk warehouses is expanding as owner-occupiers hedge against rent volatility and as remote-work visa holders diversify portfolios. Discounted loan-to-value ratios and flexible mortgage products launched by local banks further lower entry thresholds, pointing toward sustained momentum in secondary sales into 2026.
By End-User: Corporate Demand Meets Individual Investment Growth
Corporates and SMEs held 59.05% of space in 2025, underscoring Johannesburg’s role as the continent’s decision-making center. Yet adoption of hybrid rosters has already trimmed average space per employee by 18%, compelling landlords to invest in amenity-rich environments that preserve footfall. The South Africa commercial real estate market share attributed to individuals is rising fastest, supported by fractional ownership platforms and investment apps that convert large properties into tradeable digital units. Visa-enabled remote workers add long-stay demand for turn-key apartments bundled with coworking access, which further diversifies revenue streams for mixed-use developers.
Government bodies and parastatals within the “Others” bracket sign longer leases that underpin debt service for public-private-partnership assets, though budget volatility can elongate payment cycles. Going forward, new infrastructure concessions are likely to incorporate inflation-linked clauses that protect rental cash flows and stabilize valuations.
Geography Analysis
Johannesburg dominates the South Africa commercial real estate market with a 35.32% revenue share, anchored by Africa’s deepest capital pool and a maturing technology ecosystem. Google’s USD 1.39 billion cloud launch is projected to inject USD 2.1 billion into provincial GDP and create over 40,000 jobs, reinforcing office and logistics take-up along the N1 corridor. The approved extension of the Gautrain will funnel USD 2.56 billion into construction, historically lifting property values near stations by an extra 3% annually. Nevertheless, load-shedding remains acute, forcing developers to integrate on-site solar and battery systems that add 12-15% to project capex.
Cape Town and Durban offer complementary profiles. Cape Town appeals to remote professionals, evident in one-bedroom rent jumps and rising absorption of small-format offices configured for shared use. Durban leverages port upgrades and industrial land banks to attract light-manufacturing tenants, though KwaZulu-Natal’s slower economic recovery moderates speculative building. Port Elizabeth (Gqeberha) anchors automotive export flows and is slated for logistics-park expansion once berth-deepening is finalized.
The Rest of South Africa segment is on track for a 8.90% CAGR through 2031. Government plans to channel USD 20.83 billion into state-enterprise road, bridge, and port projects are opening corridors in Mpumalanga, Limpopo, and the Northern Cape. Spatial-planning reforms streamline land-release processes, enabling private capital to package commercial nodes around service hubs. Institutional investors are already pre-committing to anchor retail and medical facilities in these greenfield districts, betting on first-mover advantages as household formation accelerates.
Regulatory Landscape
South Africa's commercial real estate market operates under a multi-agency framework spanning property intermediation, land administration, and construction compliance. The Property Practitioners Regulatory Authority (PPRA), established under the Property Practitioners Act, 2019, regulates property practitioners and related conduct, shaping transaction processes and consumer-protection requirements across leasing and sales. Land-related legal risk has risen in board-level underwriting due to the Expropriation Act (Act No. 13 of 2024), which formalizes processes for expropriation for public purposes, including a requirement that expropriating authorities attempt to reach agreement with owners before exercising such powers.
Development and delivery are also governed through construction and standards enforcement. The Construction Industry Development Board (cidb) requires contractor grading for participation in public tenders and mandates that government institutions register projects in the Register of Projects, influencing contractor selection and procurement pathways for public-sector-led precincts and transport-oriented schemes. On the technical side, the National Regulator for Compulsory Specifications (NRCS) administers compulsory building specifications and enforces the National Building Regulations and Building Standards Act, while the South African Bureau of Standards (SABS) supports standards and conformity assessment used in building-related compliance and certification. In April 2026, the Department of Human Settlements published the draft Prevention of Illegal Eviction from and Unlawful Occupation of Land Amendment Bill, 2026 for public comment, adding another layer to occupier and land-dispute processes that landlords and developers monitor in CBD repositioning and mixed-use conversions.
Value Chain Analysis
The commercial real estate value chain in South Africa runs from land origination and capital formation through design, construction, letting/sales, and asset operations. Developers and REITs source sites, arrange funding (bank debt, bonds, and equity), and procure professional services (planning, engineering, quantity surveying, and legal) before appointing contractors and specialist trades. Public-infrastructure linkages influence site selection and feasibility, with major schemes clustering around strategic corridors in Johannesburg and Cape Town. At the same time, municipal service reliability, including power and water, increasingly shapes tenant pre-commitments and the resilience capex embedded into base builds.
Construction inputs and logistics remain key pinch points. Building-material availability and pricing volatility flow through to project budgets and timelines, prompting contractors to use dynamic pricing and rise-and-fall provisions. In May 2025, the official construction input price index recorded a 1.3% month-on-month decrease and a 0.3% year-on-year change, but categories such as reinforcing metal work showed sharp swings (down 16.1% year-on-year), highlighting the uneven nature of cost relief across components. On the demand-to-operations side, brokers and leasing teams match occupiers to stock, then property managers and facilities providers run utilities, security, and maintenance. Landlords are accelerating energy and water efficiency measures to manage rising operating costs and load-shedding-linked backup requirements. In industrial and logistics, longer leases and fit-out specificity reinforce a tenant-led development loop, where build-to-suit delivery and lifecycle asset management play a larger role in protecting income stability.
Competitive Landscape
The market remains moderately fragmented, with the five largest landlords controlling roughly 45% of institutionally traded stock. Load-shedding has become the principal cost differentiator: Attacq’s diesel spend escalated to USD 28,417 per day at Stage 6, prompting a pivot toward solar plus storage retrofits that cut annual carbon footprints and attract sustainability-linked debt. Redefine Properties and Oasis Crescent both opted for scrip dividends to preserve cash, while Vukile pursued offshore diversification via its USD 79 million Portuguese purchase.
Digital infrastructure represents a strategic frontier. REITs partnering with hyperscalers to develop edge campuses lock in long-dated triple-net leases that enhance income visibility. Simultaneously, green-building accreditation is an increasingly critical tenant requirement, with more than 2 million sq m already certified nationwide. Regulatory uncertainty around the Expropriation Act 2024 and looming executive-liability clauses in carbon legislation elevate compliance costs, skewing competitive advantages toward firms with in-house legal and ESG expertise.
White-space opportunities include last-mile hubs in secondary metros, mixed-use precincts tied to rail expansions, and solar-ready rooftop portfolios that can feed excess generation into municipal grids. Investors able to structure deals around these themes stand to outperform as the South Africa commercial real estate market pivots toward resilience and sustainability.
South Africa Commercial Real Estate Industry Leaders
-
Growthpoint Properties
-
Redefine Properties
-
Fortress REIT
-
Attacq Ltd
-
Liberty Two Degrees
- *Disclaimer: Major Players sorted in no particular order
Market Opportunities and Future Outlook
White-space is forming where owners can reconfigure legacy formats into resilient, mixed-use, and service-intensive assets. Cape Town provides a visible example of office-to-residential and precinct repositioning activity: in April 2026, Putirex commenced the retail phase of the Golden Acre redevelopment, including the conversion of a 24-storey office tower into 414 affordable rental units. The redevelopment links CBD vacancy mitigation with the missing-middle housing gap. For landlords with older office stock, conversion or mixed-use strategies can stabilize occupancy and add diversified income streams (retail at grade, flexible workspace, and residential components) while leveraging existing urban infrastructure.
New-build opportunities also show up in retail nodes outside the largest metros and in large-format trade-oriented complexes. In April 2026, Moolman Group, Twin City, and Melta Capital opened the 35,000 sq m Prince Buthelezi Mall in Empangeni, KwaZulu-Natal, signaling continued retailer interest in underserved catchments. In Johannesburg, June 2026 saw the unveiling of Time Square, a 330,000 sq m integrated wholesale and retail complex, reflecting demand for consolidated trading and distribution ecosystems. At the portfolio level, rising operating costs, notably electricity and municipal charges, keep energy-resilience retrofits and solar-ready rooftops central to asset strategies, particularly for logistics and retail landlords where uptime and tenant retention are closely tied to power reliability.
Recent Industry Developments
- June 2026: Growthpoint Properties completed an oversubscribed R1.8 billion bond issuance. The transaction strengthened funding capacity for portfolio capex and refinancing in a higher-cost debt environment, supporting continued upgrades focused on tenant retention and asset resilience.
- May 2026: Flanagan & Gerard Property Group and GrandWest commenced construction on the 22,000 sq m GrandWest Mall in Cape Town, a R650-million development. The project adds new retail supply in a major urban node and underlines continued appetite for well-located, experience-led retail formats amid selective development conditions.
- April 2025: Vukile Property Fund acquired the Forum Madeira shopping center in Portugal for about USD 79 million. The deal illustrates capital allocation toward offshore income streams and portfolio diversification, a strategy that can influence domestic reinvestment pacing and balance-sheet positioning among South African property groups.
Research Methodology Framework and Report Scope
Market Definition and Coverage
This market covers income-producing commercial properties in South Africa that are used for business activity or as workspaces, and it includes assets that are sold or leased across the main commercial formats.
Scope exclusions: Residential real estate activity is excluded, and it is treated outside this market sizing.
Segmentation Overview
- By Property Type
- Offices
- Retail
- Logistics
- Others (industrial real estate, hospitality real estate, etc.)
- By Business Model
- Sales
- Rental
- By End-user
- Individuals / Households
- Corporates & SMEs
- Others
- By Geography
- Johannesburg
- Cape Town
- Durban
- Port Elizabeth / Gqeberha
- Rest of South Africa
Data Sources, Market Sizing, and Validation
Desk Research
Desk work starts with public datasets that anchor demand and pricing context for South Africa, before interviews are layered in. We used sources such as Statistics South Africa releases on construction and buildings completed, the South African Reserve Bank macro series, and National Treasury budget and infrastructure documents to understand investment conditions.
To make the signals less abstract, we also reviewed market-facing data such as listed property and REIT annual reports, investor presentations, and audited financial statements. We supplemented this with industry bodies and public market updates from the Property Sector Charter Council and similar association websites. Where logistics space demand is influenced by trade flows, we checked import and trade indicators using customs and trade publications, and we relied on a paid subscription for company financials and news screening to keep corporate actions and portfolio moves current. This desk source list is illustrative only, and other public documents were referenced to collect data, validate assumptions, and clarify gaps.
Primary Interviews and Surveys
Primary work was used to convert broad signals into usable sizing inputs, especially where public data does not directly state leased area, effective rents, or vacancy movement. We spoke with a mix of property owners, asset managers, brokers, developers, tenants, and supporting service providers, and the discussions were balanced across major metros such as Johannesburg, Cape Town, Durban, and Gqeberha, plus secondary cities where needed.
Distribution of primary research fieldwork respondents
| Company type | Respondent position |
|---|---|
| Top tier: 39% | CXOs: 19% |
| Mid tier: 41% | Functional/Unit leaders: 40% |
| Smaller Players: 20% | Managers: 41% |
Market-Sizing & Forecasting
Sizing is built using top-down and bottom-up logic. On the top-down side, we reconstruct commercial stock and the monetization pool from space and value signals, then align it to observed leasing and transaction behavior for South Africa. Where the data supported it, we cross-checked totals with selective bottom-up approximations such as sampled rent per square meter times occupied area, plus roll-ups from listed portfolios and large owner disclosures, and then adjusted for gaps.
Key inputs used in the model include vacancy and absorption direction, rental rate movement (including incentives where material), new supply completions and pipeline timing, construction cost inflation, capitalization rate direction, and business activity indicators that drive demand for office, retail, and logistics space. Forecasts were set using scenario analysis around interest-rate paths and tenant demand recovery, and variable trends were stress-tested with what interviewees expect for leasing velocity and development starts. When bottom-up snapshots did not cover smaller cities or private assets well, the gaps were handled through calibrated penetration factors that were reviewed during primary calls.
Data Validation & Update Cycle
Validation is done by checking whether the model behaves like the real market. We compare outputs against independent signals such as listed property portfolio value trends, construction and completion cycles, and macro indicators that tie to business demand. If the size shifts too sharply versus these checks, the drivers are re-examined and the assumptions are revisited, followed by a second analyst review before sign-off.
The study is refreshed annually, and interim updates are done when material events occur, such as a large policy change, major rate moves, or a step-change in development activity. Before delivery, a final pass is completed so the numbers reflect the latest available public releases and the most recent interview feedback we could confirm.
Mordor Intelligence's South Africa Commercial Real Estate Market Estimate Compared With Other Published Estimates
Published market sizes for South Africa commercial real estate can vary a lot, even when the topic label looks identical, because publishers are not always counting the same thing. The biggest differences usually come from whether the figure represents asset value or annual market activity, which property types are included, and how rents, occupancy, and currency timing are treated.
The main gap comes from mixing up asset value with market activity. Mordor Intelligence sizes commercial real estate as a business-use property market across office, retail, industrial and logistics, and hospitality with sales and rental dynamics, rather than a municipal balance-sheet style valuation total. Differences also show up when some estimates use a single exchange rate point, apply broad GDP proxies, or do not update vacancy and incentive assumptions after market shifts, which can move the end number meaningfully.
Benchmark comparison
| Source | Market Size | Gaps in Research Methodology |
|---|---|---|
| Mordor Intelligence | USD 9.99 B (2025) | |
| Trade Journal A | USD 110.00 B (2023) | Represents a stock valuation of commercial properties derived from municipal financial statements and converted at an assumed exchange rate, so it is not comparable to an activity and dynamics based market size, and it may be understated due to valuation and coverage exclusions. |
| Industry Platform B | USD 110.00 B (2023) | Uses a similar municipal-record based property value total (a point-in-time asset value), which can exclude parts of the investable universe and does not explicitly model vacancy, incentives, or segment-level leasing momentum that affect market sizing and forecasts. |
The table shows that the spread is mainly about what is being measured, since asset value totals can be an order of magnitude larger than a market size built around commercial property dynamics. By keeping the scope tied to business-use assets and validating the key levers through interviews and cross-checks, we end up with a number that is easier to explain and reproduce year to year.
Key Questions Answered in the Report
What is the current value of the South Africa commercial real estate market?
The South Africa commercial real estate market size is USD 10.72 billion in 2026.
How fast will South African logistics property grow?
Logistics assets are projected to record a 9.47% CAGR through 2031 as e-commerce and data-center demand converge.
Which city holds the largest share of commercial real estate in South Africa?
Johannesburg leads with 35.32% market share thanks to its status as Africa’s financial and technology hub.
How are power outages affecting commercial landlords?
Stage 6 load-shedding can raise diesel costs to USD 28,417 per day, pressuring net operating income and encouraging solar retrofits.