
Market Overview
| Study Period | 2020 - 2031 |
|---|---|
| Forecast Data Period | 2026 - 2031 |
| Base Year Market Size (2025) | USD 33.10 Billion |
| Market Size (2026) | USD 35.06 Billion |
| Market Size (2031) | USD 46.74 Billion |
| Growth Rate (2026 - 2031) | 5.92 % |
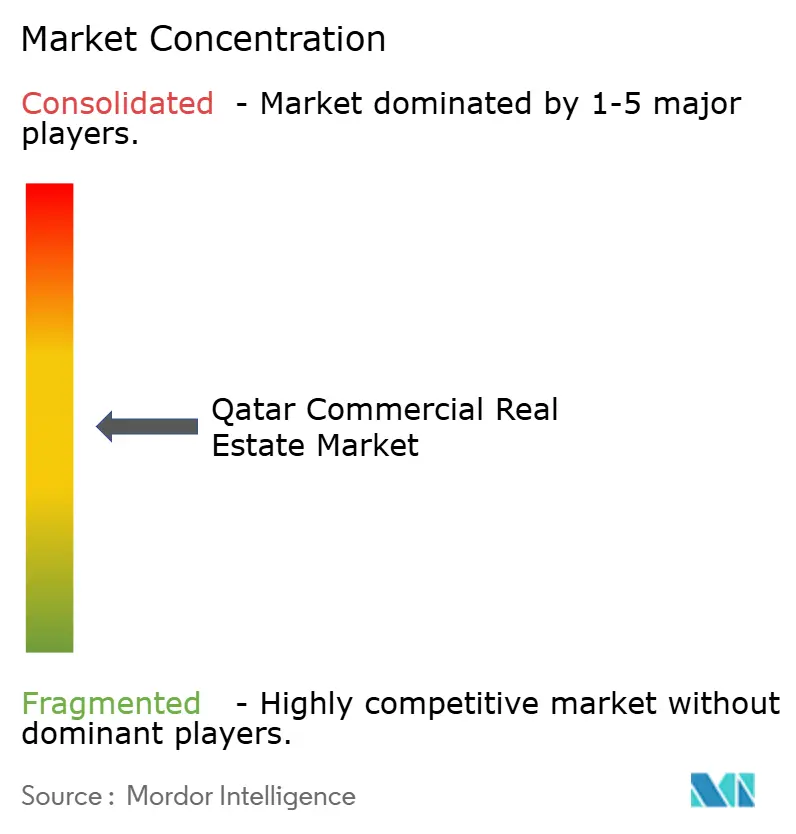
| Market Concentration | Medium |
Major Players *Disclaimer: Major Players sorted in no particular order Image © Mordor Intelligence. Reuse requires attribution under CC BY 4.0. | |
Qatar Commercial Real Estate Market Analysis by Mordor Intelligence
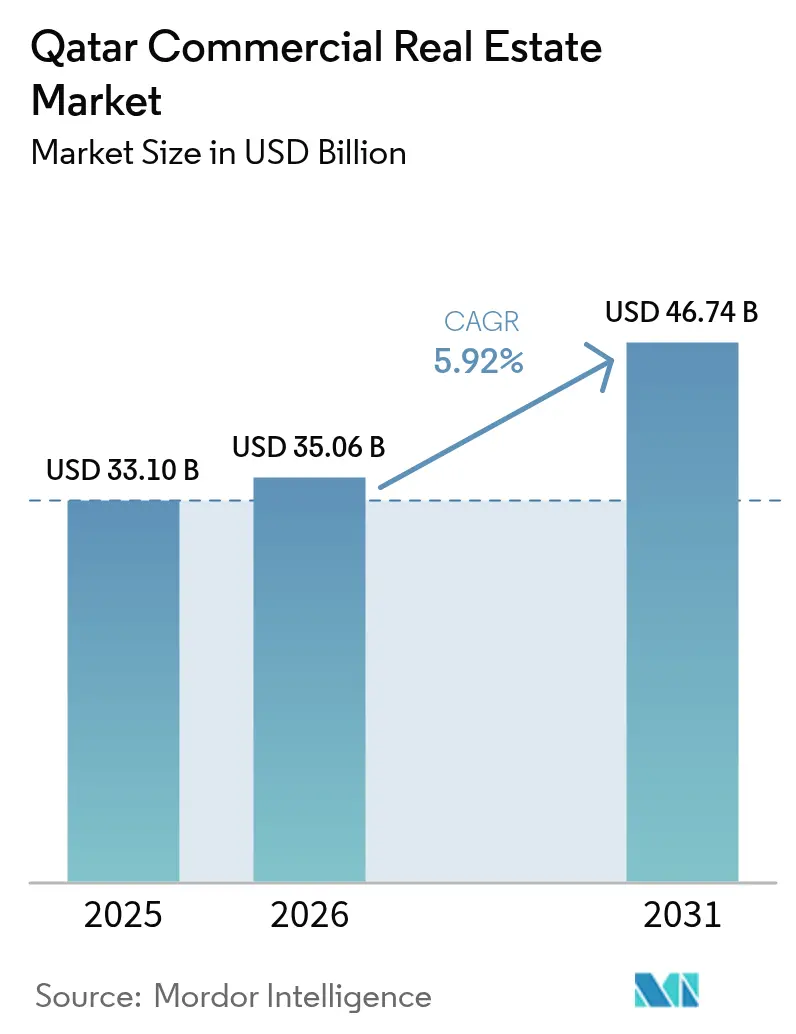
The Qatar commercial real estate market size is expected to grow from USD 33.10 billion in 2025 to USD 35.06 billion in 2026 and is forecast to reach USD 46.74 billion by 2031 at 5.92% CAGR over 2026-2031. Growth remains anchored in the government’s USD 350 billion sustainable-development pipeline and the Third National Development Strategy, which together widen demand for offices, logistics facilities, and mixed-use projects across the country. New-generation free-zone policies that allow 100% foreign ownership, plus residency incentives linked to property investment, continue to draw international corporates and institutional investors, while rising e-commerce volumes accelerate the need for automated last-mile hubs near Hamad Port and Greater Doha. Liquidity conditions are supportive: Qatari banks expanded real-estate lending by 6.3% year on year in 2024, signalling confidence in the sector’s medium-term outlook. At the same time, oversupply in post-World-Cup office and hospitality stock is being absorbed through adaptive-reuse programs, green retrofits, and flexible leasing models that match changing occupier preferences. Advancing construction-tech adoption—highlighted by AI-enabled design showcased at ConteQ Expo24—lowers long-run operating costs and strengthens competitive positioning for new asset[1].
Key Report Takeaways
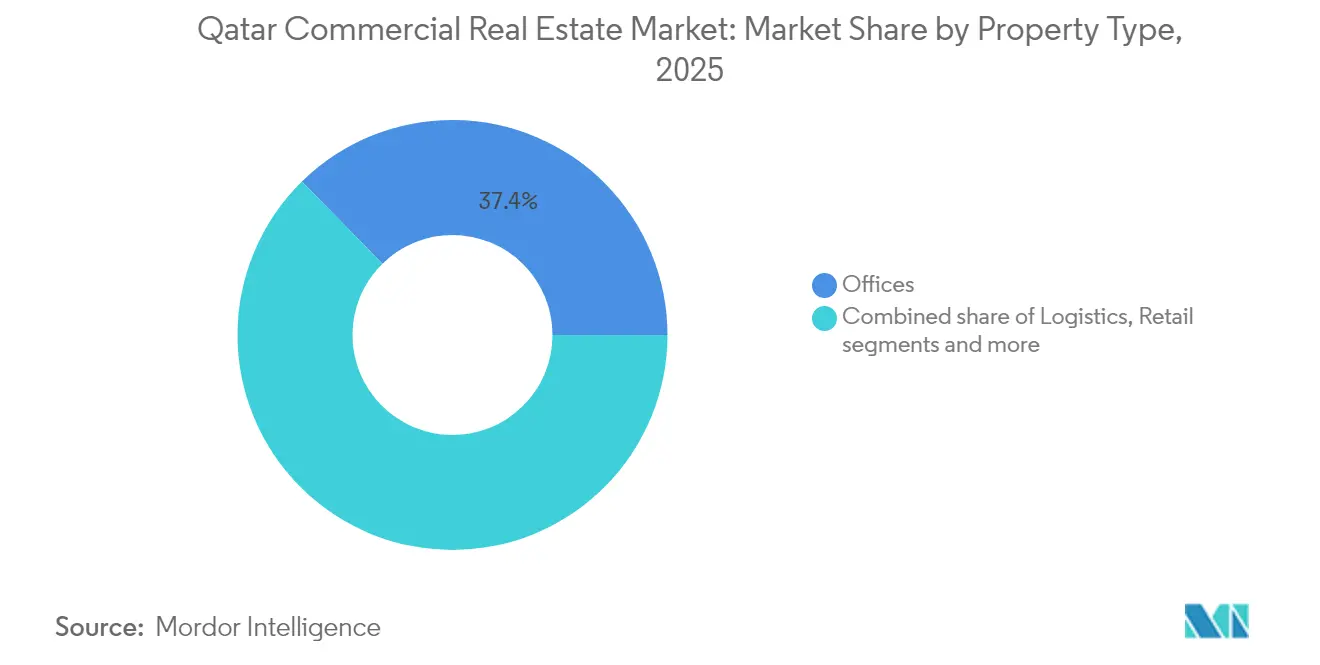
- By property type, Offices led with 37.35% of Qatar commercial real estate market share in 2025, whereas Logistics is projected to register the fastest 6.01% CAGR to 2031.
- By business model, Sales transactions dominated with 63.25% of the Qatar commercial real estate market in 2025, yet Rentals are forecast to grow at 6.15% CAGR through 2031.
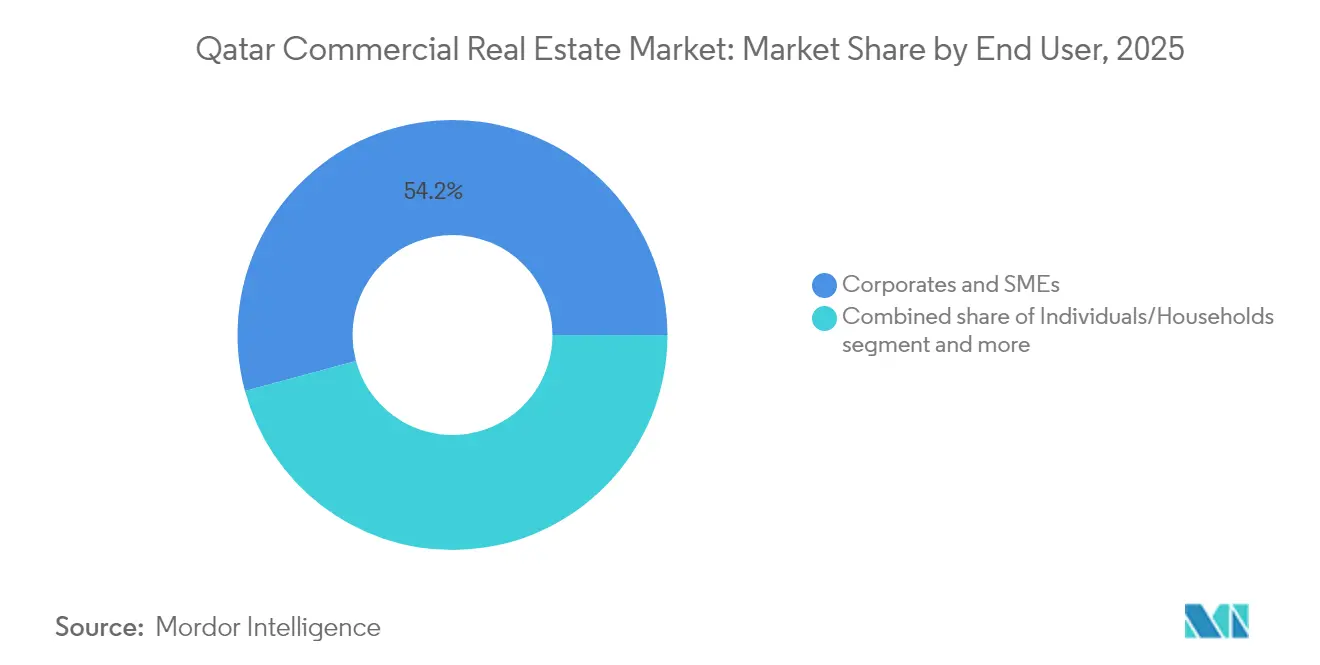
- By end-user, Corporates & SMEs commanded 54.20% share of the Qatar commercial real estate market size in 2025, while Institutional Investors exhibit the quickest 5.98% CAGR toward 2031.
- By city, Doha accounted for 70.35% of the Qatar commercial real estate market size in 2025; Al Wakrah is advancing at the highest 6.26% CAGR to 2031.
Note: Market size and forecast figures in this report are generated using Mordor Intelligence’s proprietary estimation framework, updated with the latest available data and insights as of 2026.
Market Trends and Insights
Drivers Impact Analysis of Qatar Commercial Real Estate Market*
| Drivers | (~) % Impact on CAGR Forecast | Geographic Relevance | Impact Timeline |
|---|---|---|---|
| Economic diversification under Qatar National Vision 2030 | +1.2% | National, with focus on Lusail and industrial zones | Long term (≥ 4 years) |
| Free-zone & 100% foreign-ownership reforms | +1.0% | QFC, QSTP, QFZ areas with spillover effects | Medium term (2-4 years) |
| E-commerce last-mile logistics boom | +0.9% | Greater Doha area and port-adjacent zones | Medium term (2-4 years) |
| FIFA-legacy infrastructure demand surge | +0.8% | National, concentrated in Doha and Al Wakrah | Short term (≤ 2 years) |
| QIA green-building investment mandate | +0.7% | National, prioritizing new developments | Long term (≥ 4 years) |
| Lusail data-centre corridor incentives | +0.6% | Lusail City and surrounding areas | Medium term (2-4 years) |
| Source: Mordor Intelligence | |||
FIFA-legacy infrastructure demand surge
Redevelopment of tournament-era venues into hotels, retail clusters, and mixed-use districts is generating fresh leasing activity around stadium precincts, countering the rental-rate dip that followed the 2022 event. Public Works Authority has earmarked USD 22.2 billion for 2025-2029 urban upgrades that leverage these sites, assuring short-term absorption of vacant stock and catalysing related commercial build-outs.
Economic diversification under Qatar National Vision 2030
The strategy pivots GDP away from hydrocarbons by nurturing manufacturing, logistics, and tech services, all of which demand tailored real estate such as research labs, small-batch factories, and co-working floors. Manufacturing added USD 18 billion to GDP in 2024, while the logistics sector is expanding 7.1% annually, underpinning a long-run lift in warehouse and light-industrial absorption[2].
Free-zone & 100% foreign-ownership reforms
The Foreign Investment Law No. 1 of 2019 removed equity caps and enabled land allocation inside QFZ and QFC, propelling Grade-A office take-up above 2,400 registered firms by early 2025. Accompanying tax exemptions reduce total occupancy costs, nudging multinationals toward long leases and boosting pre-commitments for upcoming towers in Lusail and Energy City.
E-commerce last-mile logistics boom
Online retail volume keeps climbing, prompting government release of a 6.3 km² industrial park near Hamad Port with 1,500 serviced plots tailored for automated cross-docks, dark stores, and cold-chain nodes. Small-ticket investors control two-thirds of the plots, widening developer diversity and pushing competitive innovation in facility design and robotics integration.
Restraints Impact Analysis of Qatar Commercial Real Estate Market*
| Restraints | (~) % Impact on CAGR Forecast | Geographic Relevance | Impact Timeline |
|---|---|---|---|
| Office & hospitality oversupply post-World Cup | −1.1% | Doha central business district and hospitality zones | Short term (≤ 2 years) |
| ESG-driven construction cost inflation | −0.8% | National, affecting all new developments | Medium term (2-4 years) |
| Higher lending rates & tighter credit | −0.6% | National, concentrated in high-leverage segments | Short term (≤ 2 years) |
| Slow REIT-law implementation | −0.4% | National, affecting institutional investment flows | Long term (≥ 4 years) |
| Source: Mordor Intelligence | |||
Office & hospitality oversupply post-World-Cup
Roughly 40% expansion in prime office stock during World-Cup preparations outpaced immediate demand, driving a 20% rent fall between 2021-2024 and elevating non-performing loan risk for banks with large real-estate books. Developers are mitigating vacancies by converting single-use towers into flexible workspaces and incorporating experiential retail on lower floors, while hoteliers re-brand surplus rooms into mid-scale extended-stay formats.
ESG-driven construction cost inflation
Green-building mandates under Qatar Sustainable Assessment System add double-digit cost premiums to LEED or GSAS-rated projects, raising feasibility hurdles for price-sensitive schemes. Volatile material prices—47.3% dictated by regulatory factors—compound uncertainty; nonetheless, long-term tenants and institutional capital prefer certified assets, helping developers recoup initial outlays through premium rents and lower utility bills[3].
*Our forecasts treat driver/restraint impacts as directional, not additive. The impact forecasts reflect baseline growth, mix effects, and variable interactions.
Qatar Commercial Real Estate Market Segment Analysis
By Property Type:
Logistics Infrastructure Drives GrowthOffices retained the largest 37.35% Qatar commercial real estate market share in 2025 thanks to Doha’s CBD pipeline and Lusail tower completions. Yet vacancy pressure and hybrid-work adoption temper growth, steering landlords toward modular floorplates and tech-enabled amenities that improve space efficiency. The Qatar commercial real estate market size attributable to Offices will edge up only modestly through 2031 as occupiers seek lease flexibility and ESG-certified space.
Logistics facilities deliver the fastest 6.01% CAGR to 2031, supported by e-commerce adoption, North Field LNG expansion, and government-backed industrial parks near Hamad Port. Automated racking, temperature-controlled zones, and solar-ready roofs now feature in most tenders, while AI-driven construction showcased at ConteQ Expo24 shortens delivery cycles and cuts long-run energy costs.

By Business Model:
Rental Growth AcceleratesSales transactions commanded a 63.25% slice of the Qatar commercial real estate market in 2025 as foreign freehold demand surged in Lusail and The Pearl. High-net-worth buyers view freehold offices and retail podiums as inflation hedges, and residency schemes tied to USD 1 million purchases reinforce appetite. Still, tighter global financing conditions and a preference for capital-light balance sheets curb outright acquisitions by corporates.
Rentals are on a 6.15% CAGR trajectory to 2031, reflecting occupiers’ turn toward OPEX-friendly models that preserve working capital. Updated Rent Law No. 4 of 2008 and functioning Leasing Dispute Committees raise contractual certainty, while landlords entice tenants with turnkey fit-outs, shorter rent-free periods, and green-lease clauses that share utility-efficiency gains.
By End-user:
Institutional Investment MomentumCorporates & SMEs held a 54.20% share of the Qatar commercial real estate market size in 2025, driven by manufacturing diversification, startup formation in Qatar Science & Technology Park, and reshoring of supply chains into purpose-built warehouses. Occupiers favour clusters offering research labs, light assembly floors, and on-site customs clearance.
Institutional Investors represent the quickest 5.98% CAGR bracket, buoyed by Qatar Investment Authority’s USD 1 billion Fund-of-Funds that lured B Capital and Deerfield into Doha in 2025. Sovereign funds, asset managers, and insurance firms demand core-plus offices with data-rich building-management systems and proximity to financial regulators. Long-income profiles and green-bond financing unlock competitive borrowing costs, making trophy assets in Lusail and West Bay their favoured targets.
Geography Analysis
Doha preserved 70.35% of the Qatar commercial real estate market size in 2025 on the back of Hamad International Airport’s 70 million-passenger capacity, entrenched government institutions, and the 1.1 million m² Lusail Towers block that houses Qatar National Bank and the central bank. While the capital still garners the lion’s share of multinational demand, supply overhang in Grade-A offices and hotels keeps headline rents flat in the near term. Adaptive-reuse programs that transform surplus hospitality suites into serviced apartments and senior-living units help moderate vacancy pressures.
Al Wakrah is the fastest riser with a 6.26% CAGR through 2031, catalysed by a 6.3 km² logistics park beside Hamad Port and Mesaieed Industrial City. Public Works Authority budgets USD 22.2 billion for roads, utilities, and drainage that elevate the city’s competitiveness, while small-parcel land sales encourage local entrepreneurs to roll out specialised warehousing and cold-chain modules. Improved coastal highways shorten drayage times to the port, enabling 24-hour fulfilment cycles for e-commerce players.
Al Rayyan and the Rest of Qatar offer steady but smaller bases for future growth. Al Rayyan benefits from spill-over tenant demand as Doha’s core tightens, spurring mixed-use precincts that merge coworking, mid-scale retail, and residential towers. Outlying industrial zones host fabrication yards and service bases for the North Field LNG project, with built-to-suit plots attracting engineering, procurement, and construction contractors. Growth across these districts supports a balanced geographic spread for the Qatar commercial real estate market, reducing over-reliance on the capital.
Regulatory Landscape
Qatar’s commercial real estate sector is governed through property registration rules, ownership-zone frameworks, leasing regulations, and a dedicated sector regulator. The Real Estate Regulatory Authority (Aqarat), established by Emiri Decision No. 28 of 2023, coordinates real estate sector oversight, including market organization and licensing touchpoints for developers and brokers.
Recent legal and administrative steps have helped improve transaction certainty, including off-plan governance. Law No. 5 of 2024 on Real Estate Registration covers the registration of real estate transactions and rights, while the Ministry of Justice introduced Ministerial Decision No. 4 of 2026 to create a Preliminary Real Estate Registry for off-plan units, aimed at improving transparency and protections during construction. Tenancy enforceability continues to be supported by Rent Law No. 4 of 2008 and associated dispute mechanisms, alongside ongoing digitization of registration and brokerage processes through government portals.
Value Chain Analysis
In Qatar’s commercial real estate market, the value chain starts with land policy and master planning, then moves through master developers and developers, design and engineering, contractors and specialist subcontractors, building-material and MEP suppliers, and finally brokerage, transaction registration, financing, and asset operations (property and facilities management). State-led planning and enabling policy, including the Third National Development Strategy (2024-2030), influences where offices, logistics parks, and mixed-use districts are prioritized, while transaction formalization runs through the Ministry of Justice’s registration infrastructure and associated digital services.
On the delivery side, master developers and public entities underpin multi-year pipelines that feed contractors, consultants, and suppliers, with Lusail acting as a key node for large-scale program management and infrastructure supervision. At the operational end, building-performance requirements and ESG-linked asset management increasingly differentiate the chain. Landlords use service-charge structures, green retrofits, and tenant-oriented leasing packages to protect occupancy and NOI, while demand signals flow upstream from logistics and freehold developments, where non-Qatari ownership zones and port-adjacent industrial land releases shape product design (cold chain, automation-ready warehouses) and support the broker-and-agency ecosystem that helps absorb new supply.
Competitive Landscape
A moderate concentration characterises the Qatar commercial real estate market, with leading developers—Barwa Real Estate, Ezdan Holding, United Development Company, and Qatari Diar—leveraging joint ventures and PPP awards to secure land and financing for headline schemes. The government aims to award USD 85 billion in PPP projects by 2030, prompting consortium bids that marry local knowledge with international design-build expertise.
Technology and sustainability have become the prime battlegrounds. ConteQ Expo24 demonstrated AI-assisted quantity-surveying and drone-based progress tracking, tools now embedded by Alfardan Properties and Msheireb Properties to compress build times and lift margins. Green-building compliance is no longer optional: developers courting sovereign wealth capital must achieve GSAS 4-star or LEED Gold as the minimum entry ticket, spurring alliances with global EPC firms skilled in net-zero design.
Specialist niches provide white-space opportunities. Global providers such as GLP and Goodman are studying entry strategies for temperature-controlled logistics, while Equinix and Digital Realty scout plots in Lusail’s data-centre corridor to capitalise on government incentives for cloud infrastructure. Local challengers—First Qatar Real Estate and Mazaya—target mid-market rental housing and community malls that recycle stranded land parcels.
Qatar Commercial Real Estate Industry Leaders
-
Barwa Real Estate Company
-
Ezdan Holding Group
-
United Development Company
-
Mazaya Real Estate Development
-
Qatari Diar
- *Disclaimer: Major Players sorted in no particular order
Qatar Commercial Real Estate Market Companies Covered in this Report
- Barwa Real Estate Company
- Ezdan Holding Group
- United Development Company
- Mazaya Real Estate Development
- Qatari Diar
- Msheireb Properties
- Alfardan Properties
- First Qatar Real Estate Development
- Just Real Estate
- Al Asmakh Real Estate Development
- Al Adekhar Real Estate
- MD Properties
- Katara Hospitality
- Qatar Living
- Property Finder Qatar
- CBRE Group Inc.
- Jones Lang LaSalle
- Cushman & Wakefield
- Colliers International
- Savills plc
- Knight Frank LLP
Market Opportunities and Future Outlook
Regulatory upgrades for off-plan transactions improve the pathway for structured development and institutional-style underwriting of projects that rely on presales. The Ministry of Justice’s Ministerial Decision No. 4 of 2026, establishing a Preliminary Real Estate Registry for off-plan units, is designed to strengthen buyer protections and documentation during construction. This framework creates room for developers and lenders to scale pipeline delivery with tighter governance, particularly in mixed-use districts where phased handovers are common.
The expansion of designated ownership zones, alongside state-backed destination projects, broadens the investor pool and supports new commercial clusters within master-planned coastal and mixed-use schemes. Cabinet Decision No. 21 of 2026 added the Simaisma Resort and Beach Project to areas where non-Qataris may own property, building on the Simaisma project inaugurated in June 2024 and reinforcing a development corridor that can support retail, hospitality-adjacent commercial space, and related services. Separately, the Ministry of Municipality’s Ministerial Decision No. 108 of 2026 updating villa and mansion design standards indicates active policy adjustment to match changing space preferences, and this flexibility also creates whitespace for adjacent commercial formats (neighborhood retail, services offices, and community amenities) in growth districts outside central Doha.
Recent Industry Developments in Qatar Commercial Real Estate Market
- July 2026: United Development Company announced a reduction in master community service charges for 2026 across The Pearl and Gewan Islands. The reduction is intended as an operating lever to support occupier retention and transaction liquidity in two of the country’s flagship mixed-use destinations. It should also feed into leasing competitiveness and asset-level cash flows.
- May 2025: Public Works Authority launched a USD 22.2 billion infrastructure plan for 2025-2029 covering roads, drainage, and 5,500 residential plots through PPPs. The program strengthens enabling infrastructure that supports commercial nodes beyond central Doha. It is designed to improve site readiness and accelerate absorption for logistics, offices, and mixed-use developments linked to upgraded transport and utilities.
- June 2024: The Prime Minister and Minister of Foreign Affairs inaugurated the Simaisma Project. As a state-backed destination development, it expanded the pipeline of coastal mixed-use and tourism-linked real estate. The project also helped create new submarkets for supporting commercial components such as retail, F&B, and services-oriented office space.
Qatar Commercial Real Estate Market Report Scope and Research Methodology
Market Definition and Coverage
For this study, the commercial real estate market in Qatar is defined as the value of operational and investable commercial property stock, covering assets that generate rental or operating income and are used for business activity across the country.
Scope exclusions: We exclude pure residential property, vacant land trades without active vertical development, and agricultural holdings.
Segments Covered in This Report
- By Property Type
- Offices
- Retail
- Logistics
- Others (Industrial, Hospitality, etc.)
- By Business Model
- Sales
- Rental
- By End-user
- Individuals / Households
- Corporates & SMEs
- Others
- By Cities
- Doha
- Al Wakrah
- Al Rayyan
- Rest of Qatar
Data Sources, Market Sizing, and Validation
Desk Research
Desk research was used to set the market frame and to anchor assumptions that can be checked repeatedly. We relied on public, non-paywalled sources such as Qatar Planning and Statistics Authority releases, Qatar Central Bank publications, Ministry of Municipality planning updates, and Qatar Stock Exchange disclosures for listed real estate groups.
Along with these, we reviewed company annual reports and investor presentations, reputable local press coverage of major projects, and selected academic or industry papers on occupancy, leasing patterns, and construction pipelines. Where public company financials left gaps on deal activity or portfolio performance, we also used paid database subscriptions that provide structured company and news intelligence. These were applied sparingly to fill missing entries on items like building-related retrofits (for example, energy efficiency upgrades). This list is illustrative, and many other sources were used during data collection, validation, and clarification.
Primary Interviews and Surveys
Primary work focused on validating how value is being created and absorbed across offices, retail, hospitality, and industrial and logistics properties in Qatar. We spoke with a mix of developers, asset managers, brokers, lenders, and large occupiers to confirm leasing activity, vacancy direction, and the typical pricing logic used for new and existing stock. We then compared the takeaways across Doha versus other active corridors to understand whether pricing and leasing behavior differed by sub-market.
Distribution of primary research fieldwork respondents
| Company type | Respondent position |
|---|---|
| Top tier: 38% | CXOs: 20% |
| Mid tier: 40% | Functional/Unit leaders: 31% |
| Smaller Players: 22% | Managers: 49% |
Market-Sizing & Forecasting
Sizing was built using a mix of top-down and bottom-up checks so the totals stay realistic for Qatar. On the top-down side, we reconstruct the value pool by linking active commercial stock additions and redevelopment activity to observable demand signals, and then we translate that into market value using typical pricing and yield behavior seen in the country.
To keep the model grounded, a few practical inputs were tracked closely, such as new supply delivery pipelines, vacancy and absorption direction, rent movements for prime versus secondary assets, construction cost pressure, and financing conditions that influence investment appetite. Where public series were not enough, primary feedback was used to tighten assumptions on lease lengths, tenant incentives, pre-leasing levels for new projects, and how quickly mixed-use areas stabilize.
Forecasting was done using scenario analysis supported by simple time-series smoothing on the most stable indicators, and then the results were reviewed against expert expectations for policy-driven investment, business setup activity, and tourism-led demand for hospitality. Bottom-up approximations were used as a reasonableness check, including sampled asset value builds using typical rent x occupancy x yield logic and selective roll-ups from reported portfolio values, and gaps were handled by applying conservative ranges that were later re-tested with interview callbacks.
Data Validation & Update Cycle
Outputs were validated through triangulation across independent signals, and then unusual jumps were investigated before final sign-off. We compared implied values against directionally consistent metrics, such as rental trends, vacancy movement, new completions, and the pace of major commercial project announcements, and then we re-checked any large variance by revisiting the underlying assumptions.
Before publishing, the model goes through multi-step analyst review so calculation choices, currency handling, and year labeling stay consistent. Reports are refreshed annually, and interim updates are made when material events change market direction, such as major policy shifts, large project launches, or financing condition changes. Right before delivery, a final pass is done so clients receive the most up-to-date view available at that time.
Mordor Intelligence's Qatar Commercial Real Estate Market Size Compared With Other Published Estimates
Published estimates for Qatar commercial real estate can look far apart because authors do not always count the same asset types, valuation basis, or timing. Differences in whether the number represents stock value versus transactional activity, and whether assets under active development are counted, typically explains a big part of the spread.
The table also shows that some figures cluster in the low single digit billions, while another lands in the tens of billions, and that usually comes down to whether the model is valuing the full commercial property stock or only a narrower activity slice. In Mordor Intelligence's model, the market is treated as the aggregate value of offices, retail, hotels, industrial and logistics, and mixed-use stock that is completed, trading, or under active development in Qatar, while excluding pure land trades without vertical construction and purely residential assets.
Benchmark comparison
| Source | Market Size | Gaps in Research Methodology |
|---|---|---|
| Mordor Intelligence | USD 33.10 B (2025) | |
| Trade Publisher A | USD 4.14 B (2024) | Uses a narrower end-use and transaction lens, and the reported value appears closer to annual activity across select categories rather than the full commercial stock value, which lowers the total. |
| Data Provider B | USD 2.75 B (2024) | Appears to apply a tighter property and geography scope with a smaller value base, and may not include mixed-use stock under development or owner-occupied assets, which reduces coverage. |
Looking across the three numbers, the main takeaway is that scope and valuation basis drive the gap more than arithmetic. When the counted universe is clearly defined and the inputs are tied back to rents, occupancy, development pipelines, and realistic pricing assumptions, the resulting market size stays traceable and easier to refresh year after year.
Key Questions Answered in the Report
What is the current size of the Qatar commercial real estate market?
The Qatar commercial real estate market is valued at USD 35.06 billion in 2026 and is projected to reach USD 46.74 billion by 2031.
Which property type is expanding the fastest?
Logistics facilities lead growth, advancing at a 6.01% CAGR on the back of e-commerce gains and the new 6.3 km² industrial park near Hamad Port.
How large is Doha’s share of the market?
Doha accounts for 70.35% of the Qatar commercial real estate market size in 2025, supported by Lusail’s CBD towers and Hamad International Airport’s expansion.
Why are rental models growing more quickly than sales?
Rentals are forecast to rise at a 6.15% CAGR because corporates prefer capital-light, flexible leasing structures and benefit from stronger tenant protections under Rent Law No. 4 of 2008.
What risk does oversupply pose to the market?
Post-World-Cup office and hospitality oversupply is expected to trim overall market CAGR by 1.1% in the short term, but adaptive-reuse projects and economic diversification efforts are absorbing excess stock.
How are sustainability rules affecting development costs?
Mandatory GSAS and LEED compliance adds cost premiums, yet certified assets command higher rents and attract institutional capital focused on ESG goals.