
Market Overview
| Study Period | 2020 - 2031 |
|---|---|
| Forecast Data Period | 2026 - 2031 |
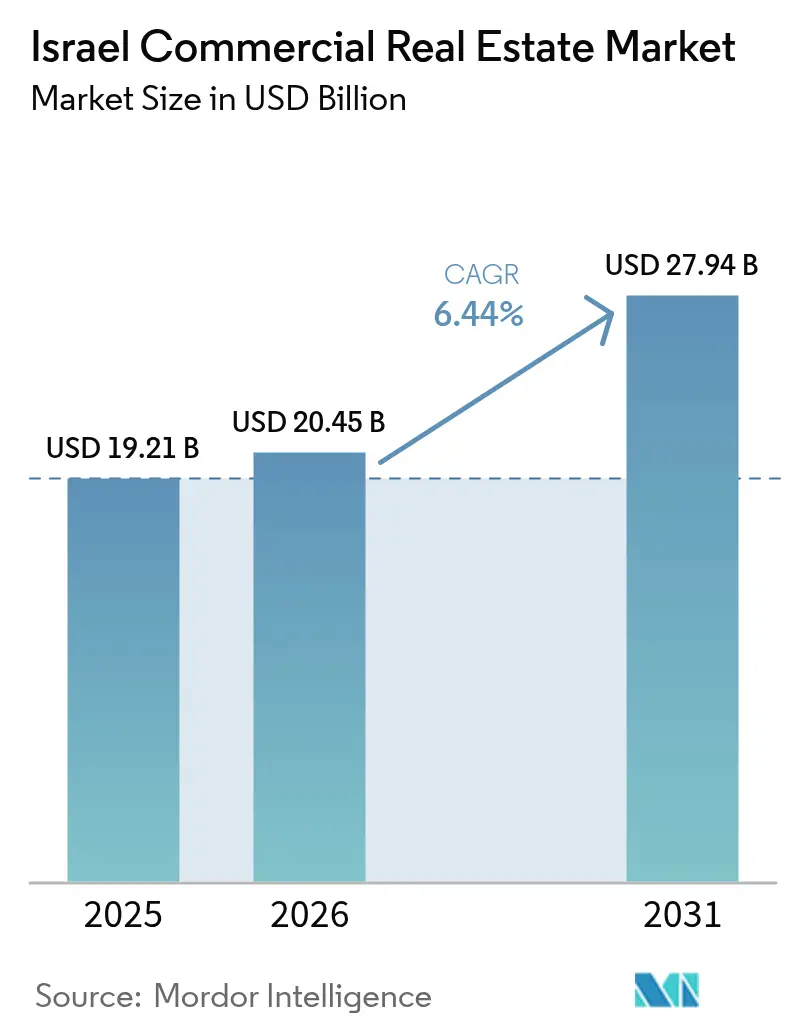
| Base Year Market Size (2025) | USD 19.21 Billion |
| Market Size (2026) | USD 20.45 Billion |
| Market Size (2031) | USD 27.94 Billion |
| Growth Rate (2026 - 2031) | 6.44% CAGR |
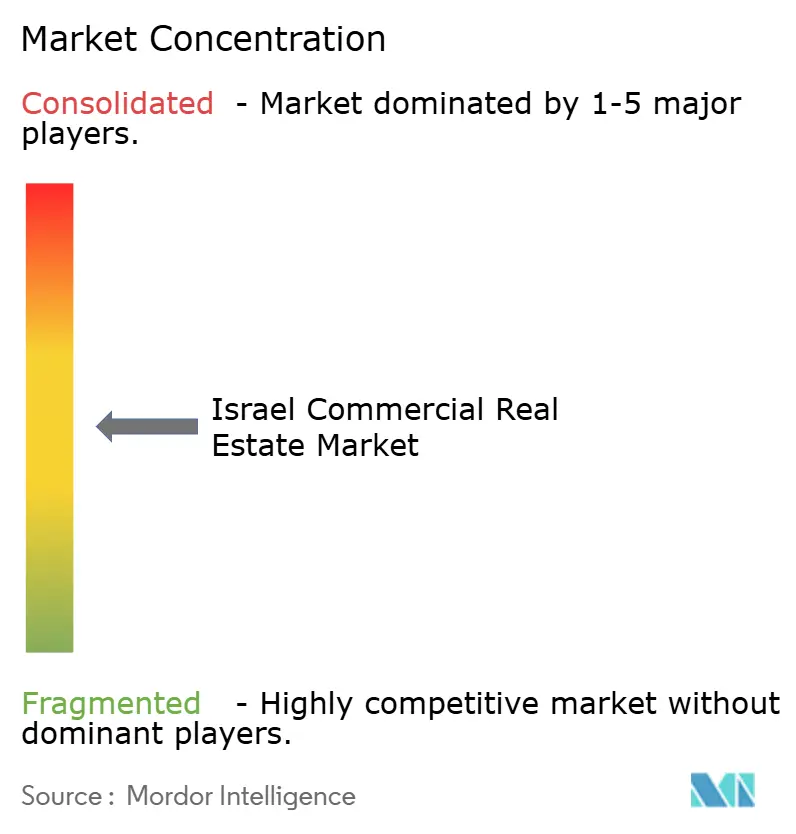
| Market Concentration | Medium |
Major Players *Disclaimer: Major Players sorted in no particular order Image © Mordor Intelligence. Reuse requires attribution under CC BY 4.0. | |
Israel Commercial Real Estate Market Analysis by Mordor Intelligence
Israel commercial real estate market size in 2026 is estimated at USD 20.45 billion, growing from 2025 value of USD 19.21 billion with 2031 projections showing USD 27.94 billion, growing at 6.44% CAGR over 2026-2031. This expansion reflects Israel’s status as a global technology hub, its pivotal position between three continents, and the steady flow of domestic institutional capital seeking inflation-linked income. E-commerce–driven demand for Grade-A logistics parks, accelerated transit-oriented development along Tel Aviv’s new rail corridors, and edge data-center build-outs all lift occupier requirements. At the same time, geopolitical volatility and rising construction costs keep risk premiums elevated, prompting investors to emphasize asset quality, resilient locations, and diversified tenant bases[1]Amir Yaron, “Annual Financial Stability Report 2024,” Bank of Israel, bankisrael.gov.il. Established developers are responding with smart-building retrofits, energy-efficiency upgrades, and strategic joint ventures that reduce funding costs while widening market access.
Key Report Takeaways
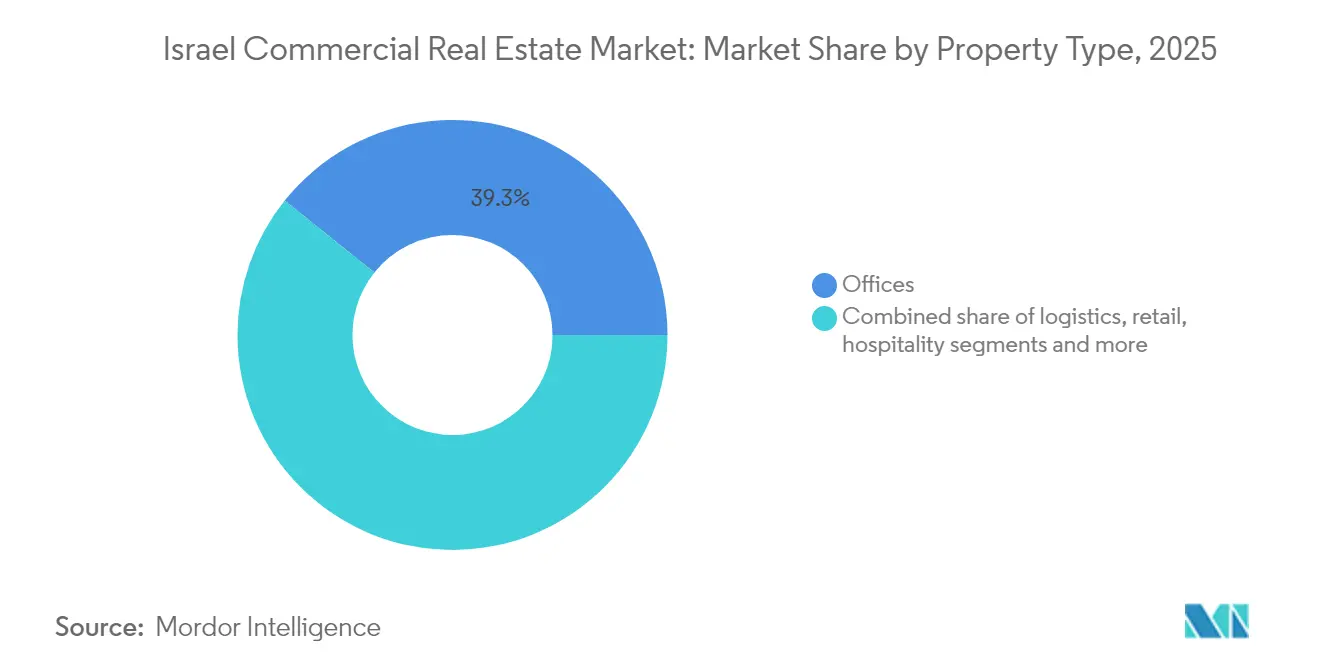
- By property type, offices held the largest 39.25% Israel commercial real estate market share in 2025, whereas logistics and industrial space is forecast to expand at a 7.33% CAGR through 2031.
- By business model, sales transactions accounted for 73.20% of the Israel commercial real estate market size in 2025, while rental and leasing activities record the fastest 7.12% CAGR for 2026-2031.
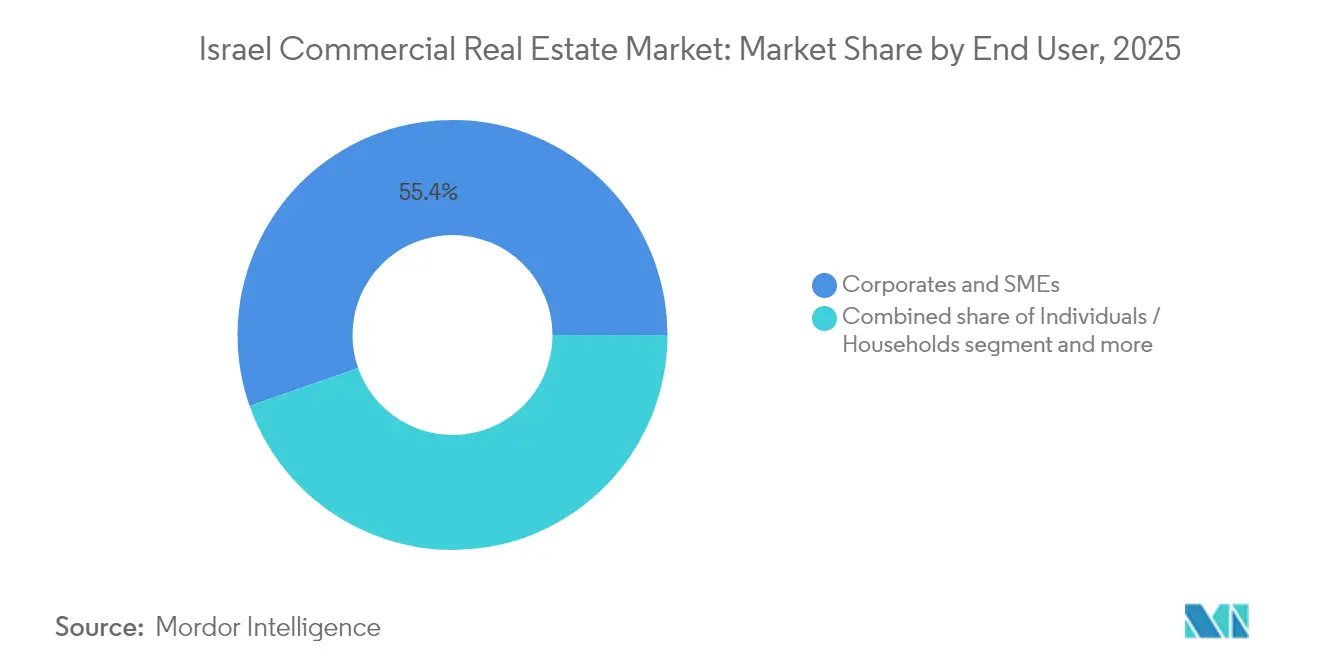
- By end-user, corporates and SMEs commanded 55.35% of activity in 2025; this segment is projected to grow at 6.36% over the forecast period.
- By region, Tel Aviv District led with 44.35% revenue share in 2025, whereas the Central District posts the highest 6.86% CAGR to 2031.
Note: Market size and forecast figures in this report are generated using Mordor Intelligence’s proprietary estimation framework, updated with the latest available data and insights as of 2026.
Israel Commercial Real Estate Market Trends and Insights
Drivers Impact Analysis*
| Driver | (~) % Impact on CAGR Forecast | Geographic Relevance | Impact Timeline |
|---|---|---|---|
| Surge in global tech-tenant expansion | +1.2% | Tel Aviv & Central Districts | Medium term (2-4 years) |
| Grade-A logistics & cold-chain demand | +0.9% | National; Central & Southern | Short term (≤ 2 years) |
| Pension-fund rotation into REITs | +0.8% | National | Medium term (2-4 years) |
| Tel Aviv light-rail corridor uplift | +0.7% | Tel Aviv & Central corridors | Long term (≥ 4 years) |
| EU supply-chain diversion via Haifa | +0.6% | Northern District | Medium term (2-4 years) |
| Edge data-center campus growth | +0.5% | Tel Aviv & Central Districts | Long term (≥ 4 years) |
| Source: Mordor Intelligence | |||
Surge in Global Tech-Tenant Expansion Concentrating in Tel Aviv and Herzliya
Global technology firms continue to scale R&D and regional headquarters in Tel Aviv’s central business district and Herzliya Pituach. Demand centers on Grade-A towers offering resilient telecommunications backbones, redundant power, and adaptable floorplates. The clustering compresses vacancy, sustains premium rents, and stimulates adjacent mixed-use redevelopment. Government reforms in banking, capital markets, and real estate streamline approvals and encourage long-term corporate leasing commitments. Developers able to integrate high-density power, robust cybersecurity systems, and collaborative amenities find an edge in winning anchor tenants.
Accelerated Demand for Grade-A Logistics and Cold-Chain Parks Driven by E-Commerce
Online retail penetration fuels nationwide requirements for high-bay warehouses, automated fulfillment nodes, and temperature-controlled storage near population hubs. Facilities must support robotics, high throughput, and multi-tenant distribution. Israel’s central geography supports regional flows, yet operational bottlenecks at Haifa Port expose supply-chain vulnerabilities, prompting investors to build redundant capacity around Ashdod and inland hubs. Cold-chain parks command rental premiums given the need for precise climate controls for food and pharmaceutical inventory.
Tel Aviv Light-Rail and Metro Corridors Re-rating Adjacent Commercial Land Values
New transit lines reshape urban mobility, adding stations that expand catchment areas and lift footfall. Commercial parcels within walking distance enjoy uplift in appraisal values, while redevelopment pressure rises on under-utilized lots. Retail and office landlords capitalize on higher densities, and mixed-use schemes gain traction as planners encourage live-work-play clusters. Investors price long lead-time projects on expectations of sustained ridership and growing preference for public transport.
Pension-Fund Rotation into Israeli REITs Seeking Inflation-Linked Cashflows
Local pension managers increase allocations to REITs to hedge consumer-price rises. The influx deepens market liquidity and lowers funding spreads for seasoned issuers. In turn, REITs recycle capital into redevelopment of aging stock and acquisition of logistics platforms. Transparent governance and quarterly disclosure satisfy institutional due-diligence requirements, reinforcing a virtuous cycle of capital formation[2]Eyal Cohen, “Israel’s Real Estate Investment Trust Law—2025 Update,” Ministry of Finance, mof.gov.il.
Restraints Impact Analysis*
| Restraint | (~) % Impact on CAGR Forecast | Geographic Relevance | Impact Timeline |
|---|---|---|---|
| Record-high construction & land costs | -1.1% | National; Tel Aviv acute | Short term (≤ 2 years) |
| Persistent hybrid-work adoption | -0.8% | Tel Aviv & Central CBDs | Short term (≤ 2 years) |
| Geopolitical risk-premium on financing | -0.7% | National; border regions | Medium term (2-4 years) |
| Rising water-stress & climate capex | -0.4% | Coastal Districts | Long term (≥ 4 years) |
| Source: Mordor Intelligence | |||
Persistent Hybrid-Work Adoption Softening CBD Office Net Absorption
Hybrid work policies reduce desk density and prolong decision cycles. Prime towers maintain occupancy by offering wellness amenities, flexible fit-outs, and digital access control, yet secondary stock faces longer vacancy and rent concessions. Landlords pivot to smaller floorplates, spec suites, and shared amenity floors to preserve appeal. Co-working operators aggregate swing demand from enterprise clients balancing remote and in-office patterns.
Record-High Construction and Land Costs Compressing Development Margins
Concrete, steel, and labor costs rose 15-20% year-over-year in 2024, while land auctions in Tel Aviv’s core set record benchmarks. Developers either seek joint ventures, pre-let commitments, or vertical mixed-use density to justify pro-forma returns. Value engineering, modular components, and green-building incentives each shave capex but cannot fully offset pricing pressures, delaying speculative starts[3]Lior Horowitz, “Israel Builders Association 2025 Outlook,” Israel Builders Association, iba.org.il.
*Our forecasts treat driver/restraint impacts as directional, not additive. The impact forecasts reflect baseline growth, mix effects, and variable interactions.
Segment Analysis
By Property Type: Offices Hold the Largest Share While Logistics Accelerates
Offices controlled a commanding 39.25% Israel commercial real estate market share in 2025, anchored by technology and financial services tenants clustered in Tel Aviv’s CBDs. Prime towers achieve rent premiums through Class-A amenities, ESG certifications, and plug-and-play digital infrastructure. Despite hybrid work, net absorption remains positive for buildings offering flexible layouts and wellness features. Developers convert outdated stock into boutique mixed-use or life-science labs to capture emerging demand pockets. Meanwhile, the logistics sub-segment posts a forecast 7.33% CAGR, driven by e-commerce growth and near-shoring strategies. Institutional capital flows into build-to-core warehouse parks featuring high-clear heights and automation-ready slabs. Forward funding deals reduce leasing risk and accelerate project timelines.
The Israel commercial real estate market size tied to logistics benefits from port diversification and highway upgrades that shorten last-mile delivery. Cold-chain facilities gain traction with pharmaceutical importers and grocery platforms seeking compliance with stringent temperature standards. Speculative supply remains measured, sustaining healthy occupancy and encouraging rental growth. By comparison, retail faces structural change as omnichannel strategies reshape store footprints. Hospitality rebounds with the return of business travel and regional tourism, yet owners prioritize adaptive re-use potential to hedge demand swings.


By Business Model: Sales Still Dominate Yet Leasing Gains Momentum
Sales transactions represented 73.20% of overall activity in 2025, reflecting local preference for asset ownership and ready mortgage availability. High-net-worth investors and family offices acquire income-generating buildings to preserve capital and hedge inflation. Nonetheless, leasing shows a robust 7.12% CAGR outlook as corporates optimize balance sheets and international entrants favor operational flexibility. Landlords craft lease terms incorporating index-linked escalations, shared maintenance, and early termination options. Sale-leaseback structures unlock capital for occupiers while ensuring long-term tenancy for owners.
Recurring rental revenues stabilize cash flow for REITs, supporting dividend visibility that attracts pension funds. The Israel commercial real estate market size attributable to leasing widens as developers deliver purpose-built campuses tailored for single or multi-tenant occupancy. Prop-tech platforms digitize contract management, automate invoicing, and enable data-driven asset optimization, improving both tenant experience and owner margins.
By End-User: Corporates and SMEs Drive Demand Momentum
Corporates and SMEs contributed 55.35% of market activity in 2025, supported by a vibrant start-up ecosystem and steady multinational expansion. Venture capital inflows finance workspace take-up, while global firms base R&D centers in proximity to Israel’s talent pools. Flexible-workspace providers aggregate smaller tenant demand into master leases, easing entry for new businesses. The segment is projected to expand at 6.36% through 2031, sustaining steady absorption across offices, light-industrial, and mixed-use portfolios.
Household and individual users remain important in street-level retail, food-and-beverage outlets, and small warehouses. Government and institutional tenants lend stability through long leases in Jerusalem and district capitals. The Israel commercial real estate market size is linked to government users, supporting infrastructure investment, particularly for public administration and healthcare facilities. Developers balance speculative and pre-let strategies to serve varying procurement timelines and compliance requirements.
Geography Analysis
Tel Aviv District’s 44.35% share underscores its unchallenged status as the country’s financial and technology nucleus. Prime office towers with LEED or WELL certifications achieve above-average occupancy as technology giants and fintech start-ups expand R&D headcount. The district’s proximity to Ben Gurion Airport improves executive mobility, while the new light-rail network widens commuter catchments and lifts retail footfall around station nodes.
Southern District growth of 6.63% CAGR reflects concerted government efforts to diversify economic activity away from the crowded center. Industrial parks near Be’er Sheva attract semiconductor subcontractors, renewable-energy integrators, and defense-tech producers. Logistics developers acquire large tracts along Highway 6 to build multi-client distribution campuses serving both domestic and export flows through Ashdod Port. Lower land costs enable higher plot ratios, while municipal tax incentives bolster project feasibility.
Central District suburbs such as Petah Tikva and Ramat Gan provide cost-effective alternatives for space-intensive occupiers. Corporates relocating non-client-facing functions benefit from competitive rents yet remain within 20 minutes of Tel Aviv’s CBD by rail. The district hosts the largest concentration of edge data-center projects, taking advantage of robust power grids and fiber connectivity.
Jerusalem’s commercial demand remains steady, led by government ministries, diplomatic missions, and academic institutions. Life-science incubators linked to hospitals and universities spur demand for specialized lab-enabled office space. Heritage preservation rules constrain new supply, maintaining occupier loyalty to existing high-quality assets.
Northern coastal nodes around Haifa witness incremental absorption tied to port privatization and rail upgrades. Near-shore warehousing and cross-dock facilities reduce congestion and enable 24-hour operations. Investors integrate renewable energy micro-grids to mitigate grid instability and meet corporate sustainability goals.
Regulatory Landscape
Israel's commercial real estate activity is shaped by the Planning and Building Law framework and the associated Planning and Building Regulations, administered through national and local planning and licensing bodies. In April 2025, Planning and Building Law (Amendment No. 160) was published, introducing a national, streamlined licensing procedure for national infrastructure and projects meeting defined scale thresholds (including projects with at least 80 residential units). This continues the policy focus on shortening approval timelines for large developments, with mixed-use spillover effects.
Regulatory adjustments in 2025 also aimed to preserve permitting continuity and standardize processes. In July 2025, Planning and Building Regulations (Building Licensing) (Temporary Provision) (No. 2), 2025 enabled local licensing authorities to issue occupancy permits when certain non-essential details remained incomplete, provided safety and habitability conditions were met. In September 2025, an amendment on the calculation of areas and building percentages standardized measurement approaches across plans and permits, which affects feasibility modeling, leasing efficiency metrics, and valuation comparability for income-producing assets.
Value Chain Analysis
Israel's commercial real estate value chain runs from land planning and allocation (national and local planning processes) through development, contracting and materials procurement, financing, brokerage and leasing, and property and facilities management. Developers and contractors coordinate design and compliance, often under tight scheduling constraints, while lenders and capital-market investors influence project phasing and pre-letting requirements. The Bank of Israel reported that as of September 2025, debt in the real estate and construction industries reached NIS 534 billion (36% of nonfinancial business sector debt), underscoring the importance of funding structure and covenant management across portfolios.
Execution economics remain sensitive to materials and labor availability. Construction inputs show short-term volatility in 2026, with road and bridging input-price indices recording a 2.5% monthly increase in May 2026, driven by asphalt (+10.7%) and quarry materials (+4.5%). Supplier announcements cited 10% to 20% price increases linked to global raw material costs. These dynamics increase the value of long-lead procurement, framework agreements, and integrated delivery planning. Procurement compliance also remains material, with the Israel Competition Authority enforcing prohibitions against bid rigging and sanctioning misconduct in construction-related tenders.
Competitive Landscape
The Israel commercial real estate market exhibits moderate concentration, with established domestic developers such as Azrieli Group, Melisron, and Gazit Globe leveraging deep landbanks and regulatory familiarity to secure prime sites. These firms pursue diversification across office, retail, logistics, and data-center verticals to smooth income cycles. Capital-raising via domestic REIT structures lowers funding costs, while strategic disposals unlock capital for new developments.
International entrants partner with local players to navigate zoning processes and security regulations. Global service providers CBRE, JLL, Cushman & Wakefield, and Colliers advise on cross-border capital deployment, portfolio management, and ESG compliance. Joint ventures blend foreign capital with on-the-ground execution expertise, mitigating geopolitical and currency risk.
Technology integration differentiates leading landlords. Smart-building platforms monitor energy consumption, predictive maintenance, and indoor-air quality, improving tenant satisfaction and lowering operating expenses. Flexible-workspace operators lease contiguous floors in prime towers, offering enterprises turnkey swing space. Developers pilot modular construction to cut build times and carbon footprints.
Israel Commercial Real Estate Industry Leaders
Arko Holdings Ltd
Ashtrom Group Ltd
Gazit-Globe Ltd
Azrieli Group Ltd
Melisron Ltd
- *Disclaimer: Major Players sorted in no particular order

Market Opportunities and Future Outlook
Transit-oriented, mixed-use commercial nodes and high-quality office environments anchored by technology tenants define visible whitespace, particularly where municipalities advance rail-adjacent districts and developers can assemble modern, efficient floorplates. Leasing momentum is supported by completed tenant actions in 2026, including large office commitments in Tel Aviv's Landmark complex, with Wiz and Cyberstarts leasing multiple floors in Landmark Tower B, and flexible workspace expansion (Mindspace announcing a 10,000 square meter office and conference hub at the Beyond tower in Givatayim). These steps reinforce demand for Grade-A buildings with strong digital infrastructure, power resilience, and amenity-rich specifications.
Beyond core Tel Aviv, specialized employment centers and industrial-office hybrids broaden the investable map, evidenced by BST Group commencing foundation work for a 43,000 square meter office tower for Nvidia in Ofer Yokneam park (May 2026). Development feasibility and underwriting discipline increasingly incorporate municipal Arnona property tax settings, including 2026 Arnona orders published by local councils, alongside infrastructure funding pathways such as the Governmental Urban Renewal Authority issuing a nationwide call for proposals for urban renewal infrastructure funding. On the delivery side, modular construction and ConTech tools remain active pathways to reduce build-phase risk and improve operating performance, supported by developer capabilities such as Tidhar's modular construction factory in Sderot operated in partnership with Elements Europe.
Recent Industry Developments
- July 2026: Azrieli Group retained Goldman Sachs to seek a strategic partner to invest around EUR 1 billion into its data center subsidiary, Green Mountain, at a reported valuation range of EUR 4 to 5 billion. The process highlights the role of data centers as a capital-intensive CRE adjacency and signals active capital recycling to fund platform expansion and pipeline acceleration.
- April 2026: Melisron announced completion of the marketing of all office spaces in Tower B of the Landmark Tel Aviv project, totaling 47,500 square meters. Full leasing progress in a flagship Tel Aviv office development supports pricing power for top-tier assets and increases competitive pressure on secondary stock to upgrade specifications and tenant experience.
- December 2024: Heightened security threats around Haifa Port raised the prospect of cargo diversion and operational disruption. This dynamic increased attention on redundancy in logistics routing and encouraged greater focus on alternative hubs and inland distribution nodes within Israel's commercial logistics footprint.


Research Methodology Framework and Report Scope
Market Definition and Coverage
This market covers income-generating commercial properties in Israel, where value is built using a mix of leasing activity and asset transactions across offices, retail spaces, logistics or industrial assets, and commercial-led mixed use properties.
Scope exclusions: Residential-only real estate, raw-land speculation, and vacant land held without a clear commercial development or leasing intent are not counted.
Segmentation Overview
- By Property Type
- Offices
- Retail
- Logistics / Industrial
- Others (Mixed-Use, Data-Centres)
- By Business Model
- Sales
- Rental
- By End-User
- Individuals / Households
- Corporates & SMEs
- Others
- By Region
- Tel-Aviv District
- Central District
- Jerusalem District
- Rest of Israel
Data Sources, Market Sizing, and Validation
Desk Research
Desk work started with public data that helps anchor the demand and supply picture for income-producing assets, including sources such as Israel Central Bureau of Statistics for construction and economic indicators, the Bank of Israel for interest rate and credit conditions, and Israel Tax Authority summaries that signal transaction momentum. We also referred to sources such as the Israel Land Authority for land and development context and the Ministry of Finance releases for macro assumptions used in scenario building.
To make the numbers practical, we reviewed company filings, investor presentations, and press releases to understand leasing trends, development pipelines, and capital-market activity. We then cross-checked the same themes using paid subscriptions for company financials and additional news coverage. When needed, patent databases were used only for directional signals around building-tech adoption, rather than direct sizing inputs. The specific desk sources listed here are illustrative, and many additional public and paid sources were used to collect data, validate points, and clarify assumptions.
Primary Interviews and Surveys
Primary discussions were run with asset owners, developers, brokers, lenders, and large occupiers to confirm what is actively leased, what is transacting, and how pricing is being set across major districts such as Tel Aviv, Central, Jerusalem, and the rest of Israel. We used these conversations to test gaps from desk inputs, especially on vacancy direction, effective rents after incentives, and how investors are adjusting return expectations under changing rates.
Distribution of primary research fieldwork respondents
| Company type | Respondent position | Region |
|---|---|---|
| Top tier: 29% | CXOs: 12% | APAC: 50% |
| Mid tier: 57% | Functional/Unit leaders: 33% | EMEA: 30% |
| Smaller Players: 14% | Managers: 55% | Americas: 20% |
Market-Sizing & Forecasting
The model is built using a top-down approach where macro real estate activity is reconstructed into commercial demand pools, and then filtered by Israel-specific leasing and transaction patterns. To keep it realistic, totals are corroborated with selective bottom-up approximations, such as sampled rent rolls and occupancy checks by asset type, plus a light roll-up of visible project pipelines and channel feedback.
Inputs used in the model include office and industrial vacancy direction, effective rent movement (including incentive pressure), cap-rate and yield expectations, construction completions and permit momentum, and interest rate and credit availability signals. Where a bottom-up view is not complete, gaps are handled using district-level benchmarks and conservative occupancy ranges that are re-tested in primary calls. Forecasting relies on scenario analysis supported by variable-level expectations shared by market participants, and then the final trajectory is smoothed so that one-off transaction spikes do not distort the forward curve.
Data Validation & Update Cycle
Outputs are checked against independent signals such as transaction momentum, lending conditions, and known leasing stress points, and then variances are reviewed before the numbers are finalized. If a key input moves sharply, like rates, vacancy, or a regulatory change that shifts investment appetite, we re-contact sources and rerun the sensitivity to confirm the direction and size of impact.
Each report is refreshed annually, and interim updates are made when material events can change pricing, liquidity, or the development pipeline. Before delivery, a final analyst pass is completed so clients receive an updated view that matches the latest available data.
Mordor Intelligence's Israel Commercial Real Estate Market Size Compared With Other Published Estimates
Published market sizes for Israel commercial real estate can look far apart because the boundaries are not always the same, and the underlying math is not always built from the same real-world signals. Differences show up quickly when one study leans more on broad real estate totals, while another focuses only on income-producing commercial assets.
Key gaps usually come from what is counted as commercial value (transaction value, rental income, or a mix), how mixed-use assets are treated, and whether the method normalizes for interest-rate driven price swings. By tracking district-level leasing signals and transaction activity, Mordor Intelligence keeps the 2026 value tied to commercial tenant-led assets rather than wider residential and land categories that inflate totals.
Benchmark comparison
| Source | Market Size | Gaps in Research Methodology |
|---|---|---|
| Mordor Intelligence | USD 20.45 B (2026) | |
| Market Research Publisher A | USD 19.21 B (2025) | Uses a different timing and base year, and the commercial scope appears to include hospitality and mixed-use more broadly, which can shift the value when investment sentiment changes. |
| Industry Tracker B | USD 172.30 B (2025) | Represents total Israel real estate, where residential, land, and ownership categories are included, so it is not directly comparable to a commercial-only market sizing. |
The spread across sources is mainly explained by scope boundaries and the year used for measurement, rather than a simple difference in growth expectations. When the counted value is restricted to income-producing commercial assets and is cross-checked with leasing, pricing, and financing signals, the final market size becomes easier to trace back to clear assumptions and repeatable steps.


Key Questions Answered in the Report
What is the current value of the Israel commercial real estate market?
The market is valued at USD 20.45 billion in 2026 and is forecast to reach USD 27.94 billion by 2031.
Which property type leads the market?
Offices hold the largest 39.25% Israel commercial real estate market share, anchored by technology and financial services tenants in Tel Aviv.
Where is the fastest growth occurring regionally?
The Central District shows the highest growth with a 6.86% CAGR forecast for 2026-2031, driven by logistics and industrial expansion.
Why are logistics assets attracting increased investor interest?
E-commerce growth, port diversification, and cold-chain demand are driving a 7.33% CAGR in logistics and industrial real estate.
How are developers mitigating rising construction costs?
They employ joint ventures, modular construction, value-engineering, and mixed-use density to protect margins amid record land and material prices.
What role do REITs play in the market?
Domestic pension-fund allocation into REITs provides liquid, inflation-linked capital that supports new development and asset acquisitions.
Page last updated on:






