Market Overview
| Study Period | 2020 - 2031 |
|---|---|
| Base Year For Estimation | 2025 |
| Forecast Data Period | 2026 - 2031 |
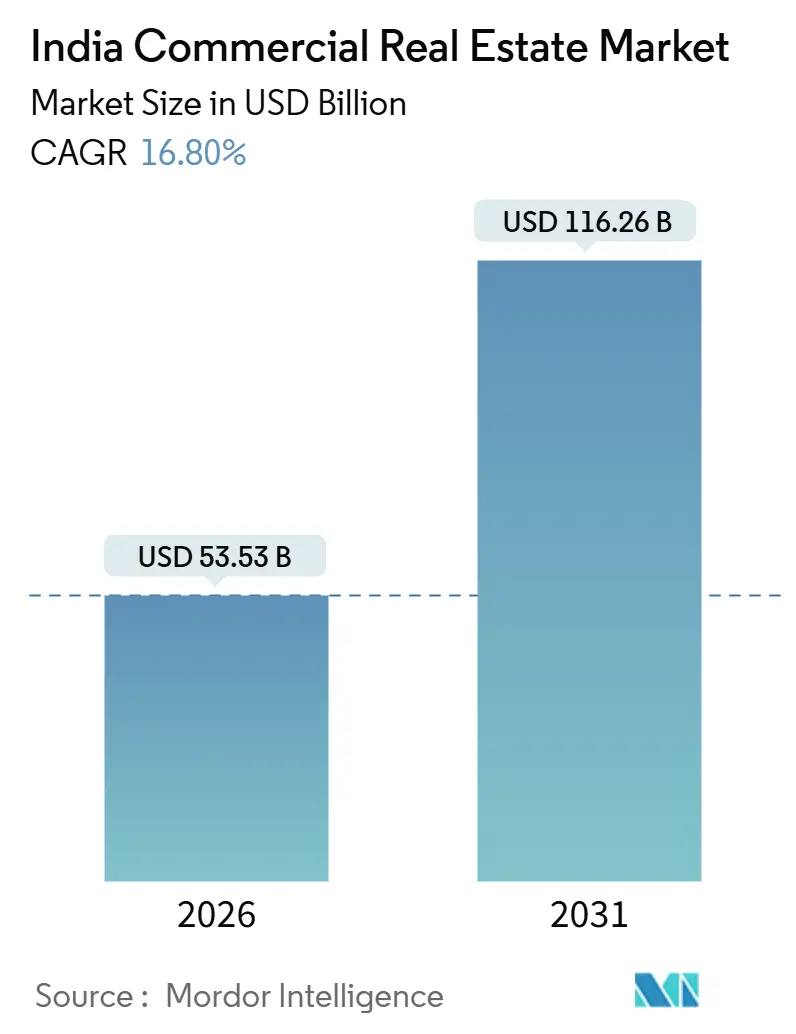
| Market Size (2026) | USD 53.53 Billion |
| Market Size (2031) | USD 116.26 Billion |
| Growth Rate (2026 - 2031) | 16.80% CAGR |
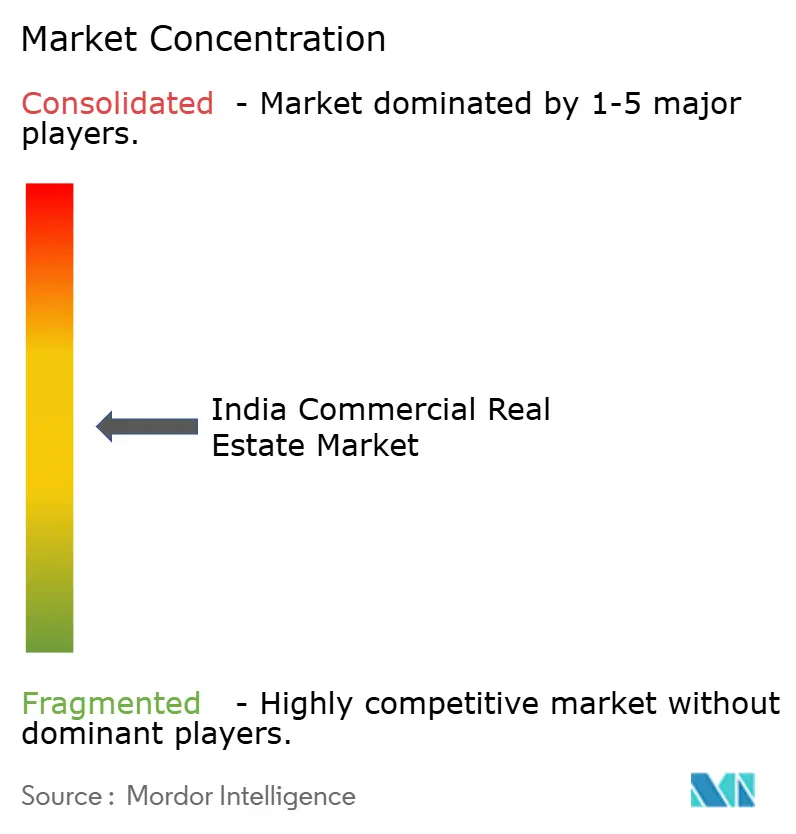
| Market Concentration | Medium |
Major Players *Disclaimer: Major Players sorted in no particular order Image © Mordor Intelligence. Reuse requires attribution under CC BY 4.0. | |
India Commercial Real Estate Market Analysis by Mordor Intelligence
The India Commercial Real Estate Market size is estimated at USD 53.53 billion in 2026, and is expected to reach USD 116.26 billion by 2031, at a CAGR of 16.80% during the forecast period (2026-2031). Growth is being propelled by a confluence of technology-sector hiring, infrastructure upgrades, and capital-market reforms that direct both domestic and foreign investors toward income-generating assets rather than speculative land banking. Office leasing still anchors value creation, yet logistics assets are absorbing capital fastest as e-commerce, quick-commerce, and data-center tenants lock in longer leases near consumption corridors. A shift from sales to rental structures is widening, aided by relaxed REIT rules, lower minimum investments, and foreign-direct-investment caps that now allow majority ownership in listed trusts. The new financing landscape is helping landlords deleverage, even as higher policy rates raise refinancing risks, because predictable rents underpin higher valuations for stabilized properties. Moderate concentration leaves space for regional specialists, flex-workspace managers, and data-center developers that can respond nimbly to occupier demand for flexible terms and technology-ready infrastructure.
Key Report Takeaways
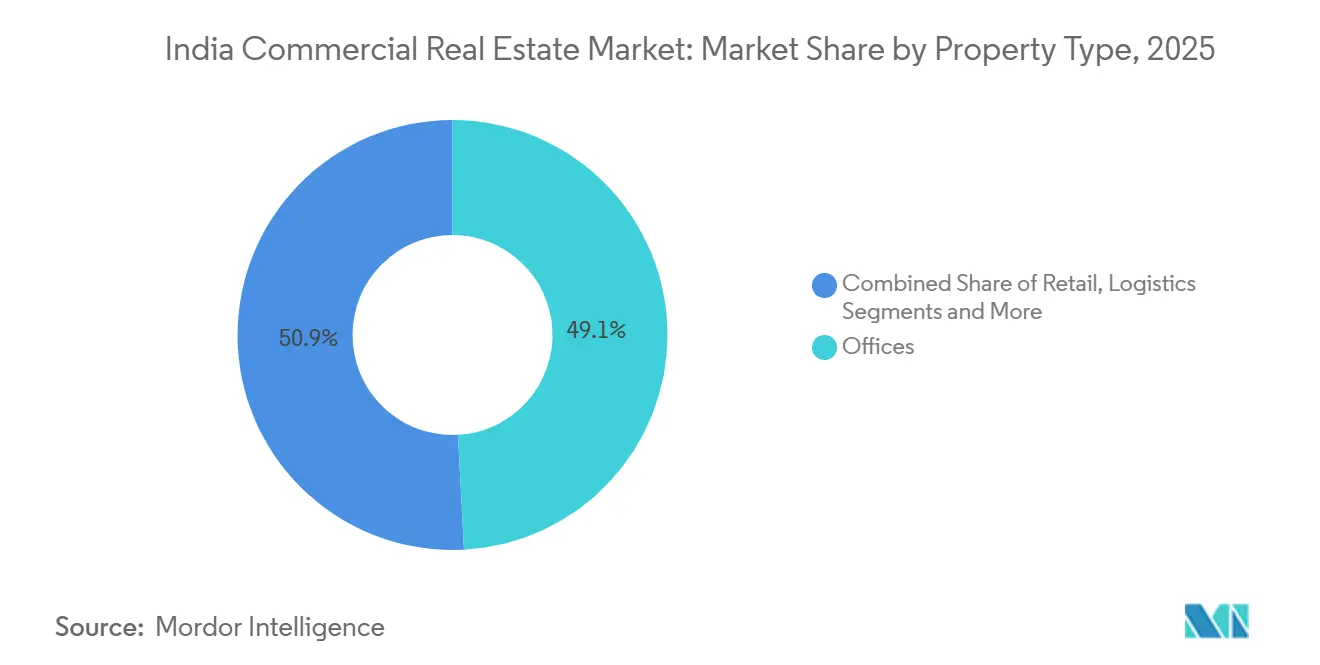
- By property type, logistics captured 18.60% CAGR growth potential between 2026 and 2031, while offices held 49.14% of India's commercial real estate market share in 2025.
- By business model, sales accounted for 54.14% of the India commercial real estate market size in 2025, whereas the rental segment is forecast to rise at an 18.50% CAGR through 2031.
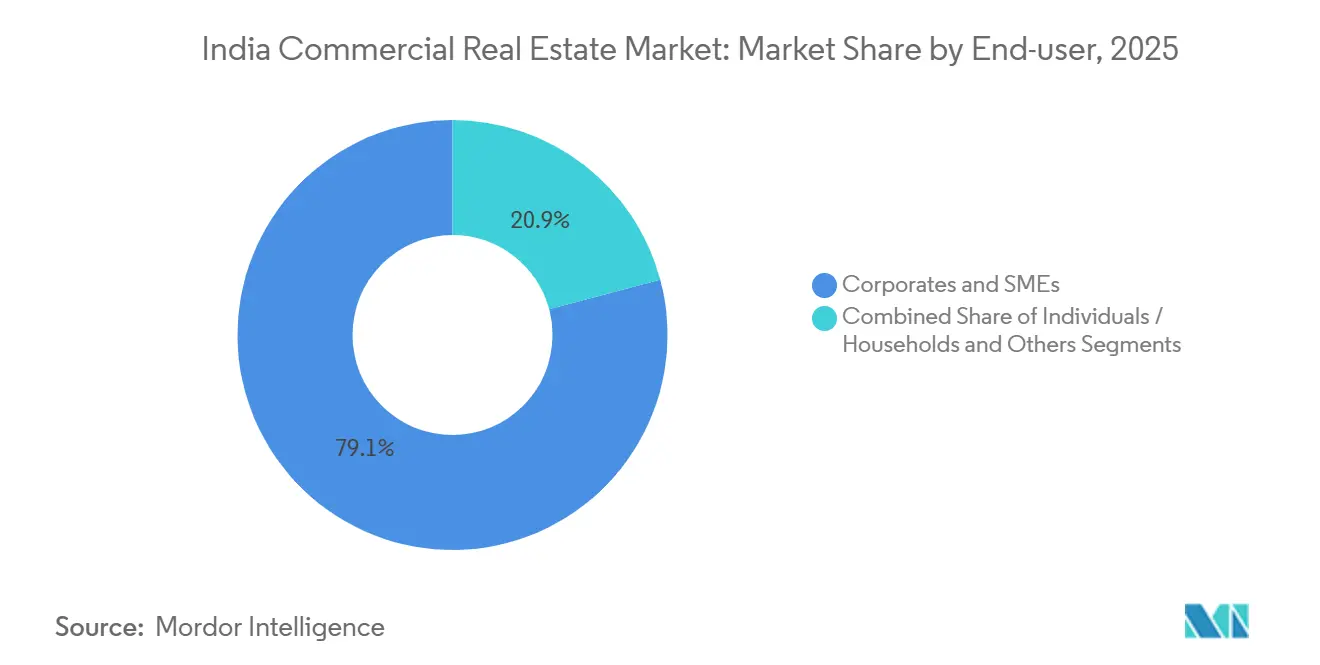
- By end user, corporates and SMEs commanded 79.14% of the India commercial real estate market size in 2025, while individuals and households are advancing at an 18.30% CAGR to 2031.
- By geography, South India led with 41.14% of India's commercial real estate market share in 2025; North India is set to expand at 18.70% CAGR to 2031.
- Embassy Office Parks REIT, Mindspace Business Parks REIT, and Brookfield India REIT together controlled more than 100 million sq ft of Grade-A leasable area in December 2025, equal to roughly 35% of institutionally owned stock.
Note: Market size and forecast figures in this report are generated using Mordor Intelligence’s proprietary estimation framework, updated with the latest available data and insights as of January 2026.
India Commercial Real Estate Market Trends and Insights
Drivers Impact Analysis
| Driver | (~) % Impact on CAGR Forecast | Geographic Relevance | Impact Timeline |
|---|---|---|---|
| AI-Led GCC Expansion Driving Grade-A IT Office Demand | +4.2% | Bangalore, Hyderabad, National Capital Region | Medium term (2-4 years) |
| E-Commerce & Quick-Commerce Growth Fueling Large-Format Urban Logistics Hubs | +3.8% | Top-7 metros with focus on Mumbai, NCR, Bangalore | Short term (≤ 2 years) |
| REIT Pipeline Expansion & Relaxed FDI Caps Unlocking Institutional Capital | +3.5% | National, concentrated in the core office districts of major cities | Long term (≥ 4 years) |
| National Infrastructure Programs Improving Connectivity and Land Values | +3.2% | Economic corridors linked to GatiShakti, Delhi–Mumbai & Chennai–Bengaluru | Long term (≥ 4 years) |
| Data-Centre Colocation & Edge-Computing Campuses Repurposing Industrial Plots | +2.9% | Mumbai, Chennai, Hyderabad, National Capital Region | Medium term (2-4 years) |
| Sustainability-Linked Leases & Green-Retrofit Demand from ESG-Minded Occupiers | +2.4% | Tier-1 CBDs and suburban parks with LEED and IGBC certified stock | Medium term (2-4 years) |
| Source: Mordor Intelligence | |||
AI-Led GCC Expansion Driving Grade-A IT Office Demand
India hosted more than 1,700 Global Capability Centers by December 2025, employing 1.6 million professionals and absorbing nearly 60 million sq ft annually, a scale that anchors occupier demand for technologically advanced campuses[1]NASSCOM Research, “India GCC Landscape Report 2025,” NASSCOM, nasscom.in. Rents in Bangalore’s Outer Ring Road corridor climbed to INR 90–110 per sq ft per month in 2025, a 20% premium over suburban alternatives as multinationals race to secure talent pools. Pre-leasing is now commonplace 18–24 months ahead of completion, compressing future vacancy risk but limiting tenant negotiation latitude. Hyderabad’s Knowledge City and Chennai’s OMR corridor mirror the trend, while Tier-2 locations such as Kochi and Coimbatore are piloting GCC pilots that could capture about 10% of incremental demand once infrastructure matures. These moves consolidate South India’s dominance yet create leasing spill-over into nearby corridors as core sub-markets approach saturation.
E-Commerce & Quick-Commerce Growth Fueling Large-Format Urban Logistics Hubs
Logistics absorption breached 45 million sq ft in 2025, and Grade-A warehouses in peri-urban Mumbai, NCR, and Bangalore rented for INR 25–35 per sq ft per month, reflecting tight supply. Third-party logistics providers and online retailers increasingly sign nine- to twelve-year contracts for 500,000 sq ft blocks, replacing the shorter three- to five-year terms typical before 2024. The central government’s PM GatiShakti plan shortened freight times by upward of 10%, strengthening hub-and-spoke models. Delays in land aggregation, however, added up to twelve months to projects in Maharashtra and Uttar Pradesh, sustaining upward pressure on rents and cap rates. Operators able to navigate state-level approvals quickest are rewarded with near-full occupancy at handover.
REIT Pipeline Expansion & Relaxed FDI Caps Unlocking Institutional Capital
India’s listed REIT capitalization surpassed USD 15 billion in December 2025 and distributed USD 1.2 billion in dividends at 6–7% yields, drawing portfolio inflows from pension and insurance investors[2]Securities and Exchange Board of India, “Gazette Notification: REIT Regulations (Amendment) 2024,” Securities and Exchange Board of India, sebi.gov.in. SEBI’s 2024 revision that cut the minimum ticket size to INR 10,000 opened the asset class to retail buyers, improving secondary-market liquidity. Foreign portfolio investors raised their allocation by more than 20% in 2025, capitalizing on embedded lease escalations of about 12% every three years. Further, the DPIIT move to lift the automatic FDI ceiling in REITs to 74% allows sponsors to retain operational control while monetizing stabilized assets. Developers like DLF and Prestige are now evaluating office and retail portfolio spin-offs, potentially adding USD 5–7 billion in fresh supply over the next three years.
Data-Center Colocation & Edge-Computing Campuses Repurposing Industrial Plots
National data-center capacity neared 950 MW by late 2025, backed by capex pledges exceeding USD 10 billion from hyperscalers. Colocation leaders such as Yotta Infrastructure and AdaniConneX pivoted idle industrial parcels in Navi Mumbai, Chennai, and Hyderabad into edge sites to cut latency for high-frequency users. Land values in Navi Mumbai rose 35% in 2025, underlining scarcity where power reliability and cable access intersect. Telangana and Tamil Nadu governments fast-tracked clearances for 50 MW-plus projects, cutting cycle times to under a year. Demand is fragmenting toward 5–10 MW modules in Tier-2 cities, a shift that benefits regionally skilled developers with better local permitting networks.
Restraints Impact Analysis
| Restraint | (~) % Impact on CAGR Forecast | Geographic Relevance | Impact Timeline |
|---|---|---|---|
| Elevated Policy Rates & Tighter Bank Lending Standards Raising Refinancing Risk | −2.8% | Nationwide, most acute in highly leveraged Tier-1 projects | Short term (≤ 2 years) |
| Hybrid/Remote Work Persistently Dampening Net Absorption in CBDs | −2.1% | Mumbai, NCR, Bangalore core business districts | Medium term (2-4 years) |
| Land Acquisition Delays & Multi-Agency Approvals Slowing Project Starts | −1.9% | Maharashtra, Uttar Pradesh, West Bengal, and select Tier-2 urban fringes | Medium term (2-4 years) |
| Rising Climate-Risk Insurance Premia for Coastal Assets: Reducing Investor IRRs | −1.7% | Coastal metros—Mumbai, Chennai, Kolkata—and low-lying logistics corridors | Long term (≥ 4 years) |
| Source: Mordor Intelligence | |||
Elevated Policy Rates & Tighter Bank Lending Standards Raising Refinancing Risk
The Reserve Bank of India left the repo rate at 6.50% in early 2026 and commercial banks priced developer loans at 9.5–11%, lifting weighted-average capital costs to 12–13%. Non-bank financiers trimmed loan-to-value ceilings to 60–65%, forcing sponsors to inject more equity or seek joint ventures. Margins for mid-sized players thinned as refinance spreads widened 150–200 basis points between 2024 and 2025, triggering selective land divestments in Mumbai and NCR corridors[3]Insurance Regulatory and Development Authority of India, “Climate Risk and Insurance Premium Guidelines 2025,” IRDAI, irdai.gov.in. Developers diversified into asset-light fee income property management and co-development to preserve cash flow. Firms with multi-asset portfolios, such as DLF and Prestige, weathered the squeeze better than single-asset owners that faced liquidity stress.
Hybrid/Remote Work Persistently Dampening Net Absorption in CBDs
Hybrid policies stabilized around 45% of white-collar roles in 2025, lowering seat density needs from 90–100 sq ft per head to 65–75 sq ft. Mumbai’s Bandra-Kurla Complex and Delhi’s Connaught Place posted 18–22% vacancy as tenants migrated to suburban parks offering lower rents and larger floor plates. Landlords extended rent-free periods of six to nine months for renewals, compressing effective yields. Meanwhile, selected suburban assets in Gurugram and Powai enjoyed 10-12% net absorption growth, highlighting occupier cost-sensitivity and preference for amenity-rich campuses. Capitalization-rate spreads of roughly 150 basis points now separate Grade-A suburban and legacy CBD towers, suggesting investor skepticism over expensive retrofits.
Segment Analysis
By Property Type: Logistics Outpaces Traditional Office Growth
Logistics gross leasable area expanded by 45 million sq ft in 2025, and the segment is projected to post 18.60% CAGR from 2026–2031, the fastest trajectory among all property classes, as e-commerce and quick-commerce operators sign 9 to 12 year leases for mega-warehouses near consumption hubs. Offices retained 49.14% of the Indian commercial real estate market share in 2025, but rising hybrid adoption tempers incremental demand. Retail captured 21% of value when mall developers added experiential features that raise dwell time and justify 8–10% annual rent escalations. Hospitality and other specialty assets together accounted for roughly 11%, buoyed by leisure-travel recovery in Goa and Rajasthan.
The India commercial real estate market size for logistics is on track to surpass USD 30 billion by 2031, while offices are forecast to reach USD 55 billion as net absorption normalizes post-2028. Logistics capitalization rates compressed to 7.25–7.75% in 2025, just 25 basis points higher than comparable office yields, underscoring investor confidence in long-term e-commerce fundamentals. Offices still draw core capital due to deep tenant rosters and embedded 12–15% rent escalations every three years. Retail’s pipeline remains selective, focusing on tier-1 and affluent tier-2 catchments where discretionary spending is resilient. Hotel transactions crossed USD 900 million in 2025 as international operators locked in management contracts amid rising occupancy.


By Business Model: Rental Segment Gains Institutional Favor
The rental structure is forecast to expand at 18.50% CAGR through 2031 as REIT sponsors and pension funds prioritize stable coupons over speculative capital gains. Sales transactions comprised 54.14% of India's commercial real estate market size in 2025, led by corporates purchasing high-street stores and industrial parcels for self-use. Build-to-lease pipelines expanded sharply: developers such as RMZ and Tata Realty pre-let entire towers 24 months ahead of delivery, ensuring bankability and lowering funding costs.
Grade-A office rental yields stabilized between 7.5–8.5% in Bangalore and Hyderabad during 2025, offering a 250-basis-point cushion over 10-year gilts and drawing USD 3 billion of foreign portfolio inflows into listed REITs. Conversely, headline prices for marquee high-street retail in Mumbai’s Linking Road topped INR 80,000 per sq ft, anchored by luxury tenants whose stable rents mitigate entry yields below 5%. Industrial land prices in Chennai and Pune logistics belts advanced 25% year on year, encouraging landowners to consider long-term leasehold structures that preserve upside while lowering stamp-duty leakage.
By End-User: Individual Participation Expands via Fractional Platforms
Corporations and SMEs captured 79.14% of the India commercial real estate market size in 2025, predominantly through long-term leases in Grade-A offices and warehouses. Individual investors, however, are projected to grow at 18.30% CAGR as fractional-ownership portals allow minimum tickets of INR 500,000 for stabilized assets. The “others” bucket, government and educational institutions, remains below 7% of demand yet shows steady leasing for administrative back-office and campus expansions.
Fractional platforms syndicated roughly USD 1 billion of commercial stock in 2025, listing 60 assets that generated 6–7% cash yields paid quarterly. Retail investors favored Tier-2 high-street shops in cities like Jaipur and Kochi, where entry costs are lower and yield spreads versus residential stay wider at 200–300 basis points. Regulatory clarity remains nascent, but draft SEBI rules expected in 2026 may categorize fractional vehicles under collective-investment schemes, improving governance and unlocking institutional coinvestment.
Note: Segment shares of all individual segments available upon report purchase
Geography Analysis
South India commanded 41.14% of India's commercial real estate market share in 2025, anchored by Bangalore’s annual office absorption of about 22 million sq ft and Hyderabad’s 400-plus GCCs employing 300,000 professionals. Chennai secured USD 1.8 billion in data-center capex during 2025 owing to carrier-neutral cable landings and abundant renewable power. Kochi and Coimbatore grew 18% and 20%, respectively, as pilot GCCs validated Tier-2 talent pools and livability advantages.
North India will likely post the fastest 18.70% CAGR through 2031, catalyzed by the Delhi-Meerut Expressway and the upcoming Jewar Airport that shortens transit and unlocks parcels along the Yamuna Expressway. Gurugram and Noida together absorbed about 17 million sq ft in 2025, with financial-services and e-commerce tenants gravitating toward suburban parks that combine large floor plates, lower rents, and metro access. Renewed policy focus on data-center clusters within NCR’s Knowledge Park and the upcoming Digital Gateway hub could accelerate hyperscale investments.
West India, led by Mumbai and Pune, represented 31% of the value in 2025. Bandra-Kurla Complex and Lower Parel demanded India’s highest office rents at INR 150–200 per sq ft per month, yet vacancy edges higher as some occupiers relocate to knowledge parks in Powai and Thane for 30% savings. Pune’s Hinjewadi and Kharadi corridors clocked 9 million sq ft of take-up in 2025, supported by technology exporters scaling captive centers.
East India, dominated by Kolkata, still accounts for under 10% of the national stock. Limited Grade-A supply and hybrid work have restrained absorption, but developers are launching retail-led mixed-use assets to capture consumer-spending tailwinds. Tier-2 cities—including Jaipur, Chandigarh, and Indore—registered 22% average absorption growth in 2025 as occupiers diversify geographic risk; however, exit liquidity constraints sustain capitalization-rate premiums of 100–150 basis points over Tier-1 equivalents.
Competitive Landscape
India's commercial real estate market remains moderately fragmented; the top ten developers and REITs collectively control 35–40% of Grade-A office and logistics supply, leaving room for regional specialists focused on Tier-2 corridors. Embassy Office Parks REIT, Mindspace Business Parks REIT, and Brookfield India REIT manage more than 100 million sq ft and harvested USD 1.2 billion in dividends in 2025, offering 6–7% yields that compete with high-grade bonds[4]Embassy Office Parks REIT, “Quarterly Results Q3 FY26,” Embassy Office Parks, embassyofficeparks.com. DLF, Godrej Properties, Oberoi Realty, and Prestige Estates have pivoted to mixed-use campuses that blend office, retail, and residential, insulating cash flows from single-asset shocks.
Flex-space operators Awfis and WeWork India lifted managed portfolios by nearly 30% in 2025, catering to enterprises moving from long-term leases to pay-per-desk models. Data-center specialists such as Yotta Infrastructure and AdaniConneX accelerated capacity, extracting premiums for low-latency locations near submarine cable landings.
PropTech platforms offering blockchain title verification and AI tenant matching have compressed deal cycles and squeezed traditional brokerage margins, reshaping intermediary economics. Regulatory clarity under RERA and streamlined state-level approvals improved transparency, but multi-agency sign-offs still delay starts by up to a year in Maharashtra and Uttar Pradesh.
India Commercial Real Estate Industry Leaders
DLF Ltd
Godrej Properties Ltd
Oberoi Realty
Prestige Estates Projects Ltd
Brigade Enterprises Ltd
- *Disclaimer: Major Players sorted in no particular order

Recent Industry Developments
- January 2026: DLF announced a 2 million sq ft office tower in Gurugram’s Cyber City, with 60% space pre-leased to two global technology firms.
- December 2025: Brookfield India REIT bought a 1.5 million sq ft asset in Bangalore’s Whitefield for USD 350 million, aiming for an 8% yield.
- November 2025: Godrej Properties teamed with a Singapore sovereign fund to develop a 3 million sq ft logistics park near Mumbai, budgeting USD 250 million.
- October 2025: Prestige Estates launched a 1.2 million sq ft retail mall in Hyderabad, achieving 70% pre-leasing at 15% rent premium.


India Commercial Real Estate Market Report Scope
Commercial real estate (CRE) is only used for business-related activities or to offer a workspace, as opposed to being utilized as a residence, which would fall under the residential real estate category. Most frequently, renters lease commercial real estate to conduct businesses that generate cash.
A complete background analysis of the India Commercial Real Estate Market, including the assessment of the economy and contribution of sectors in the economy, market overview, market size estimation for key segments, and emerging trends in the market segments, market dynamics, and geographical trends, and COVID-19 impact is included in the report. The India Commercial Real Estate Market is Segmented by Type (Offices, Retail, Industrial and Logistics, and Hospitality) and By Key Cities (Mumbai, Bangalore, Delhi, Hyderabad, and Other Cities). The report offers market size and forecasts for the Commercial Real Estate Market in India in value (USD) for all the above segments.
By Property Type
| Offices |
| Retail |
| Logistics |
| Others (industrial real estate, hospitality real estate, etc.) |
By Business Model
| Sales |
| Rental |
By End-user
| Individuals / Households |
| Corporates & SMEs |
| Others |
By Geography
| West |
| South |
| North |
| East |
| By Property Type | Offices |
| Retail | |
| Logistics | |
| Others (industrial real estate, hospitality real estate, etc.) | |
| By Business Model | Sales |
| Rental | |
| By End-user | Individuals / Households |
| Corporates & SMEs | |
| Others | |
| By Geography | West |
| South | |
| North | |
| East |


Key Questions Answered in the Report
How large is the India commercial real estate market in 2026, and what is its expected value by 2031?
The India commercial real estate market stands at USD 53.53 billion in 2026 and is projected to reach USD 116.26 billion by 2031, tracking a 16.8% CAGR.
Which property type is expanding fastest?
Logistics assets are projected to grow at an 18.60% CAGR between 2026 and 2031, outpacing offices and retail.
What share do offices hold within the national commercial stock?
Offices accounted for 49.14% of the national commercial real estate value in 2025, making them the single largest component.
Why are rentals gaining favor over outright purchases?
Institutional investors favor predictable cash flows, and relaxed REIT rules have increased access to rental income streams, lifting rental-model growth prospects to an 18.50% CAGR through 2031.
Page last updated on:


