
Market Overview
| Study Period | 2020 - 2031 |
|---|---|
| Forecast Data Period | 2026 - 2031 |
| Base Year Market Size (2025) | USD 4.03 Billion |
| Market Size (2026) | USD 4.31 Billion |
| Market Size (2031) | USD 6.04 Billion |
| Growth Rate (2026 - 2031) | 6.99 % |
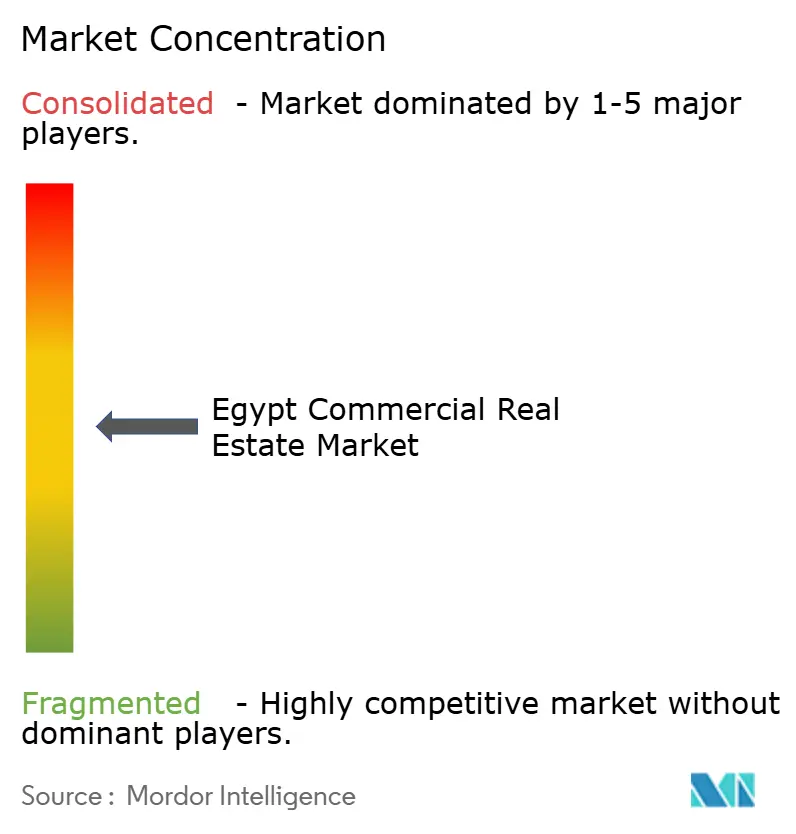
| Market Concentration | Medium |
Major Players *Disclaimer: Major Players sorted in no particular order Image © Mordor Intelligence. Reuse requires attribution under CC BY 4.0. | |
Egypt Commercial Real Estate Market Analysis by Mordor Intelligence
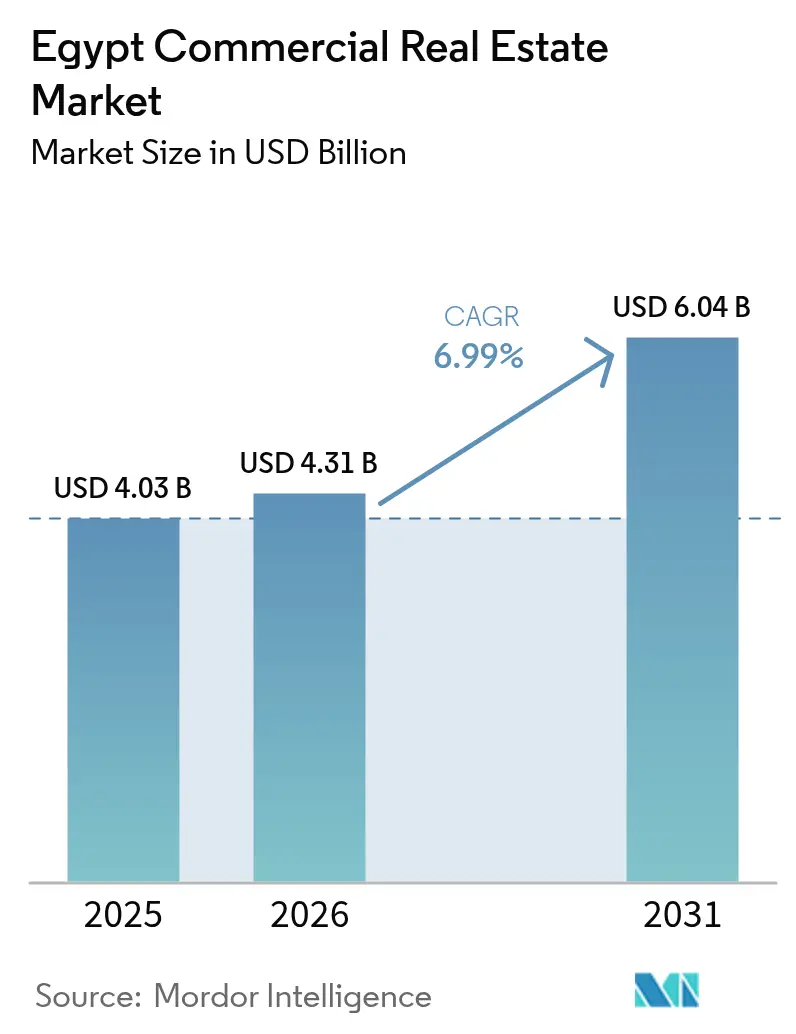
Egypt commercial real estate market size in 2026 is estimated at USD 4.31 billion, growing from 2025 value of USD 4.03 billion with 2031 projections showing USD 6.04 billion, growing at 6.99% CAGR over 2026-2031. Robust infrastructure spending, liberalized land‐ownership laws, and record foreign direct investment are reshaping the sector’s demand profile, especially around the New Administrative Capital and the Suez Canal Economic Zone. Corporate relocations, tourism recovery, and surging e-commerce volumes are broadening asset-class appeal while diversified funding channels sustain development momentum despite a high-interest-rate environment. Currency stabilization prospects and hard-currency lease structures further improve the Egypt commercial real estate market’s risk-adjusted returns for global investors. Simultaneously, sustainability mandates and smart-city frameworks are forcing landlords to upgrade inventories to maintain competitive positioning.
Key Report Takeaways
- By property type, offices commanded 43.02% of the Egypt commercial real estate market share in 2025, whereas retail assets are projected to expand at a 9.60% CAGR through 2031.
- By business model, the rental segment held 73.62% of the Egypt commercial real estate market size in 2025, while sales transactions are advancing at an 8.44% CAGR to 2031.
- By end-user, corporate and SME occupiers accounted for 69.94% of overall demand in 2025; household participation is climbing at a 9.18% CAGR through 2031.
- By geography, Greater Cairo retained 60.05% share of the Egypt commercial real estate market in 2025, yet secondary locations are accelerating at an 11.20% CAGR to 2031.
Note: Market size and forecast figures in this report are generated using Mordor Intelligence’s proprietary estimation framework, updated with the latest available data and insights as of 2026.
Egypt Commercial Real Estate Market Trends and Insights
Drivers Impact Analysis*
| Driver | (~) % Impact on CAGR Forecast | Geographic Relevance | Impact Timeline |
|---|---|---|---|
| Government mega-projects (New Admin Capital, SCZone) | +2.1% | New Administrative Capital, Suez Canal Economic Zone | Short term (≤ 2 years) |
| Rapid population growth & urbanisation pressures | +1.8% | Greater Cairo, Alexandria, Giza | Long term (≥ 4 years) |
| Tourism-led demand for hospitality & retail assets | +1.2% | North Coast, Red Sea, Greater Cairo | Medium term (2-4 years) |
| Booming e-commerce boosts logistics & last-mile hubs | +0.9% | Greater Cairo, Alexandria, industrial zones | Medium term (2-4 years) |
| Near-shoring of EU manufacturing to Egyptian free-zones | +0.7% | Suez Canal Economic Zone, industrial free zones | Long term (≥ 4 years) |
| Green-building incentives & sustainability mandates | +0.4% | New Administrative Capital, Greater Cairo | Long term (≥ 4 years) |
| Source: Mordor Intelligence | |||
Government Mega-Projects Establish New Commercial Epicenters
The USD 58 billion New Administrative Capital and the expanding Suez Canal Economic Zone exemplify state-led urban catalysts that anchor private investment. Ministry relocations instantly populate office districts, while logistics parks like Mercedes-Benz’s Sokhna hub validate industrial take-up. Such integrated ecosystems lower investor risk by guaranteeing early-stage occupancy and infrastructure readiness. Fiscal incentives and streamlined permitting under the Golden Licence program further compress project gestation periods, supporting rapid absorption. These mega-projects hence recalibrate supply–demand balances, elevating the Egypt commercial real estate market into a regional node for governmental, industrial, and service activities[1].
Rapid Population Growth & Urbanization Pressures
Egypt’s demographic expansion is compelling developers to pioneer satellite cities such as the 170,000-acre New Administrative Capital designed for 6.5 million residents. This distributed urban model lessens congestion in central Cairo and sparks demand for integrated office, retail, and logistics complexes that operate as self-contained economic ecosystems. Projects like the 1.5 Million Feddan scheme couple agricultural expansion with industrial-zone creation, widening commercial footprints beyond legacy corridors. As populations shift, mixed-use projects that bundle civic, residential, and commercial functions gain a structural demand advantage. Consequently, the Egypt commercial real estate market is evolving toward polycentric growth nodes that diversify risk and enhance tenant optionality.
Tourism-Led Demand For Hospitality & Retail Assets
Egypt leads Africa’s hotel pipeline with 143 properties under development, and global brands such as Hilton plan to triple their local portfolios. The USD 150 billion Ras El-Hekma mega-project targets 8 million annual visitors, catalyzing mixed retail and entertainment formats that serve both tourists and residents. Lifestyle hotel concepts and experiential shopping centers are proliferating to satisfy new traveler preferences, spawning secondary demand for logistics, food-service, and warehousing facilities. As visitor numbers climb, transitional spending across dining, transport, and leisure reinforces rental resilience in adjacent retail corridors. The tourism rebound therefore multiplies revenue streams beyond direct hospitality returns, deepening the Egypt commercial real estate market’s diversification.
Booming E-Commerce Transforms Logistics Requirements
National platforms such as the Nafeza single-window system and Advanced Cargo Information streamline customs clearance, enabling faster last-mile delivery decisions. AD Ports Group’s 20 km² KEZAD East Port Said Zone integrates bonded warehousing with fulfillment operations, serving both international trade and domestic online retail. Demand is shifting toward modern distribution centers that combine cross-docking, temperature-controlled storage, and returns processing capabilities. Developers that can deliver Grade-A space near population clusters secure premium rents and longer leases. As digital penetration climbs, e-commerce continues to unlock a material share of the Egypt commercial real estate market’s future pipeline.
Restraints Impact Analysis*
| Restraint | (~) % Impact on CAGR Forecast | Geographic Relevance | Impact Timeline |
|---|---|---|---|
| Double-digit inflation & high financing costs | -1.4% | National, with acute impact in Greater Cairo | Short term (≤ 2 years) |
| Egyptian-pound volatility vs. hard-currency rents | -0.8% | National, particularly affecting foreign investors | Medium term (2-4 years) |
| Escalating construction input costs | -0.6% | National, concentrated in major development zones | Short term (≤ 2 years) |
| Land-title & registration inefficiencies | -0.3% | National, with regional variations in processing | Long term (≥ 4 years) |
| Source: Mordor Intelligence | |||
Double-Digit Inflation Pressures Development Economics and Tenant Affordability
Annual inflation above 25% forces the Central Bank to uphold a 28.25% overnight lending rate, driving construction loan pricing into double digits. Developers either delay launches or pivot to presales and partnership financing to preserve margins. Operating costs also climb: utility tariffs rose 43.6% year-over-year, and commercial rents increased 12.7%, squeezing tenant affordability. Prime assets with hard-currency leases sustain occupancy, but secondary stock witnesses elevated churn. Over time, price normalization and alternative funding vehicles should stabilize capital costs within the Egypt commercial real estate market.
Currency Volatility Creates Investment Uncertainty Despite Fundamental Strengths
Three devaluations since 2024 expanded the USD/EGP corridor, prompting investors to prefer dollar-indexed leases. Goldman Sachs now pegs the pound as 30% undervalued, yet policy signaling remains a market-sentiment swing factor. Banks face capital-adequacy erosion, tempering construction-loan appetite. Nevertheless, a USD 35 billion UAE commitment in Ras El-Hekma and augmented IMF backing uplift foreign-currency liquidity, hinting at medium-term exchange-rate stabilization. Until clarity emerges, sponsors hedge via offshore debt and hard-currency presales within the Egypt commercial real estate market.
*Our forecasts treat driver/restraint impacts as directional, not additive. The impact forecasts reflect baseline growth, mix effects, and variable interactions.
Segment Analysis
By Property Type: Offices Dominate While Retail Surges
Offices secured 43.02% of the Egypt commercial real estate market share in 2025, buoyed by the relocation of 14 ministries and more than 48,000 staff to the New Administrative Capital. Grade-A towers like Infinity Tower (160 meters, LEED Platinum-targeted) are 70% complete and pre-leased to multinational tenants demanding environmentally certified space. The segment benefits from long leases, ancillary service demand, and government anchor occupancy that de-risks vacancy exposure. Meanwhile, retail assets are projected to post a 9.60% CAGR through 2031, the fastest across property types, as tourism rebounds and lifestyle centers such as Cairo Festival City Mall (USD 566.7 million) reopen with flagship tenants. Developers are blending experiential formats food halls, entertainment clusters, and digital storefronts to attract spending and extend dwell times.
The logistics sub-category gains structural support from Egypt’s trade ambitions. Mercedes-Benz’s Sokhna logistics park and AD Ports Group’s USD 120 million KEZAD zone illustrate the pivot toward build-to-suit facilities proximate to multimodal corridors. Industrial assets within the “Others” bucket tap near-shoring demand, especially from EU manufacturers leveraging duty-free access. Rising land prices in coastal projects such as Ras El-Hekma encourage vertical mixed-use clustering, spreading risk across retail, hospitality, and office stacks. Consequently, the Egypt commercial real estate market size for logistics is expected to widen its revenue slice as e-commerce consolidates share.


By Business Model: Rental Predominance Under Tight Credit
Rental agreements captured 73.62% of the Egypt commercial real estate market size in 2025 owing to high borrowing costs and corporate preferences for operational flexibility. Institutional financiers support this model: a USD 343.3 million facility for Palm Hills’ Badya and a USD 138 million loan for SODIC’s Karmell were structured around stabilized rental cash flows. Tenants gravitate toward hard-currency denominated leases to hedge inflation, further reinforcing landlord income security. The sales pathway, however, is quickening at an 8.44% CAGR to 2031 after the 2024 Desert Land Law amendment removed foreign-ownership caps, sparking offshore interest in strata titles and bulk acquisitions. As rent control reforms phase in 20-fold increases over five years, some occupiers may pivot to ownership once price parity emerges.
Hybrid models are also germinating. Sale-and-leaseback deals enable corporates to unlock capital while retaining operational control, and profit-sharing arrangements align developer and retailer incentives in new lifestyle malls. This flexibility supports transaction diversity, ultimately expanding liquidity channels in the Egypt commercial real estate market.
By End-User: Corporate Demand Leads, Households Accelerate
Corporate and SME occupiers generated 69.94% of total take-up in 2025, underpinned by headquarter moves, manufacturing expansion in free zones, and rising demand for tech-ready space. Multinationals impose ESG and health-safety standards, nudging developers toward smart building management systems and renewable power integration. Household and high-net-worth investors, although smaller, are growing at a 9.18% CAGR as liberalized ownership and fintech mortgage solutions improve accessibility. GCC investors, funneling USD 115 billion since 2021, often co-invest with local partners, blending regional liquidity with on-ground expertise.
Institutional capital remains active: Egypt’s M&A volume climbed 21% with USD 46.1 billion in FDI during 2024, and sovereign funds increasingly anchor development vehicles targeting green and social infrastructure. This diversified buyer base underpins resilience across the Egypt commercial real estate industry’s demand spectrum.

Geography Analysis
Greater Cairo’s unified metropolitan area, inclusive of the 170,000-acre New Administrative Capital, maintained 60.05% of Egypt commercial real estate market share in 2025 thanks to its governmental, financial, and consumer density. The Forbes International Tower’s hydrogen-powered blueprint signals the city’s ambition to set regional sustainability benchmarks, helping prime offices secure pre-leases from ESG-driven multinationals. Retail remains robust: Cairo Festival City Mall reopened after a USD 566.7 million upgrade featuring Egypt’s inaugural IKEA and a new Carrefour hypermarket, reaffirming the capital’s dominance as an entry point for global brands.
Secondary cities are outpacing in growth. Alexandria leverages Hutchison Ports’ USD 700 million terminal expansion to attract trade-linked warehousing and distribution projects, pushing coastal logistics absorption to record highs. Giza, abutting both historical Cairo and the New Administrative Capital, offers cost-effective plots for light industrial estates servicing the enlarged metropolis. Enhanced transport linkages and land price arbitrage support its double-digit leasing momentum.
The Rest-of-Egypt corridor—spanning North Coast, Red Sea, and SCZone clusters—records an 11.20% CAGR through 2031 anchored by mega-projects. The USD 150 billion Ras El-Hekma city targets 8 million tourists yearly, fueling integrated hospitality, retail, and entertainment demand while doubling nearby land values. Talaat Moustafa Group’s USD 21 billion SouthMED development secured USD 1.25 billion bookings in 12 hours, demonstrating deep appetite for premium coastal assets. SCZone continues to draw industrial pipelines, with 274 projects worth USD 8.3 billion commissioned within 33 months, embedding a diversified economic base that widens the Egypt commercial real estate market’s geographic spread.
Regulatory Landscape
Egypt's commercial real estate development and operation are governed by planning, construction-code, standards, and tax regimes. The Ministry of Housing, Utilities and Urban Communities (MHUC) oversees urban development policy and new-city programs, while the Housing and Building National Research Center (HBRC) maintains Egypt's national building codes (covering structural loads, foundations, sanitary installations, and safety-related specifications) that project teams must follow during design, permitting, and construction. Building materials and products are aligned with national standards through the Egyptian Organization for Standardization and Quality (EOS), which supports product certification and conformity practices used across the supply chain.
On the fiscal side, the Real Estate Taxation Authority (RTA) administers constructed real estate tax, and changes in tax rules can affect underwriting, lease structures, and asset operating costs. Law No. 3 of 2026 (published April 2, 2026) amended provisions of the constructed real estate tax law (Law No. 196 of 2008), keeping tax compliance and documentation current for owners, occupiers, and asset managers. For state-linked land allocation and contract frameworks in cooperative developments, the General Authority for Construction and Housing Cooperatives (CHC) helps reserve state-owned land and approve related contracts, which can influence delivery timelines and transaction processes in master-planned communities with commercial components.
Value Chain Analysis
Egypt's commercial real estate value chain begins with land origination and master planning, which are shaped by public-sector programs and new-city development led by the Ministry of Housing, Utilities and Urban Communities. Developers then structure financing (bank loans, syndicated facilities, partner financing, and presales where applicable), secure approvals, and appoint contractors and specialist consultants for engineering design, code compliance, and project management. Mega-project ecosystems such as the New Administrative Capital and the Suez Canal Economic Zone concentrate demand, draw in logistics and industrial tenants, and increase downstream needs for fit-out, utilities connections, and transport integration.
Construction and delivery depend on building-code adherence (HBRC codes) and compliant materials standards (EOS), with contractors coordinating civil works, MEP, and specialized systems (including smart-building controls, energy optimization, and safety systems) increasingly specified by corporate occupiers. Go-to-market runs through brokers and leasing teams for offices, retail, and logistics space, followed by property management and facilities management, which have gained importance as owners adopt hard-currency lease structures, ESG reporting, and tenant-experience platforms to protect occupancy and rental collections. In high-activity mixed-use corridors, developers are also embedding logistics-road networks and customs-related facilitation within large districts to improve tenant onboarding and reduce time-to-operation for trade-linked occupiers.
Competitive Landscape
Local champions such as Talaat Moustafa Group, Palm Hills, and SODIC retain scale advantages in land banking and regulatory navigation, yet cross-border capital inflows are reshaping bargaining dynamics. UAE-based Modon’s mandate to steer the Ras El-Hekma masterplan illustrates the rising prevalence of joint ventures blending domestic execution with foreign financing. Portfolio diversification around government mega-projects yields lower vacancy risk, and early mover positioning near the New Administrative Capital or SCZone generates quasi-captive demand corridors.
Technology and ESG differentiation mark the new battleground. The Infinity Tower’s LEED Platinum pursuit and the Iconic Tower’s ECOPlanet cement showcase how green credentials translate into rent premiums and brand equity. Proptech platforms offering digital leasing, tenant-experience apps, and energy-optimization analytics gain traction as landlords chase operational efficiency. Firms lacking upgrade capital could become acquisition targets, sparking consolidation that tightens supply of Grade-A space within the Egypt commercial real estate market.
Regulatory enforcement under Law 175 (2022) empowers the Egyptian Competition Authority to scrutinize mergers, maintaining a moderately fragmented field. Niche disruptors focusing on specialized logistics hubs, cold storage, or flexible office suites broaden product diversity, while alternative lenders bridge financing gaps left by risk-averse banks. This eclectic mix sustains competitive tension yet fosters innovation beneficial to occupiers across the Egypt commercial real estate industry[3].
Egypt Commercial Real Estate Industry Leaders
-
Amer Group
-
Orascom Construction PLC
-
Palm Hills Developments
-
The Arab Contractors
-
Talaat Moustafa Group
- *Disclaimer: Major Players sorted in no particular order
Market Opportunities and Future Outlook
Whitespace is forming around investment zones, industrial-logistics ecosystems, and mixed-use business districts that combine permitting facilitation with tenant-ready infrastructure. Government actions in 2026 point to a larger pipeline of investable land and more formalized developer governance. A 115 million square meter land bank was announced for offering through 2030, with incentives such as tax breaks and lower upfront payments for large plots, and policy statements have referenced a target for 25% of new real estate projects to meet green certification requirements supported by incentive packages. These programs create room for developers and investors to execute at scale, document compliance, and deliver certified buildings that qualify for preferential terms.
Corporate-grade demand is being channeled into large, branded mixed-use nodes where anchors commit capital to offices, retail, and supporting logistics. In April 2026, GAFI approved a Special Investment Zone for Talaat Moustafa Group's The Spine in Madinaty, including a dedicated customs hub, which strengthens the commercial tenant proposition for internationally linked occupiers. In June 2026, Majid Al Futtaim and Midar signed a strategic partnership for a multi-billion-dollar mixed-use community in New Cairo's Mada City, and Majid Al Futtaim also advanced a business-park investment in West Cairo, reinforcing the opportunity for institutionally managed offices and retail formats outside the legacy CBD. At the same time, cost and fee changes are becoming a gating factor in feasibility, highlighted by developer commentary around NUCA fees per square meter. This shifts attention toward phased delivery, revenue-sharing structures, and higher-spec, higher-rent inventory where tenants pay for certainty, compliance, and operating performance.
Recent Industry Developments
- May 2026: Talaat Moustafa Group officially launched The Spine in Madinaty as a large-scale cognitive-city development with an integrated commercial and logistics concept. The project adds a new pipeline of office, retail, and mixed-use inventory aligned with smart-city positioning and institutional-grade tenant requirements.
- February 2026: Orascom Construction was awarded a major contract by Modon Holding for a mixed-use project within the Ras El Hekma mega-development. The award reinforces the North Coast as an active destination for large commercial and mixed-use construction packages and supports contractor backlogs tied to destination-city rollouts.
- December 2024: Hilton announced plans to triple its Egypt footprint by adding 25 hotels, taking its pipeline to more than 40 properties nationwide. The move strengthens hospitality-led demand for adjacent retail, F&B, and supporting logistics and services in key tourism corridors.
Research Methodology Framework and Report Scope
Market Definition and Coverage
For this study, the market covers the value of commercial real estate activity in Egypt across income generating and sale transactions for built commercial properties, tracked through offices, retail, logistics, and other commercial assets where pricing can be observed and validated.
Scope exclusions: It excludes pure residential housing transactions, undeveloped land banking without near term commercial use, and non real estate operating revenues that sit inside facility management or property services.
Segmentation Overview
- By Property Type
- Offices
- Retail
- Logistics
- Others (industrial real estate, hospitality real estate, etc.)
- By Business Model
- Sales
- Rental
- By End-user
- Individuals / Households
- Corporates & SMEs
- Others
- By Geography
- Cairo
- Alexandria
- Giza
- Rest of Egypt
Data Sources, Market Sizing, and Validation
Desk Research
Desk work starts with getting clean context on Egypt macro conditions and real estate related indicators, and then narrowing that into commercial property signals. We typically pull from public sources such as the Central Bank of Egypt for interest rate and credit context, CAPMAS for population and economic statistics, and ministry level releases on new city and infrastructure progress.
To translate activity into value, we also review non paywalled materials such as exchange disclosures, annual reports, and investor presentations of listed developers and REIT like vehicles where available, along with press coverage on major projects, leasing momentum, and pipeline announcements. Import and construction proxy data are also used where helpful, and patent databases may be checked to sense technology adoption in smart buildings. In addition, we use paid subscriptions for company financials and intelligence, news and financials, and global contracts and tenders to confirm project starts and timelines. These desk sources are illustrative only, and other references are used to collect data, validate ranges, and clarify assumptions.
Primary Interviews and Surveys
Primary work is used to pressure test the desk assumptions and fill gaps where published data is thin, especially on leasing terms, vacancy shifts, and how pricing is quoted after currency movements. We speak with developers, large landlords, brokers, lenders, and corporate occupiers, and we also check views with advisors active in Cairo, Alexandria, and fast growing project corridors so the model reflects real transactions rather than only announced supply.
Distribution of primary research fieldwork respondents
| Company type | Respondent position |
|---|---|
| Top tier: 34% | CXOs: 14% |
| Mid tier: 51% | Functional/Unit leaders: 29% |
| Smaller Players: 15% | Managers: 57% |
Market-Sizing & Forecasting
Sizing starts from a top-down build where commercial property value is reconstructed from Egypt level demand and supply indicators, then aligned to observed pricing for the main asset classes. The practical steps are to map active stock and new additions, apply occupancy and absorption expectations, and then translate these into annual value using rent or sale price ranges that match what market participants report.
Key inputs used in the model include the new supply pipeline in major hubs (such as new city districts), average rent levels by grade, vacancy and renewal trends, financing conditions (rates and lending appetite), and the mix between sales and rental activity. Where direct numbers are missing, gaps are handled through bounded ranges agreed during interviews, and then tightened using consistency checks across similar submarkets.
Forecasting is run using scenario analysis supported by trend smoothing, because CRE outcomes in Egypt can shift quickly with interest rates, currency moves, and large project delivery timing. Assumptions for rent growth, occupancy, and new completions are revised until they are consistent with what occupiers, brokers, and developers see on the ground. Results are corroborated with selective bottom-up approximations, such as sampled project level pricing applied to estimated leasable area, followed by roll ups for a small set of representative corridors to confirm the national total.
Data Validation & Update Cycle
Outputs are validated through triangulation across independent signals, including project delivery tracking, rent direction checks, and whether implied yields look realistic versus prevailing financing costs. When a segment shows an unusual jump, the driver is traced back to the exact input, and the assumption is rechecked through follow up calls or another desk pass.
Before sign-off, the model goes through multi step analyst review where the math is rechecked, units are aligned, and currency conversions are applied consistently to the stated year. The report is refreshed annually, and interim updates are made when material events occur, such as policy changes, large devaluations, or a major supply wave. Right before delivery, a final review pass is completed so clients receive the most current view available at that time.
Mordor Intelligence's Egypt Commercial Real Estate Market Estimate Compared With Other Published Estimates
Published market size figures for Egypt commercial real estate often look far apart, even when the topic name sounds the same. The spread usually comes from what is counted as commercial property, the year used as the base, and how sales versus rental value is treated in the calculation.
The table shows a much lower 2025 value than some 2024 based publications, and in Mordor Intelligence's model this is mainly driven by counting offices, retail, logistics, and other commercial assets under a defined sales and rental scope, and then avoiding broader add-ons like multifamily style housing and hospitality that some sources fold into commercial property totals.
Benchmark comparison
| Source | Market Size | Gaps in Research Methodology |
|---|---|---|
| Mordor Intelligence | USD 4.03 B (2025) | |
| Global Consultancy A | USD 9.41 B (2024) | Uses a 2024 base and a wider asset mix that explicitly includes multifamily and hospitality, which can lift totals versus a tighter Egypt CRE scope and a different market year. |
| Industry Publisher B | USD 12.20 B (2025) | Applies a broader definition and higher growth and pricing assumptions, and it is less clear how vacancy, renewal behavior, and sales versus rental value are normalized across asset types. |
Taken together, the comparison points to scope and base-year handling as the largest drivers of difference, followed by how pricing and occupancy assumptions are refreshed after macro shifts. By keeping inputs tied to observable stock, occupancy movement, and price ranges that can be rechecked, the methodology produces a balanced number that can be replicated when new data arrives.
Key Questions Answered in the Report
What is the current value of the Egypt commercial real estate market?
The Egypt commercial real estate market size is USD 4.31 billion in 2026 and is forecast to reach USD 6.04 billion by 2031.
Which property type leads demand?
Offices account for 43.02% of 2025 market share thanks to ministry relocations and multinational expansions.
Which segment is growing fastest?
Retail assets are projected to post a 9.60% CAGR through 2031 on the back of tourism recovery and lifestyle mall rollouts.
How is inflation affecting the sector?
Double-digit inflation and a 28.25% policy rate raise financing and operating costs, yet hard-currency leases help cushion prime assets.
What role do mega-projects play?
Government initiatives such as the New Administrative Capital and SCZone create new commercial hubs, drawing private investment and diversifying geographic demand.