Market Overview
| Study Period | 2020 - 2031 |
|---|---|
| Base Year For Estimation | 2025 |
| Forecast Data Period | 2026 - 2031 |
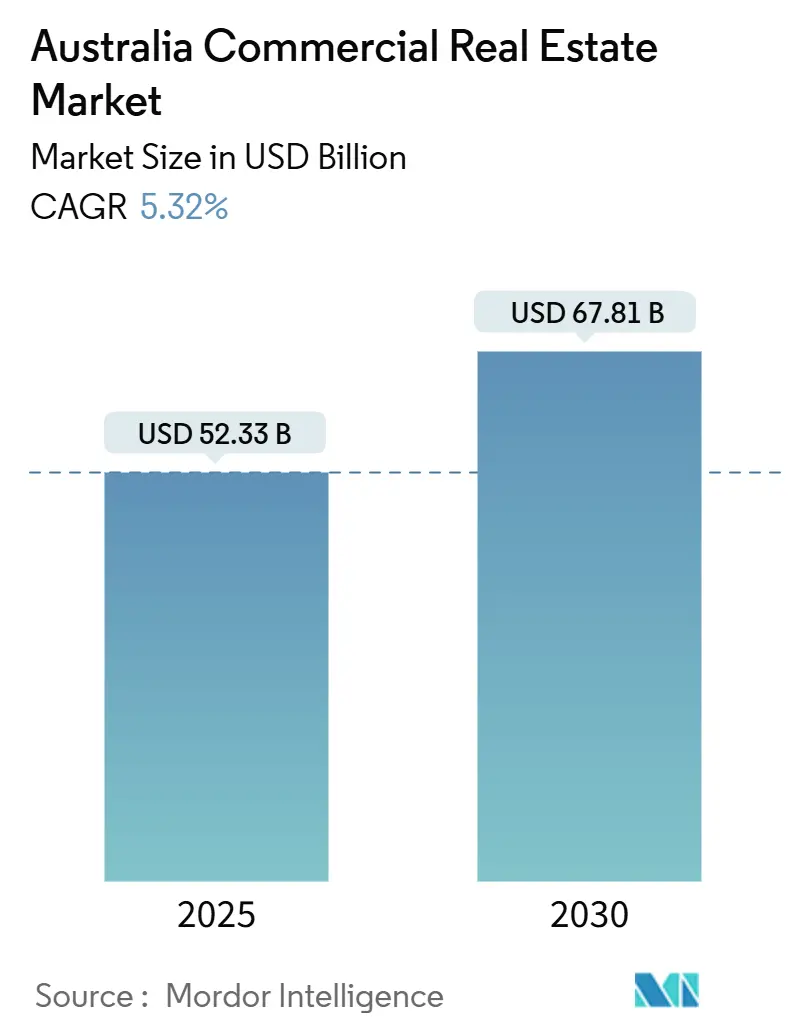
| Market Size (2026) | USD 54.55 Billion |
| Market Size (2031) | USD 70.69 Billion |
| Growth Rate (2026 - 2031) | 5.32% CAGR |
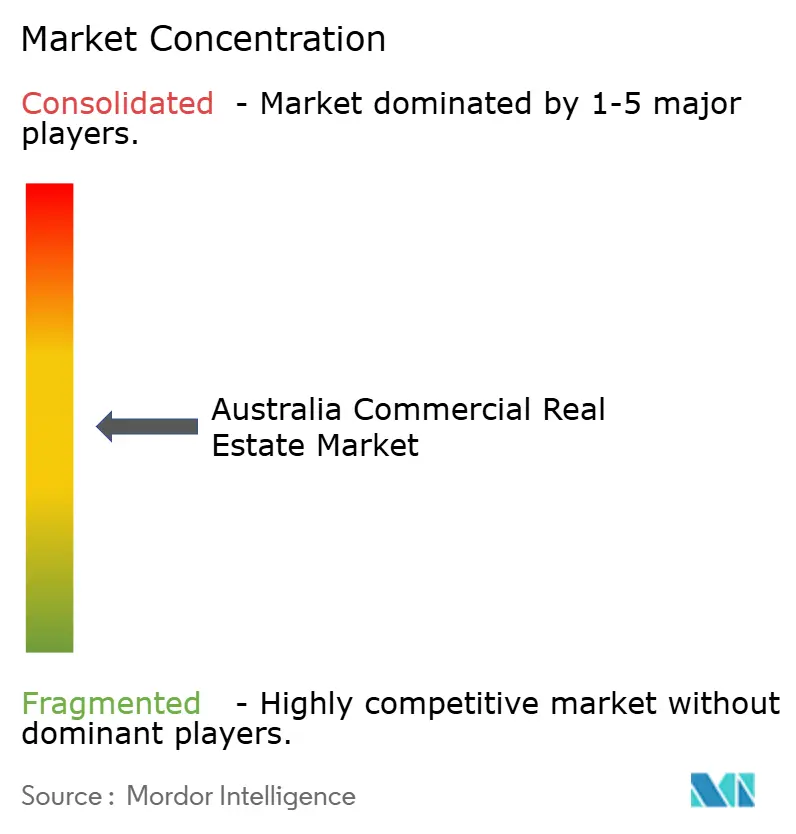
| Market Concentration | Medium |
Major Players *Disclaimer: Major Players sorted in no particular order Image © Mordor Intelligence. Reuse requires attribution under CC BY 4.0. | |
Australia Commercial Real Estate Market Analysis by Mordor Intelligence
The Australia commercial real estate market size is estimated at USD 54.55 billion in 2026 and is projected to reach USD 70.69 billion by 2031, reflecting a 5.32% CAGR over the forecast period. Investor demand is shifting toward inflation-hedged assets such as logistics warehouses, data-center campuses, and ESG-certified towers as monetary conditions stay restrictive yet predictable. Cap-rate compression in secondary cities is widening the yield gap versus legacy CBD offices, while sovereign-grade credit fundamentals continue to attract cross-border allocations from Canada, Singapore, and the Middle East. Infrastructure megaprojects around Western Sydney Airport and the 2032 Brisbane Olympics are lifting commercial land prices, and data-localization laws are catalyzing regional edge-facility roll-outs.[1]https://www.rba.gov.au/
Key Report Takeaways
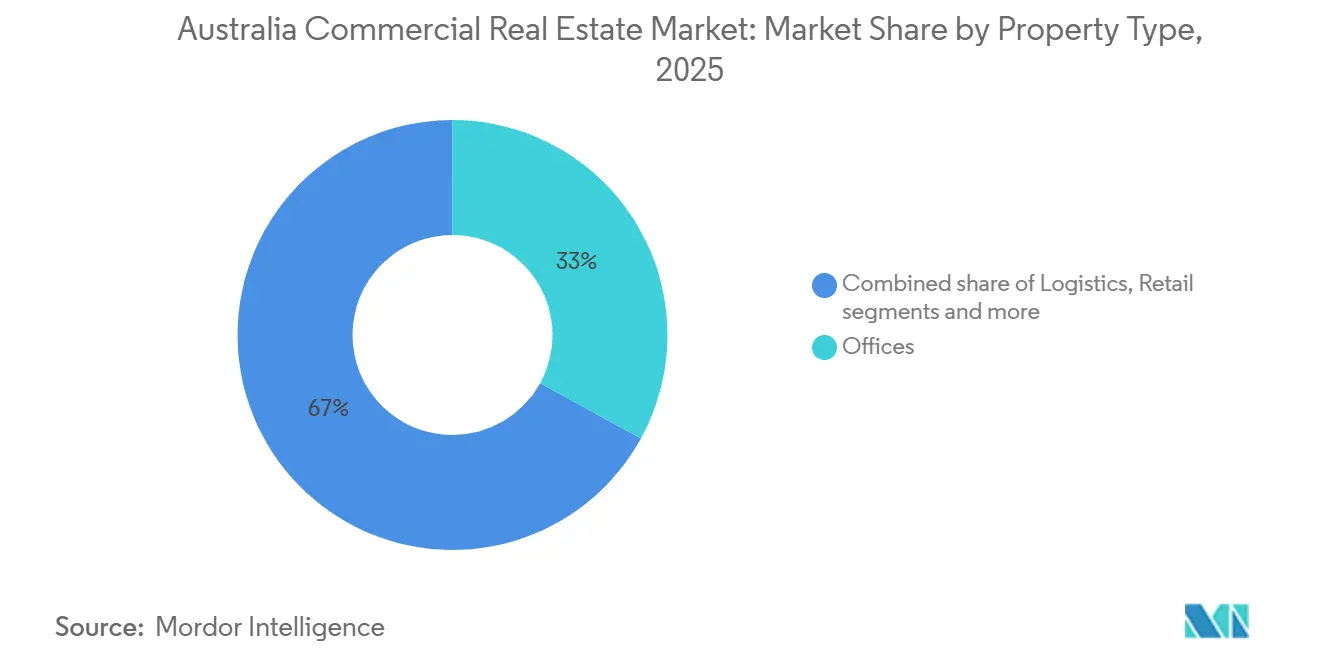
- By property type, offices held 33% of the Australia commercial real estate market share in 2025, while logistics assets are forecast to expand at a 5.91% CAGR to 2031.
- By business model, sales transactions captured 71% of the Australia commercial real estate market size in 2025, but rental income streams are expected to grow at a 6.01% CAGR through 2031.
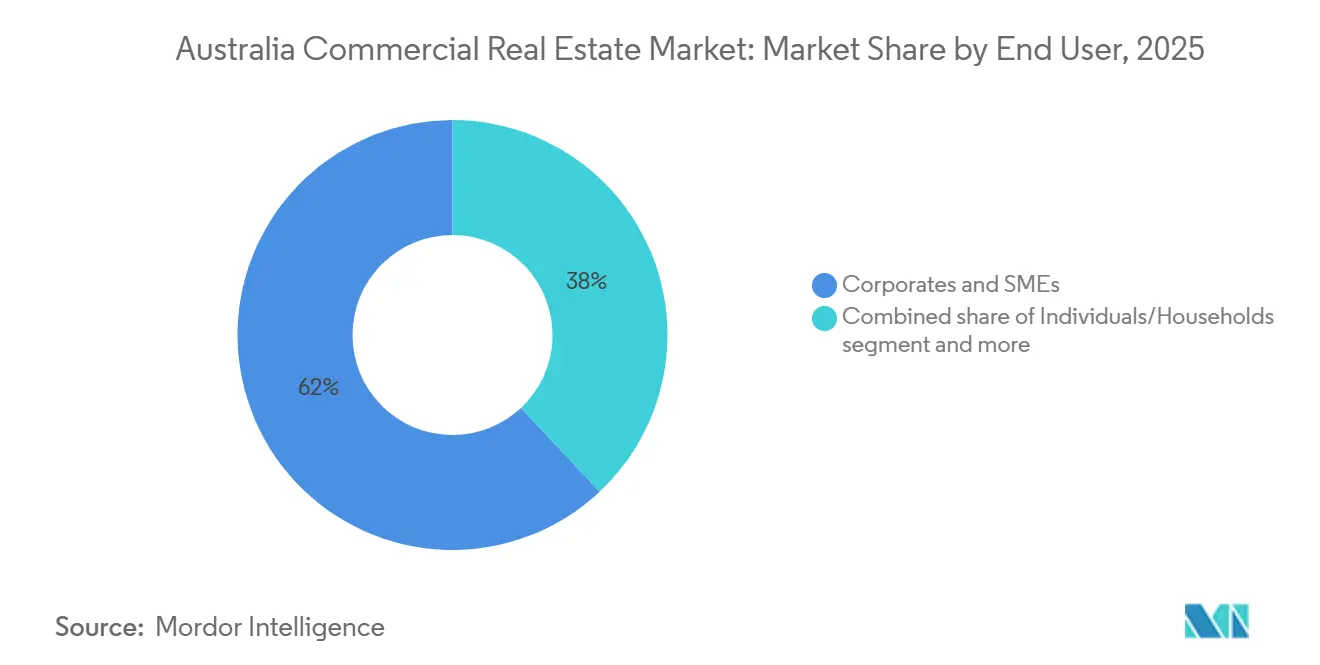
- By end-user, corporates and SMEs accounted for 62% of the Australia commercial real estate market in 2025; individual and household demand is advancing at a 6.01% CAGR on the back of build-to-rent and fractional-ownership formats.
- By geography, New South Wales led with 39% revenue share in 2025, whereas Queensland is set to log the quickest pace, expanding at a 5.96% CAGR to 2031.
Note: Market size and forecast figures in this report are generated using Mordor Intelligence’s proprietary estimation framework, updated with the latest available data and insights as of January 2026.
Australia Commercial Real Estate Market Trends and Insights
Drivers Impact Analysis
| Drivers | (~) % Impact on CAGR Forecast | Geographic Relevance | Impact Timeline |
|---|---|---|---|
| Accelerated Demand for Prime Industrial & Logistics Space Driven by E-Commerce | 1.2% | National, concentrated in Sydney, Melbourne, and Brisbane logistics corridors | Short term (≤ 2 years) |
| Government-backed Infrastructure Pipeline Lifting Commercial Land Values | 1.0% | Queensland, Western Australia, New South Wales (Western Sydney) | Long term (≥ 4 years) |
| Data-Localisation Mandates Fueling Edge Data-Centre Development | 0.9% | National, with edge deployments in regional centers | Medium term (2-4 years) |
| Surge in Institutional Capital Allocation to Core Office Assets | 0.8% | New South Wales, Victoria | Medium term (2-4 years) |
| Re-rating of ESG-Compliant Green Buildings Unlocking Premium Rents | 0.7% | National, early gains in Sydney CBD, Melbourne Docklands | Medium term (2-4 years) |
| Rebound in International Tourism Revitalising CBD Hotel RevPAR | 0.5% | New South Wales, Queensland, Victoria | Short term (≤ 2 years) |
| Source: Mordor Intelligence | |||
Accelerated Demand for Prime Industrial & Logistics Space Driven by E-Commerce
Cold-chain capacity expanded by 1.8 million m² in 2025 to keep pace with online grocery penetration that climbed to 14% of sales for major retailers. Last-mile hubs within 30 km of CBDs are transacting 50–75 basis points tighter than regional sheds, confirming investor preference for urban proximity. ESR and Logos committed USD 1.3 billion to automated fulfillment centers in Sydney and Melbourne featuring robotics and EV charging, aligning with net-zero pledges. Limited serviced land and sustained consumer expectations for same-day delivery support above-trend rental growth. Altogether, logistics remains the fastest-growing slice of the Australia commercial real estate market.[2]https://www.colesgroup.com.au/home/
Government-backed Infrastructure Pipeline Lifting Commercial Land Values
USD 4.7 billion in Olympic projects is transforming Brisbane’s Gabba and South Bank precincts, spurring rezonings that allow mixed-use towers up to 60 stories. In Western Sydney, land close to the new airport rose 47% between 2023 and 2025 as developers bank parcels for logistics estates. The USD 2.4 billion WestInvest fund extends similar incentives to Parramatta and Penrith, compressing approval timelines. Collectively, these projects re-route development capital from saturated CBD corridors toward growth suburbs. They also push the Australia commercial real estate market into new nodes where first-mover advantages exist.[3]https://www.nsw.gov.au/
Data-Localization Mandates Fueling Edge Data-Center Development
The 2024 Privacy Amendment requires certain datasets to stay onshore, stimulating edge deployments in Canberra, Adelaide, and Hobart, where land is 40–60% cheaper than in Sydney. AirTrunk announced a USD 1.6 billion, 120 MW expansion in January 2025, complete with dedicated substations co-funded by Ausgrid. Power-supply bottlenecks are driving onsite solar-plus-battery designs that win planning consent faster. NextDC reported 34% of contracts now bundle renewable energy, revealing client pressure for carbon-neutral hosting. As a result, data-infrastructure assets are a rising share of the Australia commercial real estate market.
Surge in Institutional Capital Allocation to Core Office Assets
Australian superannuation funds managed USD 2.5 trillion in assets at end-2025, and property still accounts for under 10% of portfolios, indicating headroom for further allocations. Cross-border investors from Singapore and Canada injected USD 4.1 billion into Australian towers in 2025, attracted by a AAA sovereign rating and tax-efficient trust structures. Trophy assets with NABERS 5-star energy ratings continue to command premium pricing as buyers prioritize efficiency credentials. This structural bid underpins stable demand even while hybrid work tempers net absorption. The resulting competition for prime space provides a floor to valuations across the Australia commercial real estate market.
Restraints Impact Analysis
| Restraints | (~) % Impact on CAGR Forecast | Geographic Relevance | Impact Timeline |
|---|---|---|---|
| Persistent Work-from-Home Adoption Softening CBD Office Net Absorption | -1.1% | New South Wales, Victoria (CBD cores) | Medium term (2-4 years) |
| Elevated Construction Costs & Labour Shortages Delaying Project Delivery | -0.9% | National, acute in Sydney, Melbourne, Brisbane | Short term (≤ 2 years) |
| Monetary Tightening and Rising Cap Rates Compressing Transactions | -0.7% | National | Medium term (2-4 years) |
| Heightened Climate-Risk Exposure Raising Insurance Premiums for Coastal Assets | -0.5% | Queensland, New South Wales coastal precincts | Long term (≥ 4 years) |
| Source: Mordor Intelligence | |||
Persistent Work-from-Home Adoption Softening CBD Office Net Absorption
Thirty-eight percent of Australian employees worked from home at least once weekly in August 2025, only slightly below 2023 levels. Large banks reduced footprints by 14-18% over three years, pushing sublease availability in Melbourne Docklands to a three-year high. Incentives now equal 25–30% of face rent in secondary towers. Landlords are adding wellness centers and end-of-trip facilities to retain tenants, but payback stretches in a tepid demand setting. This drag could temper the overall CAGR of the Australia commercial real estate market.[4]https://www.abs.gov.au/
Elevated Construction Costs & Labor Shortages Delaying Project Delivery
Materials inflation hit 11.3% year-over-year in September 2025, while the industry lacked 90,000 skilled workers. Insolvencies at subcontractors forced re-tendering mid-build, stretching timelines by up to nine months. Mirvac trimmed development-margin guidance by 150 bps as overruns eroded returns. Modular construction is shaving 20–25% off program lengths, but adoption is uneven. Delays restrict supply, moderating the pace of growth in the Australia commercial real estate market.
Segment Analysis
By Property Type: Logistics Assets Accelerate While Offices Hold Scale
Logistics facilities represented 18% of the Australia commercial real estate market in 2025, yet they are forecast to post a 5.91% CAGR through 2031, the highest among property types. Offices retained the largest 33% share thanks to Sydney and Melbourne CBD inventories, but persistent hybrid work keeps vacancy elevated. Investors gravitate toward modern sheds with automation-ready clear heights and cold-chain fitouts. Goodman Group alone controls a USD 5.3 billion pre-leased pipeline across Western Sydney and Melbourne’s west, showcasing long-tenor covenants with Amazon and Coles. Rental spreads between prime and secondary warehouses widened to 22% in 2025, rewarding landlords who retrofit legacy stock.
Rising e-commerce and near-shoring augment demand for regional distribution hubs connected to renewable-energy corridors, as seen in Geelong and Newcastle industrial estates. Retail centers turned mixed-use micro-fulfillment hubs, demonstrated by Vicinity’s 8,000 m² Chadstone conversion. Hospitality cap rates compressed to 5.25–5.75% on stronger tourism flows, overtaking offices at 6.0–6.5%. Meanwhile, medical-office buildings adjacent to private hospitals drew steady tenant pre-commitments, enhancing diversification within the Australia commercial real estate market.
Get Detailed Market Forecasts at the Most Granular Levels
Download PDF
By Business Model: Rental Income Streams Edge Toward Supremacy
Sales transactions owned 71% of the Australia commercial real estate market share in 2025, reflecting a legacy trading culture and favorable capital-gains tax treatment. However, rental-based structures are scaling at a 6.01% CAGR toward 2031 as institutions target inflation-linked cash flows. Dexus guided a 3.2% year-on-year lift in 2025 distributions, citing CPI-indexed leases across 64% of its portfolio. Unlisted funds are lengthening WALEs to lock in predictable income, while build-to-rent ventures attract pension capital due to steady occupancy.
Australia commercial real estate market size for rental-heavy assets could climb meaningfully if superannuation schemes continue to prefer bond-like yields over speculative flips. State land-tax concessions for build-to-rent sweeten net returns, as evidenced by Greystar’s Sydney projects. Conversely, developers are scaling back strata-office sales after lenders imposed tighter loan-to-value ratios on non-core assets. That pivot channels fresh equity toward yield-oriented formats, gradually rebalancing the Australia commercial real estate market.
By End-User: Corporate Demand Dominates but Household Participation Rises
Corporates and SMEs occupied 62% of space in 2025, underscoring their anchor-tenant role within the Australia commercial real estate market. Blue-chip occupiers consolidated into premium towers, illustrated by GPT Group’s finding that tenant count fell 12% even as average lease size rose 9%. Individuals and households, while smaller today, are on course to expand 6.01% annually through tokenized ownership and self-storage uptake. Retail investor participation grew as platforms like BrickX fractionalize warehouses, offering tickets below USD 3,000 per slice.
Flexible workspace providers added 32,000 m² in 2025, meeting SME appetite for plug-and-play offices. Government departments in Canberra and state capitals supply a defensive revenue stream in the “Others” category, with average lease terms above 10 years. Overall, the end-user mix is diversifying, cushioning the Australia commercial real estate market from single-sector shocks.
Get Detailed Market Forecasts at the Most Granular Levels
Download PDF
Geography Analysis
New South Wales retained the largest share of the Australia commercial real estate market in 2025 at 39%, underpinned by Sydney’s deep finance, legal, and tech ecosystems. CBD office towers near Barangaroo and Martin Place remain coveted by global investors, though secondary stock in Parramatta and Penrith has drawn fresh attention after the USD 2.4 billion WestInvest fund accelerated planning pathways. Western Sydney Airport’s 2026 opening is already redirecting capital to logistics estates within the 10,000-hectare Aerotropolis precinct, pushing land values up 47% since 2023 and broadening the state’s commercial footprint. Alongside offices and logistics, mixed-use conversions of suburban malls into healthcare hubs—exemplified by the USD 204 million Westfield Parramatta redevelopment—signal a shift toward essential-service tenancy mixes.
Queensland is the fastest-growing state, forecast at a 5.96% CAGR to 2031, propelled by Olympic-related construction and sustained interstate migration. The Brisbane Arena, Cross River Rail, and South Bank makeovers are elevating surrounding land values, compelling developers such as Mirvac to launch USD 560 million mixed-use schemes with pre-committed government tenants. On the Gold Coast and Sunshine Coast, housing shortages translate into strong demand for build-to-rent and self-storage assets. Regional logistics demand is rising as food exporters tap Port of Brisbane, validating Frasers Property’s USD 145 million warehouse commitment.
Victoria remains a pillar of the Australia commercial real estate market thanks to Melbourne’s diversified industrial base and university network. Renewable-energy zones in Gippsland and the Western District encourage data-center and hydrogen-production campuses that require adjacent commercial support services. Meanwhile, Canberra sustains investor appetite for defensive income, with federal departments agreeing to 12-year average leases across new builds. Perth industrial sites near Fremantle Port continue to benefit from lithium-driven export growth, while Adelaide’s northern suburbs are thriving on defense-industry spillovers. In Tasmania and the Northern Territory, tourism and hydrogen exports respectively are fueling localized booms that draw patient institutional capital.
Competitive Landscape
Dexus, Charter Hall, and Goodman leverage vertically integrated models that capture development, funds management, and asset management fees, creating scale advantages. Stockland and Mirvac cross-subsidize commercial ventures with residential cash flows, softening cyclical earnings swings. Scentre and Vicinity dominate super-regional retail yet are repurposing anchor boxes into healthcare, hotel, and logistics pods to offset e-commerce leakage. Offshore capital—led by Blackstone, Brookfield, and GIC—has poured USD 20 billion into core-plus assets since 2020, pushing domestic players to move up the risk curve.
Strategic differentiation increasingly centers on ESG performance, data-center exposure, and cold-chain logistics. Charter Hall disclosed that 72% of its USD 43 billion portfolio carries Green Star or NABERS certificates, enabling it to win mandates from pension funds seeking decarbonized allocations. Goodman’s pipeline surpasses 420,000 m² of pre-leased industrial space, locking in decade-long covenants that de-risk development. Dexus retrofitted 1.8 million m² of offices with IoT sensors, cutting operating costs by 8-12% and boosting tenant satisfaction scores. ESR and Logos target automated warehouses and refrigerated facilities supported by green-loan structures, reflecting a credit landscape that rewards sustainable design.
Emerging challengers backed by superannuation funds—such as Aware Super and Cbus Property—are bypassing intermediaries to acquire assets directly, compressing manager fees and altering deal-flow dynamics. PropTech disruptors introduce tokenized ownership models, widening retail access while adding regulatory scrutiny. Meanwhile, build-to-suit data-center joint ventures between Goodman and AirTrunk, and logistics estates funded by Charter Hall-GIC alliances, underscore a pivot away from speculative builds toward tailored solutions. These strategic plays collectively raise the sophistication bar across the Australia commercial real estate market.
Australia Commercial Real Estate Industry Leaders
Dexus
Goodman Group
GPT Group
Charter Hall Group
Mirvac Group
- *Disclaimer: Major Players sorted in no particular order
Need More Details on Market Players and Competitors?
Download PDF
Recent Industry Developments
- January 2026: Charter Hall and GIC formed a USD 1.05 billion venture to develop a 280,000 m² logistics park in Melbourne’s west, fully pre-leased to Woolworths and Amazon.
- December 2025: Goodman acquired a 42-hectare site in Western Sydney’s Aerotropolis for USD 343 million, earmarked for 380,000 m² of logistics space by 2028.
- November 2025: Dexus and Oxford Properties committed USD 1.38 billion to reposition three CBD towers toward 6-star NABERS ratings.
- October 2025: Mirvac launched a USD 560 million mixed-use project in Brisbane’s South Bank, with 60% of office space pre-leased to state agencies.
Research Methodology Framework and Report Scope
Market Definitions and Key Coverage
Our study defines the Australian commercial real estate (CRE) market as the annual value generated by income-producing assets, office towers, retail centers, logistics and other industrial facilities, hospitality buildings, and mixed-use complexes traded, leased, or developed for business purposes. Revenues from both asset sales and recurring rental contracts are included, while owner-occupied corporate premises are treated as end-user demand rather than supply.
Scope Exclusions: Stand-alone housing, agricultural estates, and raw land banking fall outside this assessment.
Segmentation Overview
- By Property Type
- Offices
- Retail
- Logistics
- Others (Industrial estate, Hospitality, etc.)
- By End-user
- Individuals / Households
- Corporates & SMEs
- Others
- By Region
- New South Wales
- Victoria
- Queensland
- Western Australia
- South Australia
- Australian Capital Territory
- Tasmania
- Northern Territory
Detailed Research Methodology and Data Validation
Primary Research
Mordor analysts interviewed developers, A-REIT managers, lenders, corporate occupiers, valuers, and regional planners across Sydney, Melbourne, Brisbane, Perth, and Adelaide. These discussions validated vacancy trends, cap-rate shifts, e-commerce warehouse demand, and construction pipelines, allowing us to refine desk-research assumptions.
Desk Research
We mapped the market using open-access sources such as the Australian Bureau of Statistics, APRA banking exposure data, Treasury foreign-investment registers, Property Council vacancy surveys, and MSCI-PCA performance indices. Budget papers, environmental approvals, and ASX-filed reports offered deal-level insight, while D&B Hoovers and Dow Jones Factiva helped corroborate company financials and news. The sources named illustrate depth; many additional publications were reviewed for cross-checks and clarification.
Market-Sizing & Forecasting
Top-down and bottom-up logic work in tandem. The process starts with ABS non-residential output and investment series and aligns them with asset-class weights derived from transaction databases. Bottom-up roll-ups of listed landlord rental income, median asset prices multiplied by sampled volumes, and channel checks then fine-tune totals. Key variables fed into the model include GDP growth, net absorption, cap-rate movement, construction-cost inflation, logistics vacancy, and foreign-investment approvals. Forecasts to 2030 rely on multivariate regression reinforced by scenario analysis and guided by expert consensus. Where granular bottom-up data are sparse, historical price-to-rent elasticities bridge the gaps.
Data Validation & Update Cycle
Outputs pass automated anomaly scans, peer review, and final sign-off by the lead author. Models refresh every year, with interim updates triggered by policy shifts, material M&A, or abrupt yield changes, so clients always receive the most current view.
Why Mordor's Australia Commercial Real Estate Baseline Stands Apart for Decision Makers
Published estimates often diverge because firms select different asset baskets, currency treatments, and refresh cadences. By anchoring scope to income-producing stock, normalizing values to constant 2024 dollars, and updating annually, Mordor Intelligence reduces noise and aids comparability.
Differences arise when some publishers count only settled sales, others omit secondary cities, and a few value gross asset books instead of yearly economic activity. These choices explain the wide spread around today's baseline.
Benchmark comparison
| Market Size | Anonymized source | Primary gap driver |
|---|---|---|
| USD 52.33 B (2025) | Mordor Intelligence | |
| USD 11.96 B (2024) | Regional Consultancy A | Transactions only, excludes rental stock and owner-occupied space |
| USD 34.07 B (2025) | Global Consultancy B | Uses constant FX, omits logistics parks outside capital cities, three-year update cycle |
| USD 423 B (2024) | Industry Association C | Values total professionally managed assets rather than annual market output |
The comparison shows that Mordor's disciplined scope selection, yearly refresh, and dual-angle validation provide a balanced, transparent baseline that investors and policymakers can trust.
Need A Different Region or Segment?
Customize Now
Key Questions Answered in the Report
What is the projected value of the Australia commercial real estate market by 2031?
The sector is forecast to hit USD 70.69 billion by 2031, growing at a 5.32% CAGR.
Which property type is expanding fastest within Australian commercial real estate?
Logistics warehouses lead with a 5.91% CAGR to 2031, buoyed by e-commerce and supply-chain reconfiguration.
Why are rental-income models gaining popularity among investors?
Higher interest rates elevate the appeal of inflation-indexed, long-WALE leases that stabilize distributions for funds and REITs.
Which state is expected to grow most rapidly through 2031?
Queensland is set to record the quickest expansion at a 5.96% CAGR, fueled by Olympic infrastructure and population inflows.
How does ESG compliance influence office rents?
Green Star 5-star offices commanded average premiums of 9.2% over non-certified buildings in 2025, rewarding landlords that invest in efficiency.


