
Commercial Lighting Market Size and Share
Market Overview
| Study Period | 2020 - 2031 |
|---|---|
| Market Size (2026) | USD 22.57 Billion |
| Market Size (2031) | USD 51.04 Billion |
| Growth Rate (2026 - 2031) | 17.73% CAGR |
| Fastest Growing Market | Africa |
| Largest Market | Asia-Pacific |
| Market Concentration | Medium |
Major Players *Disclaimer: Major Players sorted in no particular order Image © Mordor Intelligence. Reuse requires attribution under CC BY 4.0. | |
Commercial Lighting Market Analysis by Mordor Intelligence
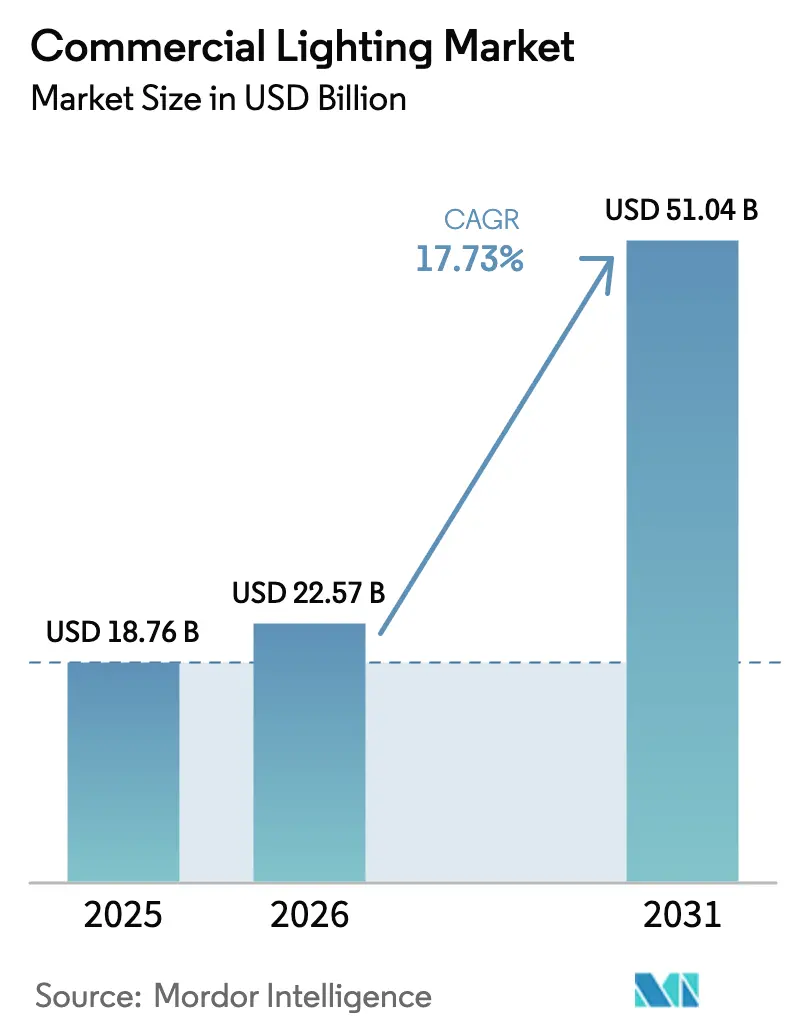
The commercial lighting market size is projected to be USD 18.76 billion in 2025, USD 22.57 billion in 2026, and reach USD 51.04 billion by 2031, growing at a CAGR of 17.73% from 2026 to 2031. Rapid policy-driven phase-outs of fluorescent and HID lamps, continuous LED price declines, and the bundling of luminaires with smart-building software are shortening payback periods for both retrofits and new construction. Acute interest from institutional investors in loan structures that link interest rates to verified energy savings is channeling capital toward large-scale LED upgrades, while falling driver and chipset costs are lowering bill-of-materials thresholds that once discouraged connected solutions. Competitive activity centers on vertically integrated Asian producers that compress margins for Western brands, yet those incumbents defend share by embedding analytics, wellness features, and Li-Fi data layers into premium fixtures. The commercial lighting market is also beginning to benefit from pandemic-era government stimulus that earmarked funds for resilient infrastructure, allowing public projects to underwrite the adoption of networked controls and human-centric tuning.
Key Report Takeaways
- By lighting type, luminaires led with 56.78% revenue share in 2025 and are projected to grow at a 17.79% CAGR through 2031.
- By lighting source, LED products commanded 66.59% of the commercial lighting market size in 2025 and are forecast to expand at an 18.31% CAGR.
- By end-user, commercial offices held 48.07% of the commercial lighting market share in 2025, while healthcare is the fastest-growing segment at a 19.02% CAGR to 2031.
- By installation type, retrofit and renovation projects accounted for 62.21% of demand in 2025 and will maintain an 18.07% CAGR through 2031.
- By connectivity, smart systems represented 41.53% of shipments in 2025 and are advancing at a 19.13% CAGR to 2031.
- By region, Asia Pacific captured 84.12% of 2025 revenue, whereas Africa is the fastest-growing region at a 20.06% CAGR through 2031.
Note: Market size and forecast figures in this report are generated using Mordor Intelligence’s proprietary estimation framework, updated with the latest available data and insights as of January 2026.
Global Commercial Lighting Market Trends and Insights
Drivers Impact Analysis*
| Driver | (~) % Impact on CAGR Forecast | Geographic Relevance | Impact Timeline |
|---|---|---|---|
| Energy-Efficiency Regulations and LED Adoption | +4.2% | Global, with stringent enforcement in EU and California | Medium term (2–4 years) |
| Declining LED Prices and Efficacy Improvements | +3.8% | Global, accelerated in Asia Pacific manufacturing hubs | Short term (≤ 2 years) |
| Smart Building and IoT Integration Demand | +3.5% | North America and EU, early adoption in Gulf Cooperation Council | Medium term (2–4 years) |
| Human-Centric Lighting for Occupant Wellness | +2.9% | North America, Northern Europe, Japan | Long term (≥ 4 years) |
| Li-Fi-Enabled Luminaires for Data Connectivity | +1.6% | EU pilot markets, select Asia Pacific smart campuses | Long term (≥ 4 years) |
| ESG-Linked Financing Accelerating Retrofits | +1.8% | Global, concentrated in North America and Western Europe | Medium term (2–4 years) |
| Source: Mordor Intelligence | |||
Energy-Efficiency Regulations and LED Adoption
Tightening global codes are removing legacy lamps from specification schedules, compressing simple paybacks to fewer than three years in many jurisdictions. The European Ecodesign update that became effective in 2024 bans high-wattage T8 fluorescents, forcing building owners to retrofit or face fines. California’s 2025 revision of Title 24 lifts minimum indoor efficacy to 100 lumens per watt and mandates networked controls in large spaces, effectively excluding non-connected options from new projects.[1]California Energy Commission, “2025 Building Energy Efficiency Standards,” energy.ca.gov China’s GB 50034-2024 standard caps lighting power density and requires perimeter dimming, aligning national construction with its 2060 carbon-neutral pledge. India extended its star-rating scheme to commercial luminaires in 2024, layering performance incentives on top of import tariffs that already favor domestic LED assembly. Together, these measures accelerate removal of an installed fluorescent base that still represented roughly one-third of global stock in 2025.
Declining LED Prices and Efficacy Improvements
Mid-power LED packages recorded double-digit price drops in both 2024 and 2025 as Chinese fabs scaled 8-inch epitaxial wafers and improved yield management. Signify reported a 15% fall in the bill-of-materials for a typical troffer, allowing retail prices to stay flat even as margins rose.[2]Signify N.V., “Annual Report 2024,” signify.com Nichia’s 220 lumens-per-watt packages and Cree’s laboratory achievement of 240 lumens per watt translate to system efficiencies above 150 lumens per watt in volume products. Seoul Semiconductor’s Acrich driver-less platform shaved 18% off fixture cost while improving reliability by removing the failure-prone power supply. The commercial lighting market therefore enjoys a flywheel effect: lower upfront cost expands addressable demand, which in turn enables scale efficiencies that push prices even lower.
Smart Building and IoT Integration Demand
Facility managers increasingly treat luminaires as nodes in a broader sensor network that blends lighting with HVAC and access control. Global DALI-2 certifications surpassed 5,000 in 2024, signaling a clear move toward interoperable digital control.[3]DALI Alliance, “Certification Statistics 2024,” dali-alliance.org Matter 1.2 extends these capabilities by enabling smartphone-based commissioning, reducing installer labor and training expenses. Acuity Brands’ Atrius platform delivered USD 180 million in recurring software revenue during fiscal 2025, underscoring how data subscriptions augment hardware sales. WELL v2 credits for circadian lighting and glare control now influence tenant leasing decisions, pushing developers to specify tunable-white fixtures. Eaton’s Interact Pro cloud suite flags driver degradation early, reducing service calls by one-quarter and strengthening total-cost-of-ownership economics.
Human-Centric Lighting for Occupant Wellness
Peer-reviewed studies confirm that tunable lighting reduces sleep-onset latency and boosts alertness in office environments. Hospitals that apply circadian-aligned schedules report fewer patient falls and shorter postoperative stays, driving rapid adoption across Germany and Austria. Panasonic’s LinkRay solution adds visible light communication, enabling location-based reminders in senior-care facilities while simultaneously modulating melanopic lux levels. U.S. federal design guidelines now specify minimum melanopic thresholds, hard-coding wellness metrics into procurement. Retailers report higher dwell time and increased basket size in stores that deploy dynamic scenes, converting wellness from a cost center into a revenue-generation tool.
Restraints Impact Analysis*
| Restraint | (~) % Impact on CAGR Forecast | Geographic Relevance | Impact Timeline |
|---|---|---|---|
| Component Supply-Chain Volatility | -2.1% | Global, acute in North America and Europe | Short term (≤ 2 years) |
| Construction-Cycle Dependency | -1.7% | Global, pronounced in China and North America | Medium term (2–4 years) |
| Interoperability Gaps in Connected Systems | -1.3% | North America and EU early-adopter markets | Medium term (2–4 years) |
| EPR and Recycling-Compliance Cost Burden | -0.9% | EU, South Korea, Japan, emerging in California | Long term (≥ 4 years) |
| Source: Mordor Intelligence | |||
Component Supply-Chain Volatility
Concentration among a handful of driver IC and rare-earth suppliers exposes the commercial lighting market to prolonged lead times and price spikes. Texas Instruments and STMicroelectronics controlled around 60% of power-management ICs in early 2025, and both stretched delivery windows to 22 weeks due to automotive demand. China’s export quotas on europium-doped phosphors pushed spot prices up 28% in 2024 before stabilizing mid-2025. Smaller OEMs, lacking volume contracts, delayed launches or exited markets. North American assemblers continue to face 25% tariffs on many LED modules, prompting relocations to Vietnam and Mexico with mixed results on cost and qualification timelines.
Construction-Cycle Dependency
Non-residential starts remain cyclical, limiting near-term growth when borrowing costs rise. U.S. commercial building expenditures dropped 4.2% in 2024 as interest rates climbed.[4]U.S. Census Bureau, “Commercial Construction Spending 2024,” census.gov China’s deleveraging trimmed new commercial floor area by 11%, cutting into the largest single lighting demand pool. Retrofits help cushion revenue but owners often defer discretionary upgrades during downturns. The Architectural Billings Index stayed below 50 for eight consecutive months through mid-2025, signaling contraction in design work and, by extension, future luminaire orders.[5]American Institute of Architects, “Architectural Billings Index 2025,” aia.org Elevated vacancy rates in Europe also suppress tenant-improvement spending, slowing specification cycles for premium lighting.
*Our forecasts treat driver/restraint impacts as directional, not additive. The impact forecasts reflect baseline growth, mix effects, and variable interactions.
Segment Analysis
By Lighting Type: Integrated Luminaires Dominate Specification
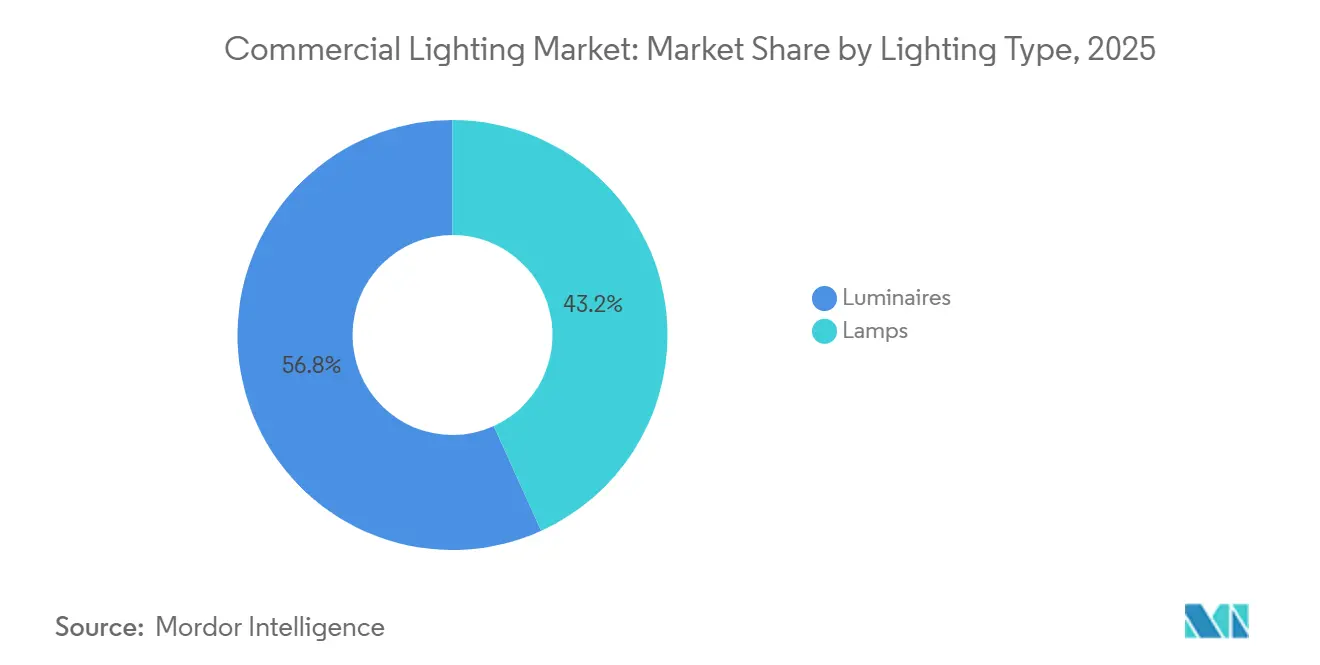
Luminaires represented 56.78% of 2025 revenues, indicating their clear lead over lamps within the commercial lighting market share. Growth at a 17.79% pace to 2031 suggests that contractors value the labor savings that arrive with fully integrated fixtures. Integrated designs cut on-site assembly time by about 30%, a critical advantage as skilled labor shortages inflate installation costs in mature markets.[6]Hubbell Incorporated, “Form 10-K 2024,” hubbell.com The segment’s dominance is underpinned by recessed troffers and linear strips that align with modern shallow plenums. Market leaders such as Hubbell and Acuity continue to integrate wireless controllers at the factory, guaranteeing interoperability and reducing field errors.
Tunable-white capabilities are spreading across hotels and hospitals, where brand differentiation and wellness metrics matter. Fagerhult deployed its Organic Response platform in more than 120 Nordic hotels, boosting guest satisfaction scores without redesigning ceilings. High-bay luminaires now arrive with Bluetooth and Li-Fi radios factory-mounted, turning warehouse ceilings into data networks. WAC Lighting’s Aether line offers linear profiles with embedded Li-Fi, a choice that appeals to corporate campuses seeking secure broadband. In contrast, the lamp segment declines steadily as building codes require luminaire-level controls incompatible with screw-base retrofits.


By Lighting Source: LED Efficacy Gains Sustain Momentum
LED products captured 66.59% of 2025 value and will compound at 18.31% through 2031, underscoring their central role in the commercial lighting market. System-level efficiencies above 150 lumens per watt and declining prices make LED retrofits attractive even in markets with subsidized electricity. Chip-on-board and chip-scale packages now displace older mid-power arrays in premium form factors, offering higher lumen density and superior thermal handling. Delta Electronics launched a COB downlight in 2025 that reaches 140 lumens per watt at 3,000 kelvin with a color-rendering index above 95, directly targeting retail applications where color fidelity drives revenue.[7]Delta Electronics, “Lighting Portfolio 2025,” deltaww.com
Conventional sources continue to recede, accelerated by disposal levies on mercury-containing lamps in the EU and Japan. OSRAM redirected USD 50 million in R&D budgets from HID to LED and LiDAR components after divesting its lamp unit in late 2024. Quantum-dot conversion films from Nanosys and 3M enter high-end architectural fixtures, broadening spectral coverage without substantial efficacy loss. The residual market for fluorescents survives in low-income geographies but shrinks each year as supplier networks dissolve and replacement inventories dry up.
By End-User: Healthcare Emerges as Growth Leader
Commercial offices remained the largest application at 48.07% of demand in 2025, reflecting both floor area and frequent tenant buildouts. Yet hospitals and outpatient clinics register the fastest growth at a 19.02% CAGR, pushing the commercial lighting market size in healthcare from niche to mainstream. A Lancet meta-analysis showed that tunable lighting shaved 1.2 days from average postoperative stays, a finding that resonates with administrators under value-based reimbursement schemes. Wipro’s MediLux ceiling luminaires merge UV-C disinfection with circadian tuning, satisfying infection control and wellness in one platform.[8]Wipro Lighting, “MediLux Catalog 2025,” wiprolighting.com
Retailers adopt dynamic scenes to guide shopper flow and accent seasonal displays, while hospitality operators retrofit ballrooms and guest rooms with color-changing profiles that sync to events. Educational facilities favor flicker-free panels that reduce eye strain during extended screen time, a growing need in hybrid learning models. Syska’s glare-controlled troffers found wide uptake in South Asian universities seeking to minimize visual fatigue among students.
By Installation Type: Retrofit Economics Drive Majority Share
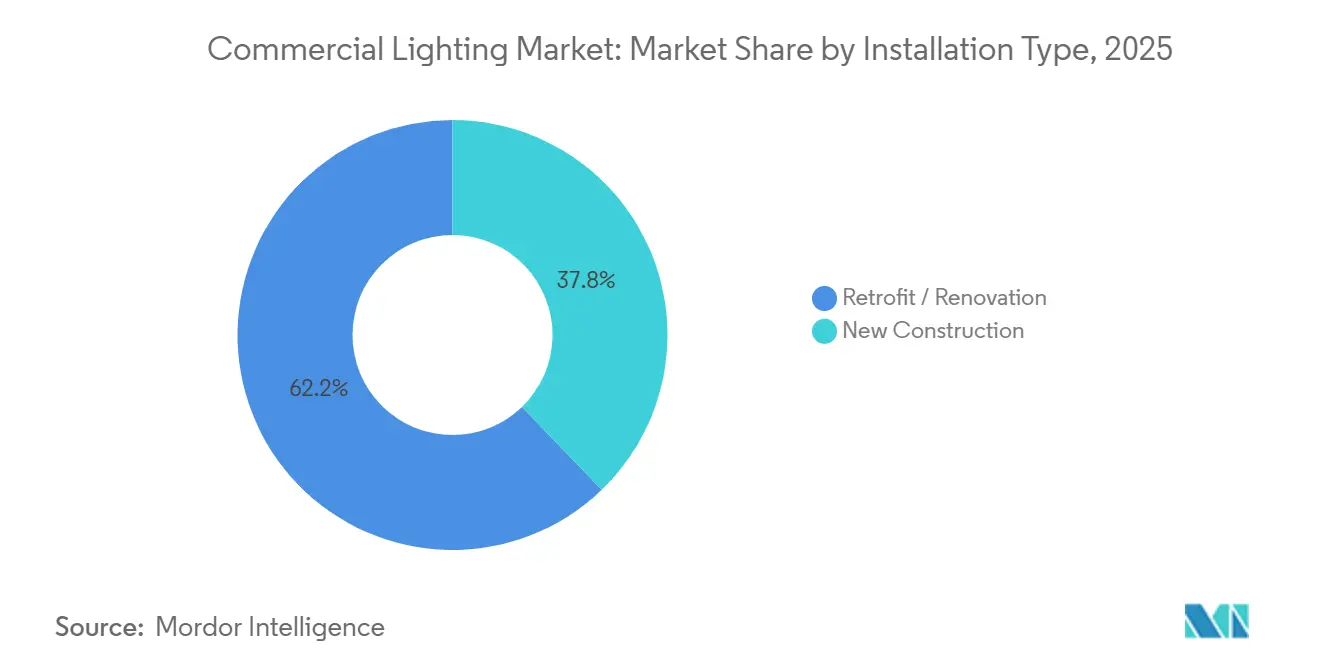
Retrofit and renovation projects formed 62.21% of 2025 activity and will maintain an 18.07% CAGR, signaling that existing building stock remains the primary battleground for the commercial lighting market. Green bonds funneling capital at lower coupon rates accelerate these upgrades. The Climate Bonds Initiative recorded USD 14.3 billion of issuance in 2024 tied to building efficiency, with lighting accounting for nearly one-quarter of eligible proceeds. ABB’s QuickFit troffer installs in under 10 minutes, dropping labor costs 35% and making retrofit economics compelling even where incentives are modest.
New builds lag in relative growth because construction cycles are sensitive to interest rates and permitting times. However, when new projects do start, they increasingly specify integrated controls from day one, creating higher per-square-foot lighting budgets. Performance contracting models, where ESCOs fund upgrades and get paid from savings, expand rapidly across municipal portfolios, locking in multiyear service agreements that stabilize revenue for luminaire OEMs.
By Connectivity: Smart Lighting Gains Traction
Non-connected fixtures still held 58.47% of shipments in 2025, yet the connected segment grows at 19.13% and should eclipse parity before 2029. LEED v5 and WELL v2 certifications require networked dimming and demand-response functions, steering new projects toward smart platforms. The International Energy Agency estimates 30% to 50% energy savings from digital controls, benefits that speak directly to CFO-level ROI hurdles. Honeywell’s Forge suite integrates lighting, HVAC, and security, generating USD 95 million in recurring software fees during 2024.
Interoperability is improving with Matter and DALI-2, evidenced by GE Current’s Lightsweep tool that auto-discovers devices and configures groups via tablet, compressing commissioning from days to hours. Non-connected products linger in budget-constrained retrofits or very small spaces where sensor payback is marginal, but component cost erosion and regulatory nudges will keep shrinking that addressable niche.
Geography Analysis
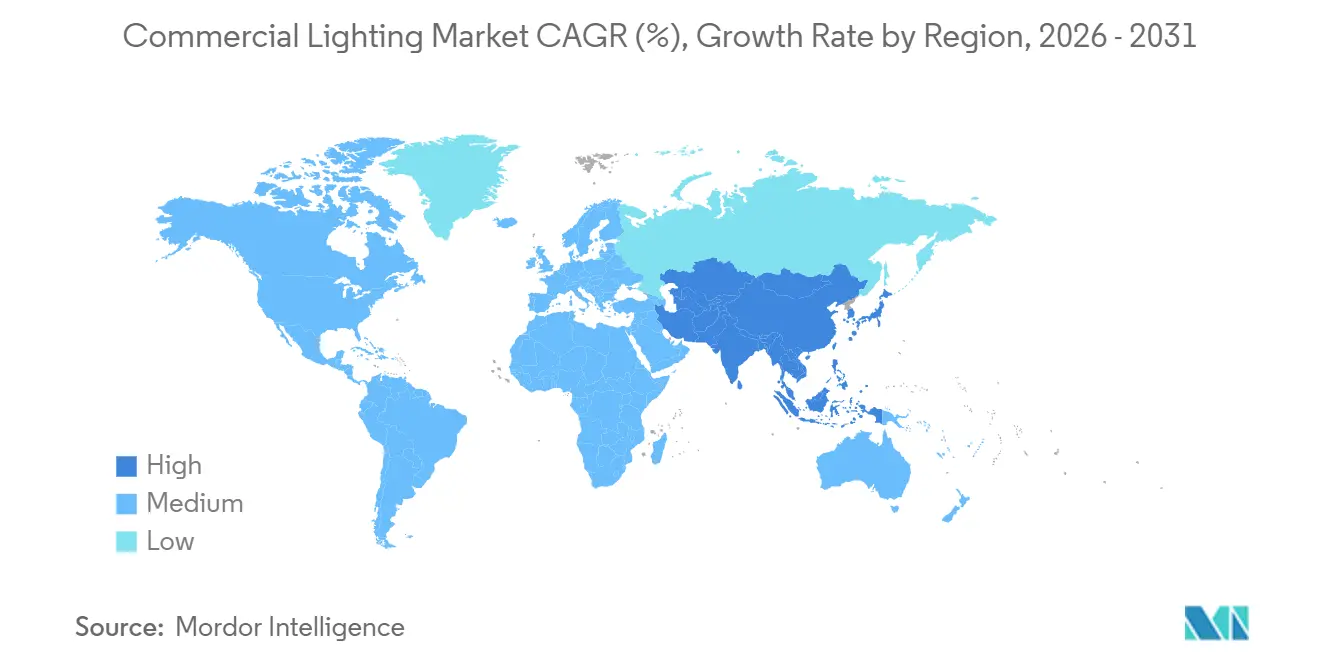
Asia Pacific commanded an 84.12% revenue share in 2025, underscoring its central role in the commercial lighting market. China alone funneled RMB 2.3 trillion (USD 320 billion) into smart-city programs that include intelligent street and commercial lighting, while India’s Bureau of Energy Efficiency set minimum efficacy thresholds that guide procurement for public buildings. Japan imposed automatic daylight harvesting for perimeter zones in 2024, further tightening national energy law. South Korea subsidizes up to 40% of retrofit costs through its Green New Deal financing, unlocking commercial demand despite a mature construction stock.
Africa grows fastest at 20.06% through 2031, propelled by 4% annual urbanization and multilateral development loans that combine solar microgrids with LED packages. The African Development Bank’s Sustainable Energy Fund disbursed USD 1.8 billion in 2024, with commercial lighting projects comprising 18% of that amount. Nigeria’s Rural Electrification Agency installed solar-powered LEDs in 2,500 markets, bundling payments through mobile kiosks. Kenya’s new standards align with a national pledge to run on 100% renewables by 2030, making LED efficacy critical to grid stability.
North America and Europe remain innovation hotspots even though they hold smaller global shares. The U.S. Department of Energy allocated USD 45 million in 2024 to tunable lighting R&D. Germany’s KfW bank offers 0.5% interest loans for retrofits that deliver at least 40% savings, turning lighting into a quick-win energy measure. The Middle East advances via project-driven megacities like NEOM, where Li-Fi luminaires provide data without electromagnetic interference, while Dubai’s 2050 clean energy roadmap mandates LEDs in all new commercial builds. Latin America advances unevenly, but Brazil’s PROCEL and Mexico’s CONUEE standards keep LED penetration moving upward across retail and hospitality clusters.

Regulatory Landscape
Energy-efficiency codes and product standards continue to narrow the specification space for fluorescent and HID solutions while raising the baseline for controls and interoperability in commercial projects. In the United States, California Energy Commission Title 24 (2025 Building Energy Efficiency Standards) took effect on January 1, 2026 for applicable permits, tightening lighting power density and strengthening requirements such as daylight harvesting and networked controls in larger spaces. ANSI/ASHRAE/IES Standard 90.1-2025 was published in 2026, updating lighting power density allowances and expanding control provisions that many jurisdictions use when updating building codes.
In Europe, regulatory obligations are moving toward lifecycle and circularity alongside efficiency, anchored by Regulation (EU) 2024/1781 (Ecodesign for Sustainable Products) adopted in June 2024, which sets a framework for broader sustainability requirements across product groups. Compliance planning is also shaped by updates to test methods and determinations, including the US DOE final rule clarifying general service lamp test procedures for mandatory testing from July 15, 2025, and the DOE February 13, 2026 determination not to amend energy conservation standards for metal halide lamp fixtures based on cost-effectiveness criteria.
Value Chain Analysis
The commercial lighting value chain runs from upstream LED packages, optics, drivers, and control electronics, through firmware and cloud software layers, then to luminaire assembly. Distribution typically goes through electrical wholesalers and specification channels, followed by installation, commissioning, and service. Electronics manufacturing services (EMS) providers play a sizable assembly role (about 35% to 40% of global lighting assembly revenue per the evidence pack), which helps brands shift capital toward connected controls, analytics, and certification-heavy product platforms while relying on contract manufacturing for scale and regional localization.
Supply-chain strategy in 2024-2026 reflects three operational pivots: geographic diversification of assembly, deeper component verticalization, and tighter standards-driven qualification. Signify expanded regional manufacturing through joint ventures, including a July 2024 JV with GILA Al Tawakol Electric to build a manufacturing base in Egypt and a March 2025 JV proposal with Dixon Technologies in India (Lightanium Technologies, incorporated in June 2025) to serve OEM demand across brands. Component depth is also increasing, as shown by the November 2025 wafer manufacturing license agreement between Inova Semiconductors and CoAsia Semi for ISELED. Downstream qualification is further shaped by updated technical requirements such as DesignLights Consortium SSL V6.0 and LUNA V2.0 (released in November 2025 and implemented in early 2026), which raise efficacy and embedded-sensor interoperability bars and, in turn, influence driver, sensor, and firmware sourcing decisions.
Competitive Landscape
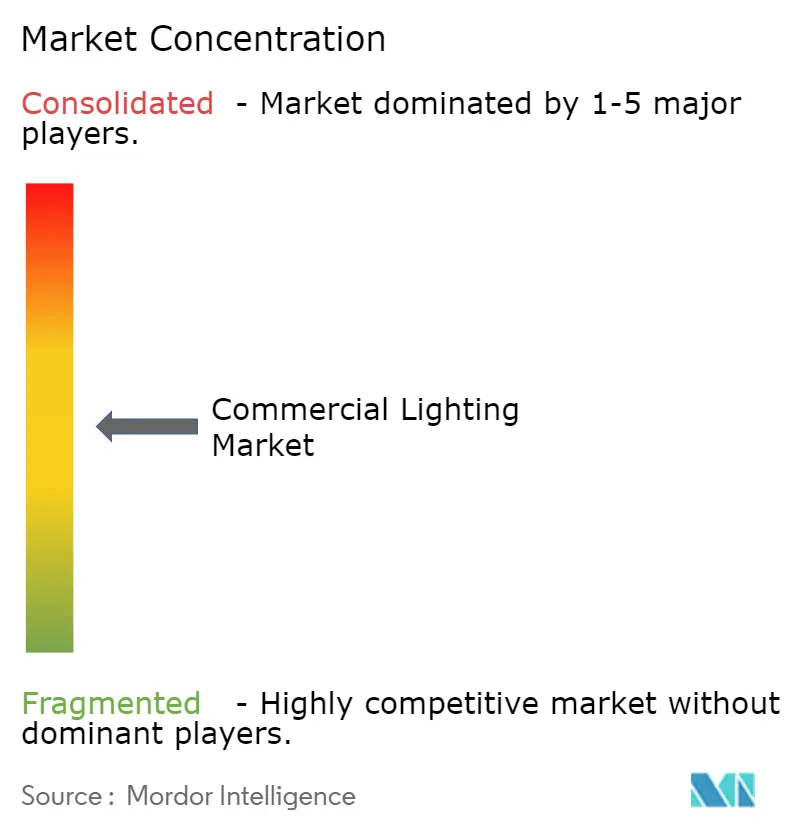
The top five suppliers together held roughly 35% of 2025 global revenue, giving the commercial lighting market a moderately fragmented structure that invites regional specialists and software-first entrants. Western incumbents protect specification share with high-CRI optics, robust warranties, and embedded analytics, yet cost-optimized Asian rivals narrow price points each year. Signify’s acquisition of WiZ Connected in 2024 demonstrates a pivot toward subscription software that layers on top of hardware. Patent filings cluster around tunable algorithms, Li-Fi modulation, and wireless mesh topologies as vendors vie for defensible IP positions.
Strategic moves in 2025 signal three themes. First, vertical integration: Acuity’s purchase of Distech Controls’ software arm bolsters BACnet and Modbus competence, cementing its Atrius platform’s role across 18,000 buildings. Second, geographic expansion: Indian brands like Havells and Syska partner with Middle Eastern distributors, leveraging flexible payment terms to win in price-sensitive segments. Third, technology leapfrogging: Zumtobel and Fraunhofer target 100 Mbps Li-Fi fixtures for surgical suites, bypassing Wi-Fi congestion. The race to deliver sub-USD 10 connectivity modules intensifies, as breaking that threshold makes smart retrofits cost-neutral in many markets.
Barriers to entry rise around regulatory compliance, extended producer responsibility, and software security certifications, limiting smaller firms’ ability to scale. However, lighting-as-a-service contracts create room for financial intermediaries that absorb capex and resell illumination by the hour, offering a new commercial channel for mid-sized OEMs. Overall, vendors differentiate via integrated sensors, AI-driven commissioning, and on-board processing that supports edge analytics for space utilization.
Commercial Lighting Industry Leaders
ABB Ltd
Honeywell LED Lighting
Wipro Lighting Limited
Signify NV (Philips Lighting)
WAC Lighting
- *Disclaimer: Major Players sorted in no particular order

Market Opportunities and Future Outlook
Code- and standard-driven control requirements are broadening the practical scope of connected lighting beyond premium projects into baseline compliance pathways, creating whitespace in interoperable controls, commissioning tools, and sensor-ready luminaires. Evidence includes California Title 24 taking effect in January 2026 with tighter lighting power density and daylight-harvesting thresholds, and ANSI/ASHRAE/IES 90.1-2025 published in 2026 with expanded control requirements and explicit coverage of exterior site lighting. Together, these changes favor luminaires delivered with integrated, standards-aligned control stacks (including DALI-2/D4i and Matter-aligned commissioning approaches referenced elsewhere in the broader RD context).
A second opportunity track centers on compliance-ready product design for safety, reporting, and lifecycle documentation, as requirements shift from purely watt-and-lumen metrics to verifiable performance under dynamic control and broader sustainability frameworks. The IEC amendment to IEC 62471-3:2026 (July 2026) introduces updated photobiological safety testing expectations for LED products using AI-driven dimming behavior, which increases demand for engineering, testing, and documentation capabilities that can be incorporated into product platforms and supplier qualification. In Europe, the revised Energy Performance of Buildings Directive entering into application in May 2026 reinforces automated controls and building-management integration for new commercial construction, supporting offerings that bundle luminaires with building-management interoperability and measurable energy reporting.
Recent Industry Developments
- June 2026: Signify announced a major European manufacturing-capacity expansion to scale its connected lighting platforms across enterprise markets. The expansion is intended to improve supply continuity and accelerate deployment of standardized control stacks across DALI-2 and Matter-aligned ecosystems.
- July 2025: Honeywell acquired the Li-ion Tamer business from Nexceris to add battery thermal runaway detection to its Building Automation segment fire and safety portfolio. The acquisition strengthens Honeywell's building-systems stack that converges with connected lighting projects in commercial facilities.
- October 2024: ABB and Zumtobel Group announced a strategic partnership to develop integrated smart building solutions, combining Zumtobel’s LITECOM lighting management and TECTON DC luminaires with ABB’s DC protection devices and i-bus KNX and i-bus DALI automation systems. The collaboration reflects the push toward tighter lighting-to-building-automation integration and increases visibility for direct-current (DC) architectures in commercial lighting installations, while also reinforcing interoperability-focused control ecosystems that influence both retrofit scope and new-build system design.


Research Methodology Framework and Report Scope
Market Definition and Coverage
For this study, the commercial lighting market covers revenue earned from lighting lamps and luminaires sold for use in commercial buildings, across new construction and retrofit projects, including both connected (smart) and non-connected products.
Scope exclusions: Residential lighting, street and highway lighting managed as municipal infrastructure, and stage or studio lighting used for entertainment are excluded from this market sizing.
Segmentation Overview
- By Lighting Type
- Lamps
- Luminaires
- By Lighting Source
- LED
- Conventional (Fluorescent, HID, Other Conventional Lighting Sources)
- By End-User
- Commercial Offices
- Retail
- Hospitality and Leisure
- Healthcare
- Other End-Users
- By Installation Type
- New Construction
- Retrofit / Renovation
- By Connectivity
- Connected / Smart Lighting
- Non-Connected Lighting
- By Geography
- North America
- United States
- Canada
- Mexico
- South America
- Brazil
- Argentina
- Rest of South America
- Europe
- Germany
- United Kingdom
- France
- Italy
- Spain
- Russia
- Rest of Europe
- Asia-Pacific
- China
- Japan
- India
- South Korea
- South-East Asia
- Rest of Asia-Pacific
- Middle East
- Saudi Arabia
- United Arab Emirates
- Turkey
- Rest of Middle East
- Africa
- South Africa
- Nigeria
- Rest of Africa
- North America
Data Sources, Market Sizing, and Validation
Desk Research
We started by mapping what drives lighting demand in commercial buildings, and then we tied those drivers to measurable indicators that can be checked year over year. Public energy and building stock references were used to understand retrofit cycles and efficiency-driven replacements, while trade flows helped sanity check supply availability in regions that import a large share of luminaires.
Typical desk sources included public datasets and references such as the US Energy Information Administration, US Department of Energy programs on lighting efficiency, Eurostat construction and energy statistics, UN Comtrade for import and export patterns, and International Energy Agency building energy publications. We also used company annual reports, investor presentations, product catalogs, and reputable press coverage to validate product mix shifts like LED penetration and networked lighting adoption. When needed, a paid subscription focused on company financials and news was used to cross-check revenue exposure to commercial channels and to time major capacity or portfolio changes. These sources are illustrative only, and we reviewed additional references for data collection, validation, and clarification.
Primary Interviews and Surveys
Primary work was used to turn general adoption stories into usable inputs, especially around retrofit timing, typical project sizes, and how pricing changes as customers move from conventional to LED and then to connected systems. We spoke with stakeholders across the value chain, including manufacturers, distributors, electrical contractors, lighting designers, facility managers, and commercial building owners. Coverage was kept broad across major regions so regional construction cycles and energy codes were reflected in the responses.
Distribution of primary research fieldwork respondents
| Company type | Respondent position | Region |
|---|---|---|
| Top tier: 26% | CXOs: 17% | APAC: 43% |
| Mid tier: 57% | Functional/Unit leaders: 34% | EMEA: 34% |
| Smaller Players: 17% | Managers: 49% | Americas: 23% |
Market-Sizing & Forecasting
Sizing was built using a top-down approach once, where commercial floor space additions, renovation intensity, and lighting point density were used to reconstruct a realistic demand pool by region, and then converted into value using a priced product mix. To keep the result grounded, we also ran selective bottom-up checks using sampled supplier revenues, channel mix signals, and a simple ASP times volume build for common luminaire categories, and then adjusted when the two views did not line up.
Key inputs used in the model included LED share versus conventional in commercial applications, the split between new construction and retrofit activity, typical replacement cycles for lamps versus luminaires, average selling price progression (including the price premium for connected lighting), and regional construction spending momentum. Interviews helped convert these into ranges that reflect what is being purchased on real projects, especially where connected adoption is still uneven and pricing depends on controls and commissioning needs. For forecasting, we used scenario analysis anchored to commercial construction outlooks and energy-efficiency policy direction, and we then applied adoption curves for LED and connected systems that were validated by expert feedback. Where bottom-up data was missing in smaller geographies, gaps were handled through peer-region ratios and import dependence checks so totals stayed consistent with trade and construction signals.
Data Validation & Update Cycle
Outputs were validated through triangulation across independent signals, including construction indicators, trade patterns for lighting products, and publicly visible shifts in efficiency standards that affect replacement demand. Variance checks were run at region and category level, and outliers were re-tested by revisiting assumptions like LED mix, connected penetration, and project-level pricing before sign-off.
A second analyst review was used to challenge the build, particularly when growth rates looked too high relative to construction activity, or when price changes could have been overstated. If a material mismatch remained, we re-contacted participants to clarify what changed, such as a sudden shift toward retrofit programs or a slowdown in new commercial starts. The report is refreshed annually, with interim updates when major events occur, and a final pre-delivery review is completed so clients receive the most current view.
Mordor Intelligence's Commercial Lighting Market Size Measured Against Other Published Estimates
It is normal to see different market values published for commercial lighting, even when the titles sound the same, because the scope and counting rules are not consistent across studies. Differences usually come from what gets included as commercial, whether controls and services are added, and how quickly LED and connected adoption is assumed to move.
The main gap comes from whether lighting controls, installation services, and broader smart-building hardware are bundled into the same number, where Mordor Intelligence counts commercial lighting as lamps and luminaires revenue and treats connected features as part of product value rather than a full building automation bundle. Another driver is the assumed pricing path, since some estimates push aggressive ASP declines for LEDs or apply one global price curve, while others keep regional price dispersion and retrofit-heavy mix effects. Update cadence also matters because public tenders, energy code changes, and commercial construction slowdowns can move short-term demand, and older models can keep outdated adoption rates in place.
Benchmark comparison
| Source | Market Size | Gaps in Research Methodology |
|---|---|---|
| Mordor Intelligence | USD 22.57 B (2026) | |
| Trade Journal A | USD 47.54 B (2024) | Often combines lamps and luminaires with adjacent items like controls, software, and services, and may also include some outdoor commercial-area lighting that overlaps with municipal scope. |
| Regional Consultancy B | USD 116.60 B (2025) | Typically uses a broad definition that can capture wider lighting revenue pools across non-residential buildings, with less clarity on whether industrial sites, infrastructure lighting, or full project value are included. |
The spread in the table is largely explained by scope bundling and by how project value is treated versus product-only revenue. By tying inputs to measurable demand drivers like commercial construction, retrofit intensity, and product mix by region, the sizing stays easier to reproduce and to stress-test when assumptions change.


Key Questions Answered in the Report
What is the current value of the commercial lighting market and its expected size by 2031?
The commercial lighting market size is USD 22.57 billion in 2026 and is projected to reach USD 51.04 billion by 2031, growing at a 17.73% CAGR.
Which segment is growing fastest within commercial lighting?
Healthcare facilities lead growth with a 19.02% CAGR through 2031, driven by circadian-aligned and UV-C disinfection luminaires.
How quickly are smart lighting systems gaining share?
Smart platforms are advancing at a 19.13% CAGR and are expected to overtake non-connected fixtures before 2029.
Why are retrofit projects dominating new installations?
Retrofits captured 62.21% of 2025 demand because ESG-linked financing and quick paybacks make upgrades financially attractive compared with new builds.
Which region is expected to grow fastest?
Africa posts the highest regional CAGR at 20.06% through 2031, supported by multilateral lending, urbanization, and off-grid solar bundles.
What is driving LED price declines in commercial lighting?
Scale manufacturing in Asia Pacific, improved wafer yields, and driver-less architectures have reduced mid-power LED package prices by double digits in consecutive years.
Page last updated on:






