
Commercial Boilers Market Size and Share
Market Overview
| Study Period | 2020 - 2031 |
|---|---|
| Market Size (2026) | USD 17.37 Billion |
| Market Size (2031) | USD 20.65 Billion |
| Growth Rate (2026 - 2031) | 3.53 % |
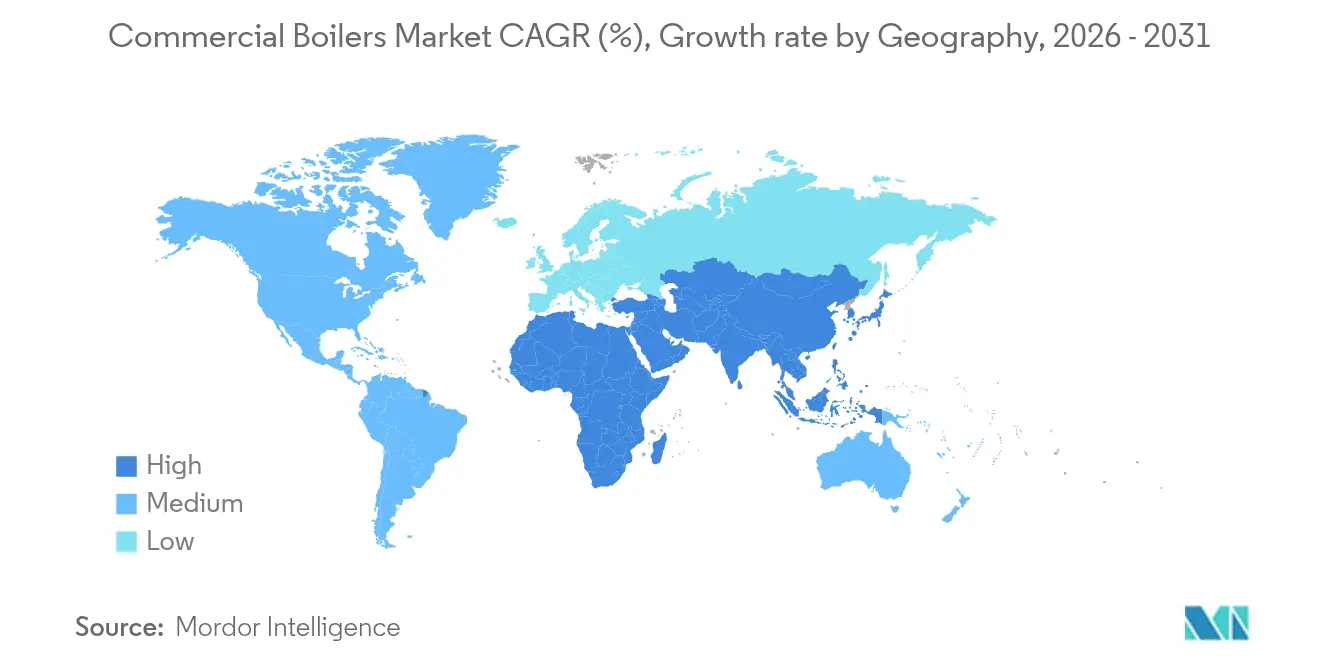
| Fastest Growing Market | Asia-Pacific |
| Largest Market | Europe |
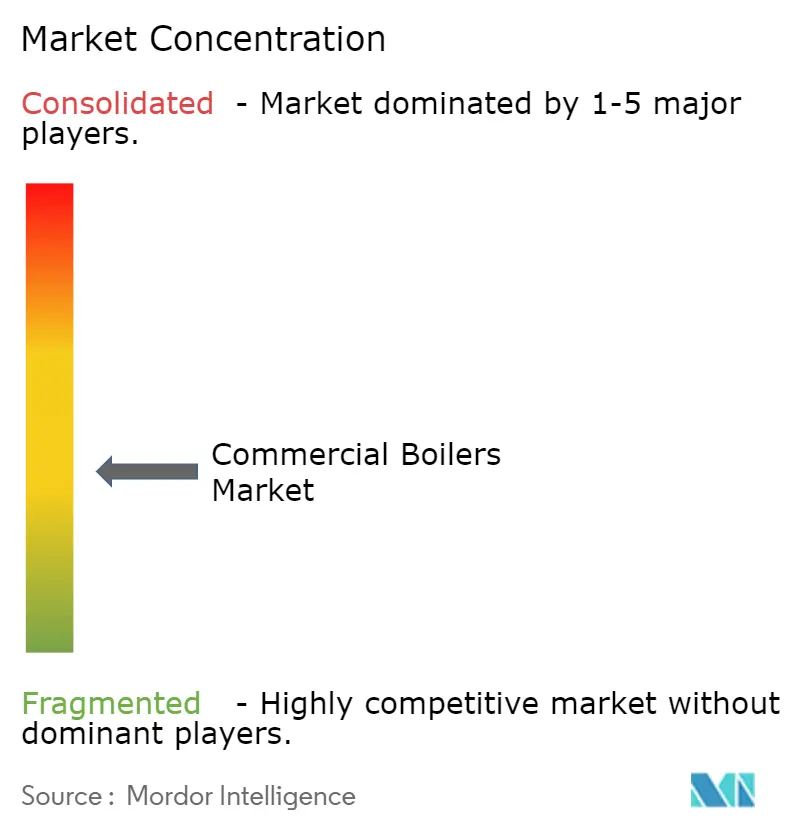
| Market Concentration | Medium |
Major Players *Disclaimer: Major Players sorted in no particular order Image © Mordor Intelligence. Reuse requires attribution under CC BY 4.0. | |
Commercial Boilers Market Analysis by Mordor Intelligence
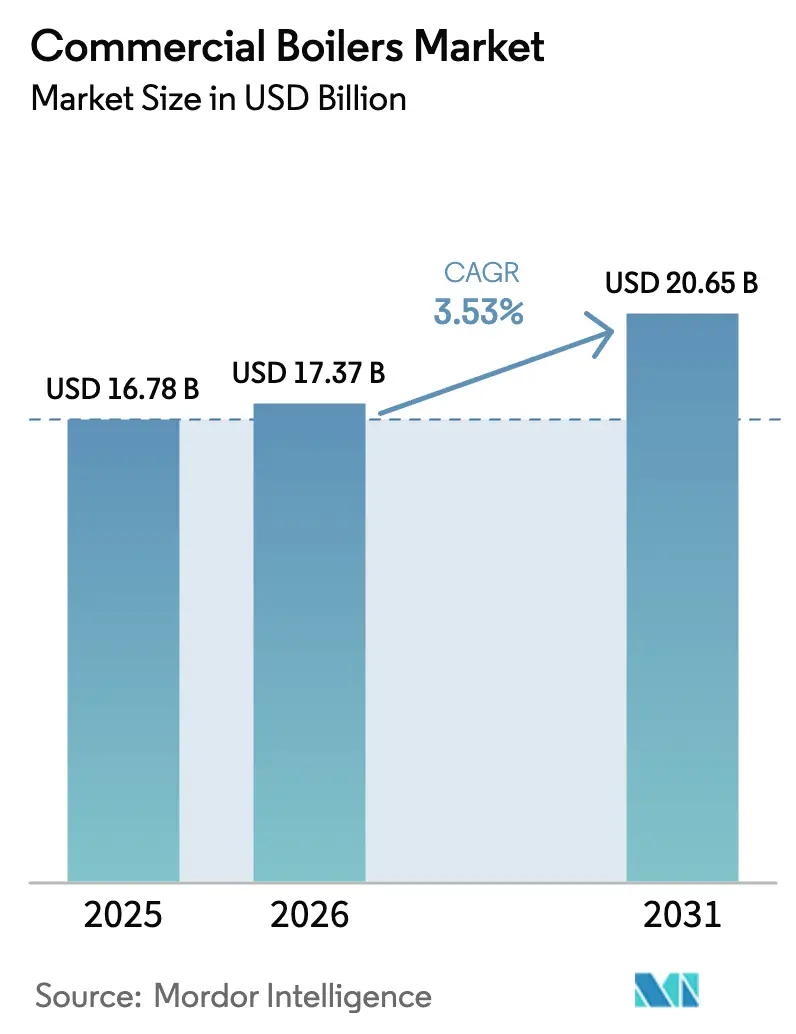
The commercial boilers market size was valued at USD 16.78 billion in 2025 and estimated to grow from USD 17.37 billion in 2026 to reach USD 20.65 billion by 2031, at a CAGR of 3.53% during the forecast period (2026-2031). Energy-efficiency mandates, NOx-emission caps and the EU’s zero-emission building targets shape current demand, steering purchases toward condensing, hybrid and fully electric models. Natural-gas systems still dominate day-to-day installations because of pipeline availability and lower operating costs, yet high-voltage electric units record the quickest uptake as building owners future-proof assets against fossil-fuel restrictions. Mid-range 50-100 MMBtu/hr units benefit from data-center construction in North America and Northern Europe, while systems under 10 MMBtu/hr remain the volume backbone of the installed base. Consolidation is accelerating, with Carrier, Miura and Bosch all acquiring specialist climate-solution firms to secure R&D depth and distribution reach in anticipation of stricter regulations.[1][2]
Key Report Takeaways
- By fuel type, natural gas captured 56.92% of commercial boilers market share in 2025, while electric boilers are projected to expand at a 4.05% CAGR through 2031.
- By technology, non-condensing units held 61.20% revenue share in 2025; condensing systems are set to grow fastest at 4.95% CAGR to 2031.
- By capacity, sub-10 MMBtu/hr systems accounted for 45.15% of the commercial boilers market size in 2025, whereas 50-100 MMBtu/hr units will post the highest 3.78% CAGR.
- By end-user industry, data centers led growth at 6.05% CAGR; offices remained the largest revenue contributor with 27.75% share in 2025.
- By geography, Europe dominated with 37.35% share in 2025; Asia-Pacific is forecast to register the quickest 3.98% CAGR to 2031.
Note: Market size and forecast figures in this report are generated using Mordor Intelligence’s proprietary estimation framework, updated with the latest available data and insights as of 2026.
Market Trends and Insights
Drivers Impact Analysis of Commercial Boilers Market*
| Driver | (~) % Impact on CAGR Forecast | Geographic Relevance | Impact Timeline |
|---|---|---|---|
| Government efficiency and NOx emission mandates | +0.8% | Global - strongest in North America and EU | Medium term (2-4 years) |
| Rising commercial space-heating demand in cold regions | +0.6% | North America, Northern Europe, Northeast Asia | Long term (≥ 4 years) |
| Shift toward cost-effective natural-gas boilers | +0.4% | Global - led by North America and Asia-Pacific | Short term (≤ 2 years) |
| Retrofit boom for hydrogen-ready and hybrid heat-pump boilers | +0.7% | Europe - early adoption in Germany and Netherlands | Long term (≥ 4 years) |
| Adoption of high-voltage electrode boilers in data centers | +0.5% | Global - major cloud regions | Medium term (2-4 years) |
| AI-powered predictive maintenance accelerating replacement cycles | +0.3% | North America and EU, expanding Asia-Pacific | Medium term (2-4 years) |
| Source: Mordor Intelligence | |||
Government Efficiency and NOx Emission Mandates Drive Technology Transitions
National and sub-national agencies have compressed compliance timetables, prompting immediate redesign of combustion platforms. The U.S. Department of Energy estimates commercial packaged-boiler standards will save 0.27 quadrillion Btu over three decades. California’s South Coast AQMD projects daily NOx cuts of 2.07 tons for water-heaters under its proposed zero-NOx rules, forcing OEMs to pivot toward condensing combustion and advanced digital controls.[3] Federal procurement rules now require 90% fossil-fuel reductions in new public buildings by FY 2029, pushing private owners to mirror specification choices. These mandates collectively lift the share of hybrid and electric offerings within the overall commercial boilers market.
Rising Commercial Space-Heating Demand in Cold Regions Sustains Market Foundation
Northern-latitude office towers, hospitals and hyperscale data centers continue to rely on high-capacity hydronic systems even as insulation standards tighten. Adoption of the 2021 International Energy Conservation Code has raised upfront construction costs by USD 7,229 per unit but delivers USD 963 annual savings, reinforcing lifecycle-based purchasing decisions. Louisville Gas and Electric’s 2024 plan cites data-center projects as a trigger for fresh capacity procurement starting 2025, a trend mirrored in Canada and Scandinavia. Cold-climate performance requirements favor condensing units that maintain efficiency at low return-water temperatures, giving technology-rich suppliers a competitive edge.
Shift Toward Cost-Effective Natural-Gas Boilers Maintains Market Dominance
Stable pricing and widespread pipeline access shield natural gas from near-term displacement. A.O. Smith recorded 8% growth in its North American boiler line during 2024 even as total company sales slipped 1% investor.[4] Viessmann’s Vitobloc modules, capable of 20% hydrogen blends, illustrate how incremental upgrades extend the lifespan of gas assets while meeting stricter emission rules. Nevertheless, city-level fossil-fuel permit caps create a patchwork of restrictions, compelling OEMs to maintain diversified portfolios.
Retrofit Boom for Hydrogen-Ready and Hybrid Heat-Pump Boilers Creates Premium Segments
European retrofit cycles have accelerated as subsidies reward hydrogen-ready systems. BDR Thermea has launched the first pure-hydrogen commercial boiler trials and plans conversion kits across its range. Weil-McLain’s ECO HP solution marries an air-to-water heat pump with a backup gas module, enabling phased retrofits that limit occupant disruption. DOE guidance for large-building boiler electrification underscores the need for integrated packages and infrastructure upgrades.
Restraints Impact Analysis of Commercial Boilers Market*
| Restraint | (~) % Impact on CAGR Forecast | Geographic Relevance | Impact Timeline |
|---|---|---|---|
| High upfront capex vs alternatives | -0.7% | Global - cost-sensitive markets | Short term (≤ 2 years) |
| Heat-pump substitution in decarbonization road-maps | -0.9% | Europe and North America, expanding Asia-Pacific | Long term (≥ 4 years) |
| Fossil-fuel permit caps in city climate policies | -0.4% | Urban centers in North America and EU | Medium term (2-4 years) |
| Long-term gas-grid investment uncertainty | -0.5% | Europe and select North American markets | Long term (≥ 4 years) |
| Source: Mordor Intelligence | |||
High Upfront Capex vs Alternatives Constrains Adoption Rates
DOE’s Commercial Building Heat Pump Accelerator highlights potential 50% energy-cost savings from rooftop heat-pump units, undercutting premium boiler packages in payback comparisons. Electric boilers often need substantial service-panel upgrades, compounding first-cost hurdles, especially for small businesses. Utility incentives increasingly prioritize electrification, deepening the price gap. Consequently, the commercial boilers market must rely on lifecycle-cost messaging and bundled service contracts to counter sticker-shock concerns in cost-sensitive geographies.
Heat-Pump Substitution in Decarbonization Road-Maps Threatens Market Share
More than 150 jurisdictions now codify electrification in building codes; Washington State has barred standalone gas boilers in large commercial structures starting 2026, and the EU will remove financial incentives for fossil-fuel appliances by 2025. Technological gains allow modern heat pumps to deliver high flow-water temperatures even at -20 °C, narrowing performance gaps. As manufacturing scale drives cost declines, electric solutions become the default specification in new construction, limiting the addressable share of the commercial boilers market beyond retrofit contexts.
*Our forecasts treat driver/restraint impacts as directional, not additive. The impact forecasts reflect baseline growth, mix effects, and variable interactions.
Commercial Boilers Market Segment Analysis
By Fuel Type:
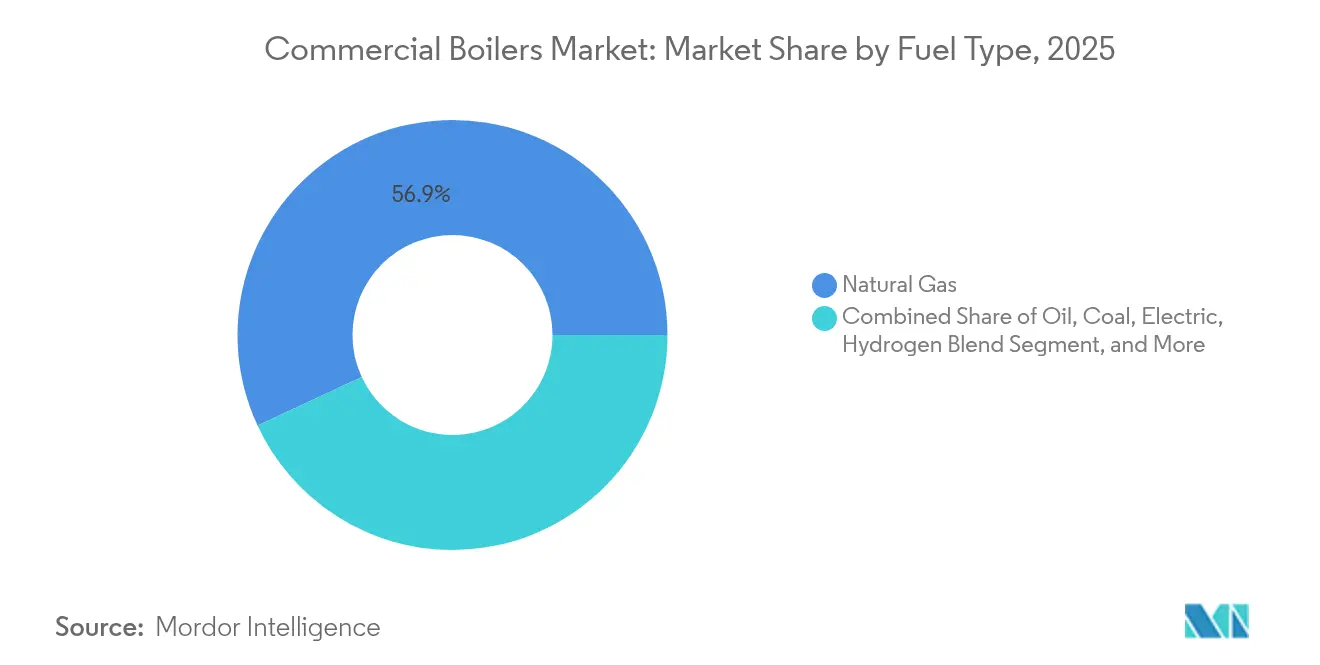
Electric Systems Challenge Gas DominanceNatural gas commanded 56.92% of commercial boilers market share in 2025 on the back of established distribution networks and predictable fuel pricing. The commercial boilers market size for electric units is forecast to swell alongside a 4.05% CAGR, propelled by zero-emission procurement mandates and data-center electrification strategies. Hydrogen-ready gas models and biomass units occupy niche demand pockets where policy incentives align with regional feedstock availability. OEMs cultivating hybrid systems hedge exposure to long-term gas-grid uncertainty while capturing premium efficiency margins.
Electric-boiler vendors highlight low maintenance and rapid modulation, but building owners must often reinforce electrical infrastructure, pushing many toward staged retrofits. Oil-fired variants continue in remote areas lacking gas lines, though environmental policies limit new installs. The fuel-type hierarchy thus reflects regional utility economics rather than pure technology merit, sustaining gas leadership through the mid-term while electric penetration accelerates.

By Technology:
Condensing Systems Drive Efficiency GainsNon-condensing designs accounted for 61.20% of revenue in 2025, a legacy of simpler installation and lower capital costs. Nonetheless, condensing models are on course for the fastest 4.95% CAGR, bolstered by minimum efficiency thresholds embedded in U.S. and EU regulations. The commercial boilers market size for condensing units is set to expand steadily as rebates narrow the upfront premium. Digital combustion management has become standard, integrating IoT sensors and cloud-based analytics for predictive maintenance.
Hybrid heat-pump-boiler platforms address peak-load flexibility and cold-climate performance, offering specifiers a compliance bridge. High-voltage electrode boilers occupy a specialist niche, serving semiconductor fabs and data centers where precise control and near-instant steam rise times matter. Across technologies, integration with building-automation protocols per ASHRAE 231P enhances lifecycle performance and positions advanced suppliers for service-contract revenues.
By Capacity:
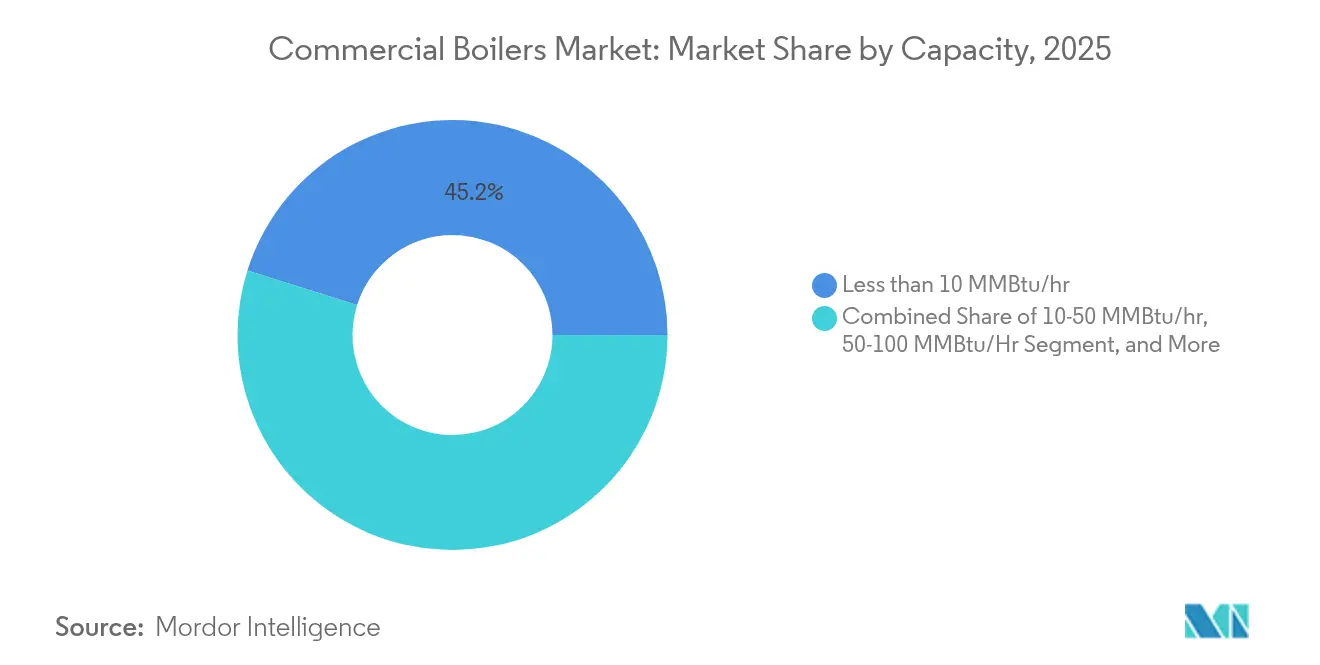
Mid-Range Systems Benefit from Data-Center DemandSystems below 10 MMBtu/hr deliver 45.15% of commercial boilers market share due to their ubiquity in small and mid-sized buildings. Yet 50-100 MMBtu/hr units will pace the segment by growing 3.78% annually, supported by hyperscale data-center builds that require redundant, high-capacity hydronic loops. The commercial boilers market size for mid-range capacity solutions will gain further impetus from hospital expansions and university campus upgrades.
Large units above 100 MMBtu/hr remain critical in district heating retrofits and petrochemical campuses but face tighter scrutiny over point-source emissions. Modular configurations allow mid-range systems to be banked for N+1 redundancy, a feature prized in data-center specification guides. The move toward standardization in this band is also lowering manufacturing costs and compressing lead times, increasing competitiveness versus custom-engineered mega-units.
By End-User Industry:
Data Centers Lead Growth AccelerationOffices represent 27.75% of 2025 revenue, reflecting the wide installed base across mature economies. However, data-center operators will drive a 6.05% CAGR through 2031 as cloud and AI compute loads soar. Mission-critical uptime requirements translate into tiered redundancy and proactive maintenance contracts, elevating average selling prices. Healthcare and education segments focus on lifecycle energy costs and stringent indoor-air-quality norms, steering purchases toward condensing and hybrid technologies.
Hospitality and retail adopt flexible capacity solutions to match occupancy variability, while public-sector buildings increasingly specify hydrogen-ready systems to align with municipal net-zero targets. Across end-users, capital-budget constraints and ESG reporting obligations dictate a nuanced value proposition that blends fuel flexibility, digital diagnostics and service bundling.
Geography Analysis
Europe Commercial Boilers Market
Europe retained a 37.35% share of the commercial boilers market in 2025, underpinned by the EU’s Energy Performance of Buildings Directive mandating zero-emission new builds from 2030. Germany delayed its fossil-fuel boiler ban from 2024 to 2028 and the UK to 2035, yet manufacturers continue scaling hydrogen-ready lines. Agora Energiewende notes that gas boilers remain the region’s most common appliance but forecasts rapid heat-pump gains in France and Germany as subsidies intensify. Viessmann’s 20% hydrogen-blend modules demonstrate how incremental adaptations preserve existing infrastructure while meeting interim targets.
APAC and MEA Commercial Boilers Market
Asia-Pacific, registering a brisk 3.98% CAGR, benefits from ongoing commercial-construction booms and updated efficiency standards, notably China’s April 2024 specification for industrial boilers. Indian supplier Thermax logged USD 1.25 billion sales and commissioned high-capacity units for a Middle-East refinery, underscoring regional cross-border opportunities. Japan and South Korea push condensing-technology adoption through utility rebates, whereas Southeast Asia prioritizes distributed biomass systems where agri-residue feedstock is abundant.
California and Texas Commercial Boilers Market
North America remains pivotal despite electrification headwinds. The DOE Heat-Pump Accelerator competes directly with gas boilers, yet A.O. Smith’s 2024 results show 8% boiler-line growth, affirming enduring demand in HVAC retrofits. State-level divergence-California’s impending NOx cap versus Texas’s emphasis on gas reliability-forces suppliers to maintain region-specific product roadmaps. Climate variability and differentiated utility rates ensure continued pluralism in fuel choices.
Regulatory Landscape
Policy pressure on commercial boiler specifications is led by building-efficiency and air-emissions rules that differentiate condensing combustion, ultra-low-NOx burners, hybrid systems, and fully electric boilers. The EU recast Energy Performance of Buildings Directive entered into force on May 28, 2024, and it prevents member states from providing financial incentives for stand-alone fossil-fuel boilers from January 1, 2025, shifting subsidy-backed projects toward electrified and hybrid configurations while retrofit compliance pathways remain important for gas assets. In the United States, DOE and EPA shape requirements through energy-conservation standards and the NESHAP framework for industrial, commercial, and institutional boilers. DOE commercial packaged-boiler standards align with ASHRAE 90.1 levels, and a July 7, 2023 DC Circuit decision vacated parts of prior DOE standards, reinforcing the need for OEMs to maintain multiple compliant configurations across jurisdictions.
Value Chain Analysis
The commercial boiler value chain spans raw material inputs such as steel and high-grade alloys, component manufacturing (burners, heat exchangers, electronic controls), and final OEM assembly and testing. Distribution channels rely on authorized manufacturer representatives, HVAC wholesale distributors like Ferguson/HVAC and Winsupply, and direct OEM engagement for large institutional accounts. Installation and commissioning are performed by mechanical and plumbing contractors, while aftermarket service, spares, and multi-year maintenance contracts form a major recurring revenue stream. Since 2024, product roadmaps increasingly bundle sensors, connectivity, and digital controls to support higher-efficiency operation and emissions compliance.
Competitive Landscape
M&A activity intensified through 2024-2025 as incumbents sought technology breadth and global scale. Carrier’s USD 12 billion purchase of Viessmann Climate Solutions added 12,000 employees and solidified access to European hydrogen-ready R&D pipelines. Miura deepened its North American footprint by acquiring Cleaver-Brooks in May 2024, setting up a Milwaukee technical hub to co-develop low-carbon solutions. Bosch’s USD 8 billion move for Johnson Controls-Hitachi HVAC nearly doubled its home-comfort revenue, giving the conglomerate 16 new manufacturing sites across 30 countries.
Strategically, firms emphasize hydrogen-ready combustion, hybrid product platforms and AI-driven service offerings. Trane’s 2025 purchase of BrainBox AI underscores the race to pair equipment with self-learning optimization tools. ASHRAE standards 223P and 231P elevate interoperability expectations, rewarding vendors that deliver open-protocol controls. Entrants specializing in high-voltage electrode boilers exploit data-center demand niches, but incumbents leverage service networks and warranty programs to defend share.
Competitive intensity is moderated by significant engineering barriers and certification costs, yet regional policy divergence encourages differentiated product lines. Over the forecast horizon, the commercial boilers market will likely see further horizontal tie-ups as players aim to spread R&D risk and accelerate time-to-market for hydrogen and electric solutions.
Commercial Boilers Industry Leaders
-
Cochran Ltd.
-
Bosch Thermotechnology (Bosch Thermotechnik GmbH)
-
A.O. Smith Corporation
-
The Fulton Companies
-
Parker Boiler Inc.
- *Disclaimer: Major Players sorted in no particular order
Commercial Boilers Market Companies Covered in this Report
- Atlas Copco AB
- Howden Group
- Ingersoll Rand Inc. (Gardner Denver)
- Kaeser Kompressoren SE
- Aerzen Maschinenfabrik GmbH
- Sulzer Ltd.
- EBARA Corp.
- Piller Blowers and Compressors
- Boldrocchi Group
- Aeromeccanica Stranich SpA
- Illinois Blower Inc.
- Spencer Turbine Company
- Continental Blower LLC
- Atlantic Blowers LLC
- Alfotech Fans
- Aerotek Equipment
- Lontra Ltd.
- Xylem Inc. (Flygt)
- Tuthill Corp.
- Multi-Wing Group
Market Opportunities and Future Outlook
Electrification, control integration, and retrofit-friendly compliance packages create whitespace for suppliers that can simplify project delivery across a fragmented regulatory map. The EU EPBD recast took effect in May 2024, and the January 2025 cutoff for financial incentives for stand-alone fossil-fuel boilers expands the addressable scope for hybrid and electric solutions in subsidized projects, while the DOE alignment of packaged-boiler efficiency with ASHRAE 90.1 keeps condensing and digitally controlled platforms central in replacement cycles. In 2026, major moves include A.O. Smith's January 2026 acquisition of Leonard Valve for USD 470 million to deepen access to institutional-grade mixing and control components, reinforcing a trend toward integrated water-management and boiler-automation packages. Market growth drivers include replacement demand for aging infrastructure, institutional retrofits, and low-NOx combustion requirements in commercial buildings.
Recent Industry Developments in Commercial Boilers Market
- May 2026: A.O. Smith Corporation announced price increases ranging from 4% to 7% for most water heater and boiler products due to steel and freight cost pressures. The action reshapes near-term bid pricing for contractors and facility owners and emphasizes the importance of lifecycle-cost and service bundle considerations in procurement decisions.
- February 2026: Bosch Home Comfort Group released a lineup of commercial rooftop heating and cooling units targeting mid-to-large commercial applications. The introduction broadens Bosch's packaged-system offerings for commercial buildings and supports projects that prefer integrated, higher-efficiency equipment.
- December 2025: Bosch Industriekessel GmbH entered a strategic partnership with A.E.P. Thermal Inc. to develop medium-voltage electrode boilers, with first projects planned for 2026. The collaboration expands high-power electric boiler capability for customers pursuing boiler-room electrification pathways in industrial and large commercial settings.
Commercial Boilers Market Report Scope and Research Methodology
Market Definition and Coverage
This market covers revenues generated from commercial-grade boilers used to produce hot water or steam for space heating and process loads in non-residential buildings. We include both new installations and replacements, and we count the value at the equipment level in USD.
Scope exclusions: We exclude residential-only boilers, on-site service labor, and building-side components such as pumps, piping, and radiators unless they are bundled into the boiler equipment price.
Segments Covered in This Report
- By Pressure
- High Pressure
- Medium Pressure
- Low Pressure
- By Stage/Configuration
- Single-Stage
- Multistage
- High-Speed Turbo
- Integrally Geared
- By Drive Type
- Direct Drive
- Belt Drive
- Integrated VSD Drive
- Magnetic-Bearing Drive
- By End-use Industry
- Mining
- Cement
- Pulp and Paper
- Construction
- Steel
- Chemicals and Petrochemicals
- Power Generation
- Water and Wastewater Treatment
- Food and Beverage
- HVAC and Commercial Buildings
- Other Industries
- By Geography
- North America
- United States
- Canada
- Mexico
- South America
- Brazil
- Argentina
- Rest of South America
- Europe
- Germany
- United Kingdom
- France
- Italy
- Russia
- Rest of Europe
- Asia-Pacific
- China
- Japan
- India
- South Korea
- ASEAN
- Rest of Asia-Pacific
- Middle East and Africa
- Middle East
- Saudi Arabia
- United Arab Emirates
- Rest of Middle East
- Africa
- South Africa
- Nigeria
- Rest of Africa
- Middle East
- North America
Data Sources, Market Sizing, and Validation
Desk Research
Desk work is used to set the market boundaries and to form an initial view of demand by geography, fuel, and building activity. Public sources such as the US Energy Information Administration (EIA), US Census Bureau construction data, Eurostat energy statistics, the International Energy Agency (IEA), and UN Comtrade trade flows help us map heating fuel mix, construction cycles, and cross-border equipment movement.
We also review building energy codes and efficiency rulebooks, including US DOE efficiency standards and EU Ecodesign, and we use peer-reviewed HVAC and thermal engineering papers to understand efficiency trends and technology shifts such as condensing adoption. Company filings, product catalogs, investor presentations, and reputable press then help cross-check typical pricing bands, capacity ranges, and replacement patterns. Where relevant, we use paid subscriptions for company financials and patent databases to sanity-check innovation intensity. The sources listed here are illustrative, and additional public and paid references were consulted for data collection, cross-checking, and clarification.
Primary Interviews and Surveys
Primary work is used to verify what desk sources cannot fully show, especially current pricing movement, replacement demand behavior, and how efficiency rules change purchasing decisions. We spoke with a mix of boiler OEM-side experts, distributors, engineering consultants, and facility decision-makers across major regions. We then used these inputs to confirm assumptions on capacity splits, technology mix, and procurement cycles before finalizing the model outputs.
Distribution of primary research fieldwork respondents
| Company type | Respondent position | Region |
|---|---|---|
| Top tier: 32% | CXOs: 15% | APAC: 45% |
| Mid tier: 46% | Functional/Unit leaders: 31% | EMEA: 29% |
| Smaller Players: 22% | Managers: 54% | Americas: 26% |
Market-Sizing & Forecasting
For sizing, we start with a top-down build where construction activity, boiler replacement cycles, and the commercial heating stock in key countries are translated into annual unit demand, then converted into value using capacity-weighted average selling prices. To keep the output realistic, we apply selective bottom-up approximations, including a supplier revenue roll-up for sampled countries, channel checks with distributors, and sampled ASP times volume for common capacity bands.
Key inputs in the model include the split of installations by capacity (including less than 10 MMBtu/hr and 10 to 50 MMBtu/hr ranges), the share of condensing versus non-condensing systems, the fuel mix by region (gas, oil, biomass, electric), and the pace of policy-driven upgrades tied to efficiency regulations. We also monitor commercial construction and renovation signals and adjust for import reliance in markets where trade data indicates a high share of sourced equipment. For smaller countries where data is thin, we use proxy ratios based on similar climate and building profiles, then re-test these assumptions using interview feedback.
For forecasting, we use scenario analysis to reflect uncertainty in gas pricing, electrification pace, and retrofit policy enforcement. The selected scenario is then translated into yearly demand and ASP paths. The final forecast is checked against the consensus range heard from industry participants, so the output stays usable for decision-making and can be replicated with the same input series.
Data Validation & Update Cycle
Validation is done through checks that compare modeled value totals against independent signals such as shipment trends, trade movements, and observed shifts in technology mix before the numbers are finalized. Large variances are flagged, and we re-check the specific drivers behind the jump, which typically trace back to a unit demand input, an ASP assumption, or a regional split.
A second analyst review is completed to confirm that definitions, math steps, and assumptions are applied consistently across geographies and years. Reports are refreshed annually, with interim updates when material events occur, such as major efficiency rule changes or sharp fuel price shifts that influence buying behavior. Before delivery, a final pass is done so clients receive the latest updated view tied to the same repeatable logic.
Mordor Intelligence's Commercial Boilers Market Size Versus Other Published Estimates
Published market values for commercial boilers can differ because studies do not always use the same equipment boundary. Some also treat capacity cutoffs, technology types, and geography coverage differently. Spreads show up when one study uses older currency timing or assumes a fixed price level, even though boiler pricing usually tracks metals, freight, and compliance costs.
By tracking capacity band splits and refreshing FX timing within the same base year, Mordor Intelligence keeps the estimate tied to equipment-only revenues by region, instead of blending in adjacent heating systems or outdated pricing assumptions. Another gap driver is how condensing, hybrid boiler-heat-pump systems, and electric boilers are treated, since some sources apply a narrower technology set and then project growth without rebalancing the mix.
Benchmark comparison
| Source | Market Size | Gaps in Research Methodology |
|---|---|---|
| Mordor Intelligence | USD 17.37 B (2026) | |
| Global Consultancy A | USD 14.70 B (2024) | Uses an earlier base year and blends commercial boiler demand with adjacent packaged heating units, which pulls the total down when equipment-only boundaries are applied. |
| Industry Portal B | USD 3.40 B (2025) | Limits scope to small-capacity units below 10 MMBtu/hr and omits parts of Asia, so the value reflects only a subset of commercial installations. |
The table shows that most of the spread comes from capacity coverage and what is counted as a boiler versus a broader heating package. When scope is kept consistent and pricing is updated using the same year and currency timing, the market size is easier to trace back to the demand drivers and re-check year after year.
Key Questions Answered in the Report
What is the current size of the commercial boilers market?
The commercial boilers market is valued at USD 17.37 billion in 2026 and is forecast to reach USD 20.65 billion by 2031.
Which fuel type leads the commercial boilers market?
Natural-gas systems lead with 56.92% market share in 2025, although electric boilers are posting the quickest 4.05% CAGR.
Why are condensing boilers gaining popularity?
Condensing units comply with stricter efficiency rules and recover latent heat, driving a projected 4.95% CAGR through 2031.
How will regulations affect future boiler purchases?
Data centers show the highest 6.05% CAGR as hyperscale facilities demand reliable, high-capacity heating.
What competitive moves are shaping the market?
Large OEMs are acquiring climate-solution specialists-such as Carrier buying Viessmann-to secure technology depth and comply with evolving policies.