
| Study Period | 2017 - 2030 |
| Base Year For Estimation | 2024 |
| Forecast Data Period | 2025 - 2030 |
| Market Size (2025) | USD 214.4 Billion |
| Market Size (2030) | USD 293.6 Billion |
| CAGR (2025 - 2030) | 6.49 % |
| Market Concentration | High |
Major Players*Disclaimer: Major Players sorted in no particular order |


Commercial Aviation Market Analysis
The Commercial Aviation Market size is estimated at 214.4 billion USD in 2025, and is expected to reach 293.6 billion USD by 2030, growing at a CAGR of 6.49% during the forecast period (2025-2030).
The commercial aviation market continues to undergo significant transformation, driven by changing travel patterns and economic developments. Tourism remains a crucial driver, contributing approximately 10% to the global GDP, with 57% of international travelers choosing air transportation as their preferred mode of travel. Airlines are increasingly focusing on route optimization and network expansion to capitalize on this growing demand. The industry is witnessing a shift toward more point-to-point services rather than traditional hub-and-spoke models, particularly in emerging markets. This transformation is accompanied by the rise of hybrid carriers that combine elements of both full-service and low-cost models to capture diverse market segments.
Fleet modernization has emerged as a central theme across the commercial aircraft industry, with airlines prioritizing fuel-efficient aircraft and sustainable operations. A significant indicator of this trend is the substantial backlog of aircraft orders, with major airlines holding orders for approximately 300 Airbus and 98 Boeing aircraft as of April 2023. Airlines are increasingly investing in next-generation aircraft that offer reduced fuel consumption and lower maintenance costs. The industry is witnessing a notable shift toward smaller, more efficient aircraft that provide greater flexibility in route planning and frequency optimization.
Manufacturing dynamics in the aircraft manufacturing market are evolving with an increased focus on production efficiency and supply chain resilience. During the forecast period, manufacturers are expected to deliver approximately 14,080 commercial aircraft globally, reflecting the robust demand for new aircraft. Original Equipment Manufacturers (OEMs) are implementing advanced manufacturing techniques and automation to enhance production capabilities. The industry is also witnessing increased collaboration between manufacturers and suppliers to ensure stable production rates and timely deliveries.
Technological innovation continues to reshape the commercial aerospace landscape, with particular emphasis on digital transformation and enhanced passenger experience. Airlines are investing in advanced avionics, predictive maintenance systems, and improved cabin designs to enhance operational efficiency and passenger comfort. The integration of artificial intelligence and data analytics is enabling better fleet management and maintenance planning. Recent developments include the adoption of composite materials in aircraft construction, advanced propulsion systems, and enhanced connectivity solutions, demonstrating the industry's commitment to technological advancement and operational excellence.
Global Commercial Aviation Market Trends
Ease of travel restrictions and the rising number of passengers are driving the demand
- As cross-border travel was progressively restored, the carriers in the Asia-Pacific have raced to put on flights to meet runaway demand, stimulated by the pent-up desire to travel and savings accumulated in the two years of isolation due to COVID-19. As a result, in 2022, air passenger traffic in the region recovered more rapidly from the pandemic than other regions. For instance, in 2022, air passenger traffic in Asia-Pacific was recorded at 2.2 billion, witnessing a growth of 10% compared to 2021. Moreover, airline companies in the region are implementing fleet expansion plans to cater to the growing air passenger traffic in the major countries in the region. China, India, Japan, and Indonesia account for 70% of the total air passenger traffic in Asia-Pacific and are expected to generate more demand for new aircraft compared to other countries in the region.
- Airlines in Asia-Pacific witnessed a notable recovery in international air passenger markets as pent-up travel demand continued to fuel growth despite increasingly challenging global economic conditions. The passenger load factor for the region's airlines also improved, showing a year-on-year increase of 17.9 ppts and reaching 78.8%. These developments in total ASK and passenger load factor are highly encouraging and support the increasing demand for air travel in the region. Moreover, the healthy growth in international passenger traffic shows strong travel demand from the business and leisure sectors. The rapid increase in air passenger traffic in the region is expected to drive the air transport industry in the future.

Understand The Key Trends Shaping This Market
Download PDF
OTHER KEY INDUSTRY TRENDS COVERED IN THE REPORT
- Ease of travel restrictions and the rising number of passengers are driving the demand
- The re-opening of Asian markets is boosting traffic through Gulf hubs
- The entry of new airlines is driving the air passenger traffic
- Increasing demand for cargo operations and the opening of new cargo routes are driving the market
- Increasing cargo demand and opening of new routes are driving the market
- The Asia-Pacific economies have been subject to an increase in economic pressure due to a surge in public debt, which has had a negative impact on their defense spending
- The increased inflation has adversely impacted the growth of the region
- In South America, commodity exporters have been able to capitalize on external demand as an engine for growth
- Domestic RPK capacity has fully recovered to pre-pandemic levels
- The demand for domestic travel in the United States witnessed significant growth
- Though inflation in Asia-Pacific increased significantly across the board, the average inflation has been lower than in most other regions
- The ongoing military conflicts have worsened the economic conditions in the region
- The surge in commodity costs and supply disruptions resulted in a high inflation rate in the region
- The growth in domestic travel is increasing the demand
- The increase in demand from domestic travelers is driving the market
- Air cargo demand is driving the air freight traffic growth in the Asia-Pacific
- The opening of new routes and demand for both global and international cargo operations are significant driving factors
- The introduction of new services, capacity, and investment in additional aircraft for air cargo is driving the demand in South America
- The Ukraine-Russia War is expected to improve defense contribution, even with economic growth uncertainty
- Improving economic stability can aid in the growth of North America
- Positive trends in the civil aviation sector are expected to increase revenue passenger kilometer during the forecast period
- Rising air travel is driving the growth of RPKs in the Region
- The region's aviation industry is heavily impacted by inflation, currency depreciation, and slow economic recovery
- A surge in import prices due to the Russia-Ukraine War led to an increase in inflation in the region
- Inflation in the United States has not been this high since 1980
Segment Analysis: By Sub Aircraft Type
Passenger Aircraft Segment in Commercial Aviation Market
The passenger aircraft market segment dominates the commercial aircraft sales sector, accounting for approximately 96% of the total market share in 2024. This substantial market share is primarily driven by increasing air passenger traffic and the growth of the middle-class population in emerging countries. The segment's strength is further reinforced by the expansion plans of major airlines globally, particularly in regions like Asia-Pacific and North America. Airlines are increasingly focusing on fleet modernization and expansion, with a significant emphasis on fuel-efficient aircraft. The demand is particularly strong in the narrowbody aircraft category, which is preferred for domestic and short-haul routes, while widebody aircraft continue to serve long-haul international routes. The segment's growth is also supported by the rising number of low-cost carriers worldwide and the recovery of international air travel post-pandemic. The commercial aircraft passenger service unit market is also benefiting from these trends, as airlines seek to enhance the passenger experience.
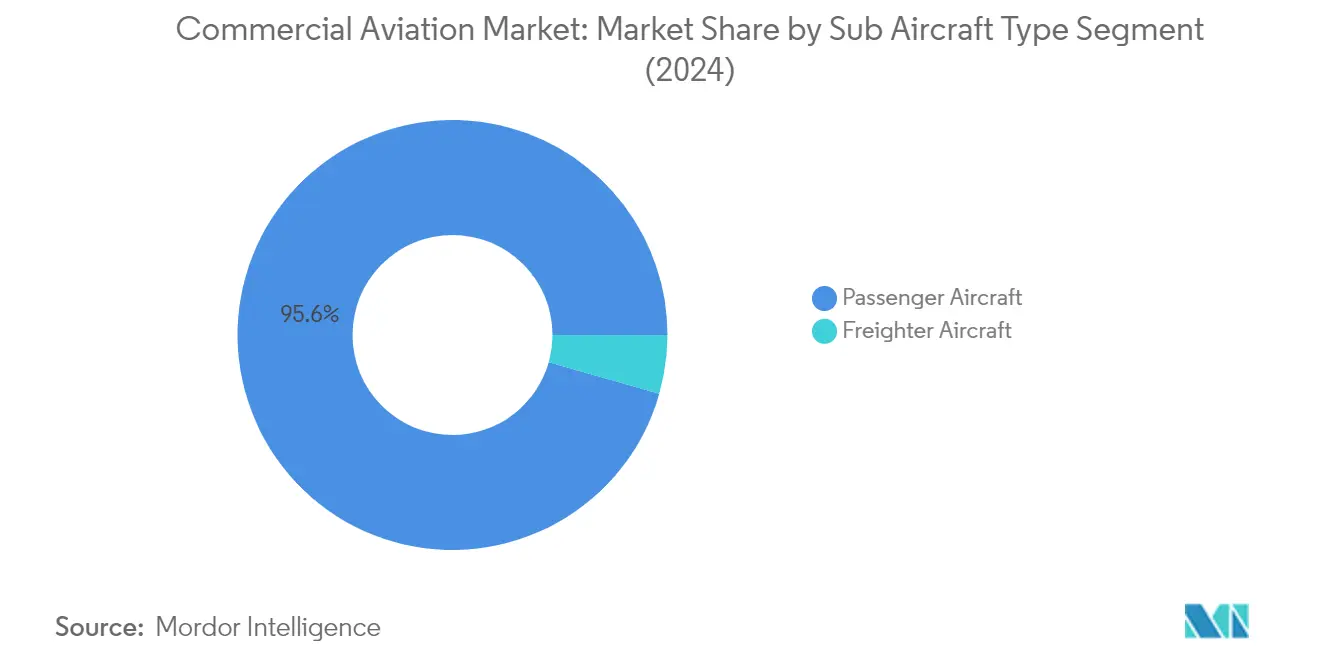
Freighter Aircraft Segment in Commercial Aviation Market
The freighter aircraft segment is emerging as the fastest-growing segment in the commercial aviation market, projected to grow at approximately 10% CAGR from 2024 to 2029. This remarkable growth is primarily driven by the surge in e-commerce activities and the establishment of new trade relationships among different countries. The segment is witnessing increased demand for both new freighter aircraft and passenger-to-freight conversions. Major logistics companies and airlines are expanding their cargo fleets to meet the growing demand for air freight services. The rise in international trade, particularly in regions like Asia-Pacific and North America, is creating substantial opportunities for freighter aircraft manufacturers. Additionally, the development of dedicated air cargo hubs and the increasing focus on time-sensitive deliveries are further propelling the segment's growth. The aircraft market size for freighter aircraft is expected to expand significantly as these trends continue.
Commercial Aviation Market Geography Segment Analysis
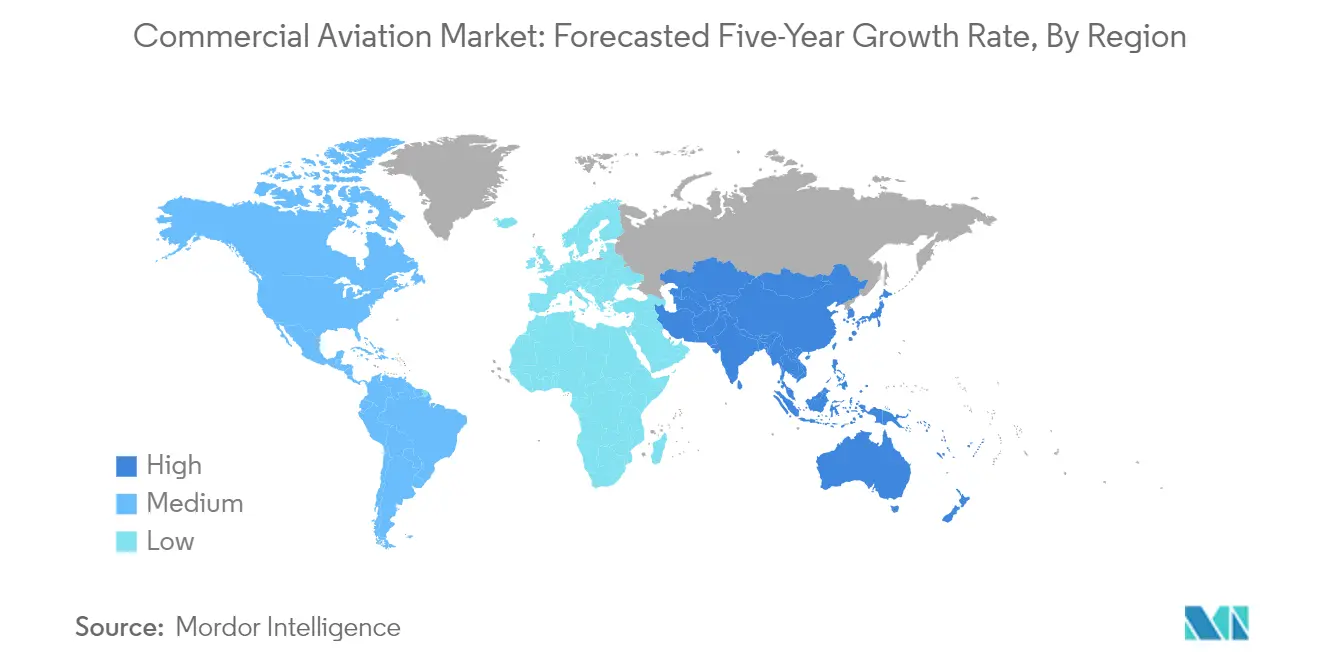
Commercial Aviation Market in Asia-Pacific
The commercial aviation market in the Asia-Pacific region represents a dynamic and rapidly evolving sector, characterized by diverse economic landscapes and varying levels of market maturity across different countries. China, India, and Japan serve as the primary growth engines, while emerging economies like Indonesia, Malaysia, and Thailand are witnessing increased air travel demand driven by rising disposable incomes and growing middle-class populations. The region's aviation infrastructure continues to expand with new airport developments and modernization projects, particularly in countries like India and Indonesia. Countries across the region are focusing on enhancing their domestic and international connectivity, with several major carriers implementing fleet modernization programs to meet growing passenger demands.
Commercial Aviation Market in China
China stands as the dominant force in Asia-Pacific's commercial aviation market, spearheading the region's growth through substantial investments in aviation infrastructure and fleet expansion. The country has emerged as an international hub for both business and leisure travel, with its aviation market benefiting from strong domestic demand and increasing international routes. Chinese airlines have been actively expanding their fleets with both narrow-body and wide-body aircraft to serve diverse route requirements. With approximately 19% aviation market share in 2024, China's commercial aviation sector is supported by robust government initiatives and growing urbanization. The country's aviation infrastructure continues to expand with new airport developments and modernization of existing facilities, while domestic carriers are implementing aggressive fleet expansion strategies to meet growing passenger demands.
Commercial Aviation Market in India
India emerges as the fastest-growing commercial aviation market in the Asia-Pacific region, with a projected growth rate of approximately 11% during 2024-2029. The country's aviation sector is experiencing transformative growth driven by increasing air travel accessibility and expanding route networks. India's commercial aviation landscape is characterized by a strong presence of low-cost carriers, which dominate the domestic market share compared to full-service carriers. The government's regional connectivity scheme and initiatives to develop new airports are fostering growth in tier-2 and tier-3 cities. The country's airlines are implementing ambitious fleet expansion plans, particularly focusing on narrow-body aircraft to serve the growing domestic market, while also strengthening international connectivity through strategic route expansions.
Commercial Aviation Market in Europe
Europe's commercial aviation market demonstrates a mature and sophisticated ecosystem, supported by advanced infrastructure and strong regulatory frameworks across its member states. The region's aviation landscape is characterized by a mix of legacy carriers and low-cost airlines, serving both intra-European and international routes. Countries like the UK, Germany, and France lead the market with their established aviation sectors, while emerging markets in Eastern Europe show promising growth potential. The region's focus on sustainable aviation and technological innovation continues to shape market dynamics, with airlines increasingly investing in fuel-efficient aircraft and exploring alternative fuel solutions.
Commercial Aviation Market in United Kingdom
The United Kingdom maintains its position as Europe's largest commercial aviation market, commanding approximately 3% aviation market share in 2024. The country's aviation sector benefits from its strategic geographical location and strong international connectivity through major hubs like Heathrow and Gatwick airports. British carriers have been actively modernizing their fleets with a focus on fuel-efficient aircraft, while also expanding their route networks to capture growing travel demand. The UK's aviation infrastructure continues to evolve with ongoing development projects and capacity enhancement initiatives at major airports, supporting the growing passenger traffic and cargo operations.
Commercial Aviation Market in Germany
Germany demonstrates remarkable growth potential in Europe's commercial aviation market, with a projected growth rate of approximately 5% during 2024-2029. The country's aviation market benefits from its central European location and strong economic fundamentals, making it a crucial hub for both passenger and cargo operations. German carriers are actively pursuing fleet modernization programs with a focus on environmental sustainability and operational efficiency. The country's robust aerospace industry and technological capabilities further support market growth, while major airports continue to enhance their infrastructure to accommodate increasing traffic volumes.
Commercial Aviation Market in Middle East and Africa
The Middle East and Africa region presents a diverse commercial aviation market landscape, characterized by varying levels of market maturity and infrastructure development. The Middle Eastern carriers, particularly from the UAE, Qatar, and Saudi Arabia, have established themselves as global aviation powerhouses through strategic hub development and extensive fleet expansion programs. The region benefits from its geographical advantage as a natural connecting point between East and West, facilitating significant transit traffic. African aviation markets show promising growth potential, driven by increasing regional integration and rising air travel demand, though infrastructure development remains a key focus area.
Commercial Aviation Market in United Arab Emirates
The United Arab Emirates stands as the largest commercial aviation market in the Middle East and Africa region, leveraging its strategic location and world-class aviation infrastructure. The country has successfully positioned itself as a global aviation hub through significant investments in airport infrastructure and airline fleet expansion. UAE-based carriers have established extensive global networks, serving both passenger and cargo operations. The country's aviation sector benefits from strong government support and continues to attract international traffic through its major hubs in Dubai and Abu Dhabi.
Commercial Aviation Market in Qatar
Qatar emerges as the fastest-growing commercial aviation market in the Middle East and Africa region, demonstrating remarkable expansion in its aviation sector. The country has made substantial investments in its aviation infrastructure, including the development of state-of-the-art airport facilities. Qatar's national carrier has been actively expanding its fleet and route network, strengthening its position in the global aviation market. The country's aviation strategy focuses on both passenger and cargo operations, supported by continuous fleet modernization and network expansion initiatives.
Commercial Aviation Market in North America
North America's commercial aviation market represents a mature and well-established sector, characterized by advanced infrastructure and strong regulatory frameworks. The United States dominates the regional market, followed by Canada and Mexico, with each country contributing uniquely to the region's aviation landscape. The market benefits from strong domestic travel demand, particularly in the United States, while also maintaining robust international connectivity. The United States leads as the largest market in the region, while Mexico shows promising growth potential with its expanding aviation sector. The region's airlines continue to focus on fleet modernization and network optimization, with a growing emphasis on fuel efficiency and environmental sustainability.
Commercial Aviation Market in South America
South America's commercial aviation market demonstrates significant growth potential, driven by increasing air travel accessibility and expanding route networks. The region's aviation landscape is characterized by a mix of established carriers and emerging low-cost airlines, serving both domestic and international routes. Brazil emerges as the largest market in the region, benefiting from its extensive domestic network and growing international connectivity. Chile shows the fastest growth potential, supported by its strategic location and expanding aviation infrastructure. The region's airlines are actively pursuing fleet modernization programs, with a particular focus on narrow-body aircraft to serve growing domestic and regional routes.
Get Analysis on Important Geographic Markets
Download PDF
Commercial Aviation Industry Overview
Top Companies in Commercial Aviation Market
The commercial airplane manufacturers market is characterized by intense competition among major manufacturers who are continuously investing in product innovation and technological advancement. Companies are focusing on developing more fuel-efficient aircraft, incorporating sustainable aviation fuels, and enhancing passenger comfort through advanced cabin designs. Operational agility has become crucial, with manufacturers streamlining production processes and strengthening supply chain relationships to meet delivery timelines. Strategic partnerships with airlines, leasing companies, and technology providers have emerged as a key trend to expand market presence. Companies are also investing heavily in research and development to develop next-generation aircraft with improved performance characteristics. Geographic expansion, particularly in emerging markets, remains a priority with manufacturers establishing regional production facilities and service centers to better serve local customers.
Consolidated Market Led By Global Players
The commercial aviation market exhibits a highly consolidated structure dominated by a few global manufacturers with extensive manufacturing capabilities and established brand presence. These major players possess significant technological expertise, robust financial resources, and well-established distribution networks spanning multiple continents. The market is characterized by high entry barriers due to substantial capital requirements, complex regulatory frameworks, and the need for advanced technological capabilities. The presence of strong incumbent players has made it challenging for new entrants to gain significant market share in the aviation industry, leading to a relatively stable competitive landscape.
The industry has witnessed strategic collaborations and joint ventures rather than traditional mergers and acquisitions, particularly in developing new aircraft programs and entering emerging markets. Major manufacturers have focused on vertical integration strategies, acquiring key component suppliers to ensure supply chain stability and maintain quality control. Regional players typically operate in specific market segments or serve as tier-one suppliers to major manufacturers, contributing to the industry's hierarchical structure. The market has also seen increased collaboration between manufacturers and technology companies to incorporate advanced digital solutions and improve operational efficiency.
Innovation and Sustainability Drive Future Success
Success in the commercial aircraft manufacturing market increasingly depends on manufacturers' ability to develop innovative, sustainable aircraft solutions while maintaining cost competitiveness. Incumbent players must focus on continuous product innovation, particularly in developing fuel-efficient technologies and reducing environmental impact. Building strong relationships with airlines and leasing companies through comprehensive after-sales support and maintenance services has become crucial for maintaining market position. Companies must also invest in digital technologies and advanced manufacturing processes to improve operational efficiency and reduce production costs.
For contenders looking to gain market share among aircraft manufacturers, focusing on specific market segments or regions where they can build competitive advantages is essential. This includes developing specialized aircraft for regional markets or focusing on emerging segments like electric aircraft. Success also depends on building strong supplier networks and establishing strategic partnerships with established players. The increasing focus on environmental regulations and sustainability requirements presents both challenges and opportunities for market participants. Companies must adapt to evolving customer preferences and regulatory requirements while maintaining profitability and operational efficiency. The ability to secure long-term contracts with major airlines and develop innovative financing solutions will remain critical success factors.
Commercial Aviation Market Leaders
-
Airbus SE
-
ATR
-
Embraer
-
The Boeing Company
-
United Aircraft Corporation
- *Disclaimer: Major Players sorted in no particular order

Need More Details on Market Players and Competiters?
Download PDF
Commercial Aviation Market News
- June 2023: Boeing received solid 40 737 Max 8s orders from Irish aircraft leasing company Avolon.
- June 2023: Air Algérie, the national airline of Algeria, signed a contract to purchase seven wide-body aircraft to support commercial development.
- June 2023: Delta Air Lines Inc. is in talks with Airbus SE (AIR.PA) for a jumbo jet order. Orders include both A350 and A330neo dual-aisle.
Free With This Report
We provide a complimentary and exhaustive set of data points on global and regional metrics that present the fundamental structure of the industry. Presented in the form of 45+ free charts, the section covers data on commercial aircraft deliveries by manufacturer, backlogs of commercial aircraft, active military aircraft fleet by type of aircraft, overall business jets and helicopters fleet by manufacturer and also classified by type of ownership.


Commercial Aviation Market Report - Table of Contents
1. EXECUTIVE SUMMARY & KEY FINDINGS
2. REPORT OFFERS
3. INTRODUCTION
- 3.1 Study Assumptions & Market Definition
- 3.2 Scope of the Study
- 3.3 Research Methodology
4. KEY INDUSTRY TRENDS
-
4.1 Air Passenger Traffic
- 4.1.1 Asia-Pacific
- 4.1.2 Europe
- 4.1.3 Middle East and Africa
- 4.1.4 North America
- 4.1.5 South America
-
4.2 Air Transport Freight
- 4.2.1 Asia-Pacific
- 4.2.2 Europe
- 4.2.3 Middle East and Africa
- 4.2.4 North America
- 4.2.5 South America
-
4.3 Gross Domestic Product
- 4.3.1 Asia-Pacific
- 4.3.2 Europe
- 4.3.3 Middle East and Africa
- 4.3.4 North America
- 4.3.5 South America
-
4.4 Revenue Passenger Kilometers (rpk)
- 4.4.1 Asia-Pacific
- 4.4.2 Europe
- 4.4.3 Middle East and Africa
- 4.4.4 North America
- 4.4.5 South America
-
4.5 Inflation Rate
- 4.5.1 Asia-Pacific
- 4.5.2 Europe
- 4.5.3 Middle East and Africa
- 4.5.4 North America
- 4.5.5 South America
- 4.6 Regulatory Framework
- 4.7 Value Chain Analysis
5. MARKET SEGMENTATION (includes market size in Value in USD and Volume, Forecasts up to 2030 and analysis of growth prospects)
-
5.1 Sub Aircraft Type
- 5.1.1 Freighter Aircraft
- 5.1.2 Passenger Aircraft
- 5.1.2.1 Narrowbody Aircraft
- 5.1.2.2 Widebody Aircraft
-
5.2 Region
- 5.2.1 Asia-Pacific
- 5.2.1.1 Australia
- 5.2.1.2 China
- 5.2.1.3 India
- 5.2.1.4 Indonesia
- 5.2.1.5 Japan
- 5.2.1.6 Malaysia
- 5.2.1.7 Philippines
- 5.2.1.8 Singapore
- 5.2.1.9 South Korea
- 5.2.1.10 Thailand
- 5.2.1.11 Rest of Asia-Pacific
- 5.2.2 Europe
- 5.2.2.1 France
- 5.2.2.2 Germany
- 5.2.2.3 Italy
- 5.2.2.4 Netherlands
- 5.2.2.5 Russia
- 5.2.2.6 Spain
- 5.2.2.7 Turkey
- 5.2.2.8 UK
- 5.2.2.9 Rest of Europe
- 5.2.3 Middle East and Africa
- 5.2.3.1 Algeria
- 5.2.3.2 Egypt
- 5.2.3.3 Qatar
- 5.2.3.4 Saudi Arabia
- 5.2.3.5 South Africa
- 5.2.3.6 United Arab Emirates
- 5.2.3.7 Rest of Middle East and Africa
- 5.2.4 North America
- 5.2.4.1 Canada
- 5.2.4.2 Mexico
- 5.2.4.3 United States
- 5.2.4.4 Rest of North America
- 5.2.5 South America
- 5.2.5.1 Brazil
- 5.2.5.2 Chile
- 5.2.5.3 Colombia
- 5.2.5.4 Rest of South America
6. COMPETITIVE LANDSCAPE
- 6.1 Key Strategic Moves
- 6.2 Market Share Analysis
- 6.3 Company Landscape
-
6.4 Company Profiles
- 6.4.1 Airbus SE
- 6.4.2 ATR
- 6.4.3 COMAC
- 6.4.4 De Havilland Aircraft of Canada Ltd.
- 6.4.5 Embraer
- 6.4.6 The Boeing Company
- 6.4.7 United Aircraft Corporation
- *List Not Exhaustive
7. KEY STRATEGIC QUESTIONS FOR AVIATION CEOS
8. APPENDIX
-
8.1 Global Overview
- 8.1.1 Overview
- 8.1.2 Porter’s Five Forces Framework
- 8.1.3 Global Value Chain Analysis
- 8.1.4 Market Dynamics (DROs)
- 8.2 Sources & References
- 8.3 List of Tables & Figures
- 8.4 Primary Insights
- 8.5 Data Pack
- 8.6 Glossary of Terms
You Can Purchase Parts Of This Report. Check Out Prices For Specific Sections
Get Price Break-up Now
List of Tables & Figures
- Figure 1:
- AIR PASSENGER TRAFFIC, NUMBER OF PASSENGERS TRAVELLED, ASIA-PACIFIC, 2017 - 2030
- Figure 2:
- AIR PASSENGER TRAFFIC, NUMBER OF PASSENGERS TRAVELLED, EUROPE, 2017 - 2030
- Figure 3:
- AIR PASSENGER TRAFFIC, NUMBER OF PASSENGERS TRAVELLED, MIDDLE EAST AND AFRICA, 2017 - 2030
- Figure 4:
- AIR PASSENGER TRAFFIC, NUMBER OF PASSENGERS TRAVELLED, NORTH AMERICA, 2017 - 2030
- Figure 5:
- AIR PASSENGER TRAFFIC, NUMBER OF PASSENGERS TRAVELLED, SOUTH AMERICA, 2017 - 2030
- Figure 6:
- AIR TRANSPORT FREIGHT, MILLION TON-KM, ASIA-PACIFIC, 2017 - 2030
- Figure 7:
- AIR TRANSPORT FREIGHT, MILLION TON-KM, EUROPE, 2017 - 2030
- Figure 8:
- AIR TRANSPORT FREIGHT, MILLION TON-KM, MIDDLE EAST AND AFRICA, 2017 - 2030
- Figure 9:
- AIR TRANSPORT FREIGHT, MILLION TON-KM, NORTH AMERICA, 2017 - 2030
- Figure 10:
- AIR TRANSPORT FREIGHT, MILLION TON-KM, SOUTH AMERICA, 2017 - 2030
- Figure 11:
- GROSS DOMESTIC PRODUCT, USD, ASIA-PACIFIC, 2017 - 2030
- Figure 12:
- GROSS DOMESTIC PRODUCT, USD, EUROPE, 2017 - 2030
- Figure 13:
- GROSS DOMESTIC PRODUCT, USD, MIDDLE EAST AND AFRICA, 2017 - 2030
- Figure 14:
- GROSS DOMESTIC PRODUCT, USD, NORTH AMERICA, 2017 - 2028
- Figure 15:
- GROSS DOMESTIC PRODUCT, USD, SOUTH AMERICA, 2017 - 2030
- Figure 16:
- DISTANCE TRAVELLED BY REVENUE PASSENGERS BY COUNTRY, RPK, ASIA-PACIFIC, 2017 - 2030
- Figure 17:
- DISTANCE TRAVELLED BY REVENUE PASSENGERS BY COUNTRY, RPK, EUROPE, 2017 - 2030
- Figure 18:
- DISTANCE TRAVELLED BY REVENUE PASSENGERS BY COUNTRY, RPK, MIDDLE EAST AND AFRICA, 2017 - 2030
- Figure 19:
- DISTANCE TRAVELLED BY REVENUE PASSENGERS BY COUNTRY, RPK, NORTH AMERICA, 2017 - 2030
- Figure 20:
- DISTANCE TRAVELLED BY REVENUE PASSENGERS BY COUNTRY, RPK, SOUTH AMERICA, 2017 - 2030
- Figure 21:
- INFLATION RATE, %, ASIA-PACIFIC, 2017 - 2030
- Figure 22:
- INFLATION RATE, %, EUROPE, 2017 - 2030
- Figure 23:
- INFLATION RATE, %, MIDDLE EAST AND AFRICA, 2017 - 2030
- Figure 24:
- INFLATION RATE, %, NORTH AMERICA, 2017 - 2030
- Figure 25:
- INFLATION RATE, %, SOUTH AMERICA, 2017 - 2030
- Figure 26:
- NUMBER OF NEW AIRCRAFT DELIVERIES, VOLUME, GLOBAL, 2017 - 2030
- Figure 27:
- NUMBER OF NEW AIRCRAFT DELIVERIES, USD, GLOBAL, 2017 - 2030
- Figure 28:
- COMMERCIAL AVIATION DELIVERIES BY SUB AIRCRAFT TYPE, VOLUME, GLOBAL, 2017 - 2030
- Figure 29:
- COMMERCIAL AVIATION DELIVERIES BY SUB AIRCRAFT TYPE, USD, GLOBAL, 2017 - 2030
- Figure 30:
- COMMERCIAL AVIATION DELIVERIES BY SUB AIRCRAFT TYPE, VOLUME %, GLOBAL, 2017 VS 2023 VS 2030
- Figure 31:
- COMMERCIAL AVIATION DELIVERIES BY SUB AIRCRAFT TYPE, VALUE %, GLOBAL, 2017 VS 2023 VS 2030
- Figure 32:
- GLOBAL COMMERCIAL AVIATION MARKET, BY FREIGHTER AIRCRAFT, UNITS, 2017 - 2030
- Figure 33:
- GLOBAL COMMERCIAL AVIATION MARKET, BY FREIGHTER AIRCRAFT, USD, 2017 - 2030
- Figure 34:
- GLOBAL COMMERCIAL AVIATION MARKET, BY SUB AIRCRAFT TYPE, USD, %, 2023 VS 2030
- Figure 35:
- PASSENGER AIRCRAFT DELIVERIES BY BODY TYPE, VOLUME, GLOBAL, 2017 - 2030
- Figure 36:
- PASSENGER AIRCRAFT DELIVERIES BY BODY TYPE, USD, GLOBAL, 2017 - 2030
- Figure 37:
- PASSENGER AIRCRAFT DELIVERIES BY BODY TYPE, VOLUME %, GLOBAL, 2017 VS 2023 VS 2030
- Figure 38:
- PASSENGER AIRCRAFT DELIVERIES BY BODY TYPE, VALUE %, GLOBAL, 2017 VS 2023 VS 2030
- Figure 39:
- GLOBAL COMMERCIAL AVIATION MARKET, BY NARROWBODY AIRCRAFT, UNITS, 2017 - 2030
- Figure 40:
- GLOBAL COMMERCIAL AVIATION MARKET, BY NARROWBODY AIRCRAFT, USD, 2017 - 2030
- Figure 41:
- GLOBAL COMMERCIAL AVIATION MARKET, BY BODY TYPE, USD, %, 2023 VS 2030
- Figure 42:
- GLOBAL COMMERCIAL AVIATION MARKET, BY WIDEBODY AIRCRAFT, UNITS, 2017 - 2030
- Figure 43:
- GLOBAL COMMERCIAL AVIATION MARKET, BY WIDEBODY AIRCRAFT, USD, 2017 - 2030
- Figure 44:
- GLOBAL COMMERCIAL AVIATION MARKET, BY BODY TYPE, USD, %, 2023 VS 2030
- Figure 45:
- COMMERCIAL AVIATION DELIVERIES BY REGION, VOLUME, GLOBAL, 2017 - 2030
- Figure 46:
- COMMERCIAL AVIATION DELIVERIES BY REGION, USD, GLOBAL, 2017 - 2030
- Figure 47:
- COMMERCIAL AVIATION DELIVERIES BY REGION, VOLUME %, GLOBAL, 2017 VS 2023 VS 2030
- Figure 48:
- COMMERCIAL AVIATION DELIVERIES BY REGION, VALUE %, GLOBAL, 2017 VS 2023 VS 2030
- Figure 49:
- COMMERCIAL AVIATION DELIVERIES BY COUNTRY, VOLUME, ASIA-PACIFIC, 2017 - 2030
- Figure 50:
- COMMERCIAL AVIATION DELIVERIES BY COUNTRY, USD, ASIA-PACIFIC, 2017 - 2030
- Figure 51:
- COMMERCIAL AVIATION DELIVERIES BY COUNTRY, VOLUME %, ASIA-PACIFIC, 2017 VS 2023 VS 2030
- Figure 52:
- COMMERCIAL AVIATION DELIVERIES BY COUNTRY, VALUE %, ASIA-PACIFIC, 2017 VS 2023 VS 2030
- Figure 53:
- GLOBAL COMMERCIAL AVIATION MARKET, BY AUSTRALIA, UNITS, 2017 - 2030
- Figure 54:
- GLOBAL COMMERCIAL AVIATION MARKET, BY AUSTRALIA, USD, 2017 - 2030
- Figure 55:
- COMMERCIAL AVIATION DELIVERIES SHARE, VALUE, %, AUSTRALIA, 2023 VS 2030
- Figure 56:
- GLOBAL COMMERCIAL AVIATION MARKET, BY CHINA, UNITS, 2017 - 2030
- Figure 57:
- GLOBAL COMMERCIAL AVIATION MARKET, BY CHINA, USD, 2017 - 2030
- Figure 58:
- COMMERCIAL AVIATION DELIVERIES SHARE, VALUE, %, CHINA, 2023 VS 2030
- Figure 59:
- GLOBAL COMMERCIAL AVIATION MARKET, BY INDIA, UNITS, 2017 - 2030
- Figure 60:
- GLOBAL COMMERCIAL AVIATION MARKET, BY INDIA, USD, 2017 - 2030
- Figure 61:
- COMMERCIAL AVIATION DELIVERIES SHARE, VALUE, %, INDIA, 2023 VS 2030
- Figure 62:
- GLOBAL COMMERCIAL AVIATION MARKET, BY INDONESIA, UNITS, 2017 - 2030
- Figure 63:
- GLOBAL COMMERCIAL AVIATION MARKET, BY INDONESIA, USD, 2017 - 2030
- Figure 64:
- COMMERCIAL AVIATION DELIVERIES SHARE, VALUE, %, INDONESIA, 2023 VS 2030
- Figure 65:
- GLOBAL COMMERCIAL AVIATION MARKET, BY JAPAN, UNITS, 2017 - 2030
- Figure 66:
- GLOBAL COMMERCIAL AVIATION MARKET, BY JAPAN, USD, 2017 - 2030
- Figure 67:
- COMMERCIAL AVIATION DELIVERIES SHARE, VALUE, %, JAPAN, 2023 VS 2030
- Figure 68:
- GLOBAL COMMERCIAL AVIATION MARKET, BY MALAYSIA, UNITS, 2017 - 2030
- Figure 69:
- GLOBAL COMMERCIAL AVIATION MARKET, BY MALAYSIA, USD, 2017 - 2030
- Figure 70:
- COMMERCIAL AVIATION DELIVERIES SHARE, VALUE, %, MALAYSIA, 2023 VS 2030
- Figure 71:
- GLOBAL COMMERCIAL AVIATION MARKET, BY PHILIPPINES, UNITS, 2017 - 2030
- Figure 72:
- GLOBAL COMMERCIAL AVIATION MARKET, BY PHILIPPINES, USD, 2017 - 2030
- Figure 73:
- COMMERCIAL AVIATION DELIVERIES SHARE, VALUE, %, PHILIPPINES, 2023 VS 2030
- Figure 74:
- GLOBAL COMMERCIAL AVIATION MARKET, BY SINGAPORE, UNITS, 2017 - 2030
- Figure 75:
- GLOBAL COMMERCIAL AVIATION MARKET, BY SINGAPORE, USD, 2017 - 2030
- Figure 76:
- COMMERCIAL AVIATION DELIVERIES SHARE, VALUE, %, SINGAPORE, 2023 VS 2030
- Figure 77:
- GLOBAL COMMERCIAL AVIATION MARKET, BY SOUTH KOREA, UNITS, 2017 - 2030
- Figure 78:
- GLOBAL COMMERCIAL AVIATION MARKET, BY SOUTH KOREA, USD, 2017 - 2030
- Figure 79:
- COMMERCIAL AVIATION DELIVERIES SHARE, VALUE, %, SOUTH KOREA, 2023 VS 2030
- Figure 80:
- GLOBAL COMMERCIAL AVIATION MARKET, BY THAILAND, UNITS, 2017 - 2030
- Figure 81:
- GLOBAL COMMERCIAL AVIATION MARKET, BY THAILAND, USD, 2017 - 2030
- Figure 82:
- COMMERCIAL AVIATION DELIVERIES SHARE, VALUE, %, THAILAND, 2023 VS 2030
- Figure 83:
- GLOBAL COMMERCIAL AVIATION MARKET, BY REST OF ASIA-PACIFIC, UNITS, 2017 - 2030
- Figure 84:
- GLOBAL COMMERCIAL AVIATION MARKET, BY REST OF ASIA-PACIFIC, USD, 2017 - 2030
- Figure 85:
- COMMERCIAL AVIATION DELIVERIES SHARE, VALUE, %, REST OF ASIA-PACIFIC, 2023 VS 2030
- Figure 86:
- COMMERCIAL AVIATION DELIVERIES BY COUNTRY, VOLUME, EUROPE, 2017 - 2030
- Figure 87:
- COMMERCIAL AVIATION DELIVERIES BY COUNTRY, USD, EUROPE, 2017 - 2030
- Figure 88:
- COMMERCIAL AVIATION DELIVERIES BY COUNTRY, VOLUME %, EUROPE, 2017 VS 2023 VS 2030
- Figure 89:
- COMMERCIAL AVIATION DELIVERIES BY COUNTRY, VALUE %, EUROPE, 2017 VS 2023 VS 2030
- Figure 90:
- GLOBAL COMMERCIAL AVIATION MARKET, BY FRANCE, UNITS, 2017 - 2030
- Figure 91:
- GLOBAL COMMERCIAL AVIATION MARKET, BY FRANCE, USD, 2017 - 2030
- Figure 92:
- COMMERCIAL AVIATION DELIVERIES SHARE, VALUE, %, FRANCE, 2023 VS 2030
- Figure 93:
- GLOBAL COMMERCIAL AVIATION MARKET, BY GERMANY, UNITS, 2017 - 2030
- Figure 94:
- GLOBAL COMMERCIAL AVIATION MARKET, BY GERMANY, USD, 2017 - 2030
- Figure 95:
- COMMERCIAL AVIATION DELIVERIES SHARE, VALUE, %, GERMANY, 2023 VS 2030
- Figure 96:
- GLOBAL COMMERCIAL AVIATION MARKET, BY ITALY, UNITS, 2017 - 2030
- Figure 97:
- GLOBAL COMMERCIAL AVIATION MARKET, BY ITALY, USD, 2017 - 2030
- Figure 98:
- COMMERCIAL AVIATION DELIVERIES SHARE, VALUE, %, ITALY, 2023 VS 2030
- Figure 99:
- GLOBAL COMMERCIAL AVIATION MARKET, BY NETHERLANDS, UNITS, 2017 - 2030
- Figure 100:
- GLOBAL COMMERCIAL AVIATION MARKET, BY NETHERLANDS, USD, 2017 - 2030
- Figure 101:
- COMMERCIAL AVIATION DELIVERIES SHARE, VALUE, %, NETHERLANDS, 2023 VS 2030
- Figure 102:
- GLOBAL COMMERCIAL AVIATION MARKET, BY RUSSIA, UNITS, 2017 - 2030
- Figure 103:
- GLOBAL COMMERCIAL AVIATION MARKET, BY RUSSIA, USD, 2017 - 2030
- Figure 104:
- COMMERCIAL AVIATION DELIVERIES SHARE, VALUE, %, RUSSIA, 2023 VS 2030
- Figure 105:
- GLOBAL COMMERCIAL AVIATION MARKET, BY SPAIN, UNITS, 2017 - 2030
- Figure 106:
- GLOBAL COMMERCIAL AVIATION MARKET, BY SPAIN, USD, 2017 - 2030
- Figure 107:
- COMMERCIAL AVIATION DELIVERIES SHARE, VALUE, %, SPAIN, 2023 VS 2030
- Figure 108:
- GLOBAL COMMERCIAL AVIATION MARKET, BY TURKEY, UNITS, 2017 - 2030
- Figure 109:
- GLOBAL COMMERCIAL AVIATION MARKET, BY TURKEY, USD, 2017 - 2030
- Figure 110:
- COMMERCIAL AVIATION DELIVERIES SHARE, VALUE, %, TURKEY, 2023 VS 2030
- Figure 111:
- GLOBAL COMMERCIAL AVIATION MARKET, BY UK, UNITS, 2017 - 2030
- Figure 112:
- GLOBAL COMMERCIAL AVIATION MARKET, BY UK, USD, 2017 - 2030
- Figure 113:
- COMMERCIAL AVIATION DELIVERIES SHARE, VALUE, %, UK, 2023 VS 2030
- Figure 114:
- GLOBAL COMMERCIAL AVIATION MARKET, BY REST OF EUROPE, UNITS, 2017 - 2030
- Figure 115:
- GLOBAL COMMERCIAL AVIATION MARKET, BY REST OF EUROPE, USD, 2017 - 2030
- Figure 116:
- COMMERCIAL AVIATION DELIVERIES SHARE, VALUE, %, REST OF EUROPE, 2023 VS 2030
- Figure 117:
- COMMERCIAL AVIATION DELIVERIES BY COUNTRY, VOLUME, MIDDLE EAST AND AFRICA, 2017 - 2030
- Figure 118:
- COMMERCIAL AVIATION DELIVERIES BY COUNTRY, USD, MIDDLE EAST AND AFRICA, 2017 - 2030
- Figure 119:
- COMMERCIAL AVIATION DELIVERIES BY COUNTRY, VOLUME %, MIDDLE EAST AND AFRICA, 2017 VS 2023 VS 2030
- Figure 120:
- COMMERCIAL AVIATION DELIVERIES BY COUNTRY, VALUE %, MIDDLE EAST AND AFRICA, 2017 VS 2023 VS 2030
- Figure 121:
- GLOBAL COMMERCIAL AVIATION MARKET, BY ALGERIA, UNITS, 2017 - 2030
- Figure 122:
- GLOBAL COMMERCIAL AVIATION MARKET, BY ALGERIA, USD, 2017 - 2030
- Figure 123:
- COMMERCIAL AVIATION DELIVERIES SHARE, VALUE, %, ALGERIA, 2023 VS 2030
- Figure 124:
- GLOBAL COMMERCIAL AVIATION MARKET, BY EGYPT, UNITS, 2017 - 2030
- Figure 125:
- GLOBAL COMMERCIAL AVIATION MARKET, BY EGYPT, USD, 2017 - 2030
- Figure 126:
- COMMERCIAL AVIATION DELIVERIES SHARE, VALUE, %, EGYPT, 2023 VS 2030
- Figure 127:
- GLOBAL COMMERCIAL AVIATION MARKET, BY QATAR, UNITS, 2017 - 2030
- Figure 128:
- GLOBAL COMMERCIAL AVIATION MARKET, BY QATAR, USD, 2017 - 2030
- Figure 129:
- COMMERCIAL AVIATION DELIVERIES SHARE, VALUE, %, QATAR, 2023 VS 2030
- Figure 130:
- GLOBAL COMMERCIAL AVIATION MARKET, BY SAUDI ARABIA, UNITS, 2017 - 2030
- Figure 131:
- GLOBAL COMMERCIAL AVIATION MARKET, BY SAUDI ARABIA, USD, 2017 - 2030
- Figure 132:
- COMMERCIAL AVIATION DELIVERIES SHARE, VALUE, %, SAUDI ARABIA, 2023 VS 2030
- Figure 133:
- GLOBAL COMMERCIAL AVIATION MARKET, BY SOUTH AFRICA, UNITS, 2017 - 2030
- Figure 134:
- GLOBAL COMMERCIAL AVIATION MARKET, BY SOUTH AFRICA, USD, 2017 - 2030
- Figure 135:
- COMMERCIAL AVIATION DELIVERIES SHARE, VALUE, %, SOUTH AFRICA, 2023 VS 2030
- Figure 136:
- GLOBAL COMMERCIAL AVIATION MARKET, BY UNITED ARAB EMIRATES, UNITS, 2017 - 2030
- Figure 137:
- GLOBAL COMMERCIAL AVIATION MARKET, BY UNITED ARAB EMIRATES, USD, 2017 - 2030
- Figure 138:
- COMMERCIAL AVIATION DELIVERIES SHARE, VALUE, %, UNITED ARAB EMIRATES, 2023 VS 2030
- Figure 139:
- GLOBAL COMMERCIAL AVIATION MARKET, BY REST OF MIDDLE EAST AND AFRICA, UNITS, 2017 - 2030
- Figure 140:
- GLOBAL COMMERCIAL AVIATION MARKET, BY REST OF MIDDLE EAST AND AFRICA, USD, 2017 - 2030
- Figure 141:
- COMMERCIAL AVIATION DELIVERIES SHARE, VALUE, %, REST OF MIDDLE EAST AND AFRICA, 2023 VS 2030
- Figure 142:
- COMMERCIAL AVIATION DELIVERIES BY COUNTRY, VOLUME, NORTH AMERICA, 2017 - 2030
- Figure 143:
- COMMERCIAL AVIATION DELIVERIES BY COUNTRY, USD, NORTH AMERICA, 2017 - 2030
- Figure 144:
- COMMERCIAL AVIATION DELIVERIES BY COUNTRY, VOLUME %, NORTH AMERICA, 2017 VS 2023 VS 2030
- Figure 145:
- COMMERCIAL AVIATION DELIVERIES BY COUNTRY, VALUE %, NORTH AMERICA, 2017 VS 2023 VS 2030
- Figure 146:
- GLOBAL COMMERCIAL AVIATION MARKET, BY CANADA, UNITS, 2017 - 2030
- Figure 147:
- GLOBAL COMMERCIAL AVIATION MARKET, BY CANADA, USD, 2017 - 2030
- Figure 148:
- COMMERCIAL AVIATION DELIVERIES SHARE, VALUE, %, CANADA, 2023 VS 2030
- Figure 149:
- GLOBAL COMMERCIAL AVIATION MARKET, BY MEXICO, UNITS, 2017 - 2030
- Figure 150:
- GLOBAL COMMERCIAL AVIATION MARKET, BY MEXICO, USD, 2017 - 2030
- Figure 151:
- COMMERCIAL AVIATION DELIVERIES SHARE, VALUE, %, MEXICO, 2023 VS 2030
- Figure 152:
- GLOBAL COMMERCIAL AVIATION MARKET, BY UNITED STATES, UNITS, 2017 - 2030
- Figure 153:
- GLOBAL COMMERCIAL AVIATION MARKET, BY UNITED STATES, USD, 2017 - 2030
- Figure 154:
- COMMERCIAL AVIATION DELIVERIES SHARE, VALUE, %, UNITED STATES, 2023 VS 2030
- Figure 155:
- GLOBAL COMMERCIAL AVIATION MARKET, BY REST OF NORTH AMERICA, UNITS, 2017 - 2030
- Figure 156:
- GLOBAL COMMERCIAL AVIATION MARKET, BY REST OF NORTH AMERICA, USD, 2017 - 2030
- Figure 157:
- COMMERCIAL AVIATION DELIVERIES SHARE, VALUE, %, REST OF NORTH AMERICA, 2023 VS 2030
- Figure 158:
- COMMERCIAL AVIATION DELIVERIES BY COUNTRY, VOLUME, SOUTH AMERICA, 2017 - 2030
- Figure 159:
- COMMERCIAL AVIATION DELIVERIES BY COUNTRY, USD, SOUTH AMERICA, 2017 - 2030
- Figure 160:
- COMMERCIAL AVIATION DELIVERIES BY COUNTRY, VOLUME %, SOUTH AMERICA, 2017 VS 2023 VS 2030
- Figure 161:
- COMMERCIAL AVIATION DELIVERIES BY COUNTRY, VALUE %, SOUTH AMERICA, 2017 VS 2023 VS 2030
- Figure 162:
- GLOBAL COMMERCIAL AVIATION MARKET, BY BRAZIL, UNITS, 2017 - 2030
- Figure 163:
- GLOBAL COMMERCIAL AVIATION MARKET, BY BRAZIL, USD, 2017 - 2030
- Figure 164:
- COMMERCIAL AVIATION DELIVERIES SHARE, VALUE, %, BRAZIL, 2023 VS 2030
- Figure 165:
- GLOBAL COMMERCIAL AVIATION MARKET, BY CHILE, UNITS, 2017 - 2030
- Figure 166:
- GLOBAL COMMERCIAL AVIATION MARKET, BY CHILE, USD, 2017 - 2030
- Figure 167:
- COMMERCIAL AVIATION DELIVERIES SHARE, VALUE, %, CHILE, 2023 VS 2030
- Figure 168:
- GLOBAL COMMERCIAL AVIATION MARKET, BY COLOMBIA, UNITS, 2017 - 2030
- Figure 169:
- GLOBAL COMMERCIAL AVIATION MARKET, BY COLOMBIA, USD, 2017 - 2030
- Figure 170:
- COMMERCIAL AVIATION DELIVERIES SHARE, VALUE, %, COLOMBIA, 2023 VS 2030
- Figure 171:
- GLOBAL COMMERCIAL AVIATION MARKET, BY REST OF SOUTH AMERICA, UNITS, 2017 - 2030
- Figure 172:
- GLOBAL COMMERCIAL AVIATION MARKET, BY REST OF SOUTH AMERICA, USD, 2017 - 2030
- Figure 173:
- COMMERCIAL AVIATION DELIVERIES SHARE, VALUE, %, REST OF SOUTH AMERICA, 2023 VS 2030
- Figure 174:
- MOST ACTIVE COMPANIES, NUMBER OF STRATEGIC MOVES, GLOBAL, 2018-2023
- Figure 175:
- MOST ADOPTED STRATEGIES, COUNT, GLOBAL, 2018 - 2023
- Figure 176:
- MAJOR PLAYERS REVENUE SHARE (%), GLOBAL
Commercial Aviation Industry Segmentation
Freighter Aircraft, Passenger Aircraft are covered as segments by Sub Aircraft Type. Asia-Pacific, Europe, Middle East and Africa, North America, South America are covered as segments by Region.| Sub Aircraft Type | Freighter Aircraft | ||
| Passenger Aircraft | Narrowbody Aircraft | ||
| Widebody Aircraft | |||
| Region | Asia-Pacific | Australia | |
| China | |||
| India | |||
| Indonesia | |||
| Japan | |||
| Malaysia | |||
| Philippines | |||
| Singapore | |||
| South Korea | |||
| Thailand | |||
| Rest of Asia-Pacific | |||
| Europe | France | ||
| Germany | |||
| Italy | |||
| Netherlands | |||
| Russia | |||
| Spain | |||
| Turkey | |||
| UK | |||
| Rest of Europe | |||
| Middle East and Africa | Algeria | ||
| Egypt | |||
| Qatar | |||
| Saudi Arabia | |||
| South Africa | |||
| United Arab Emirates | |||
| Rest of Middle East and Africa | |||
| North America | Canada | ||
| Mexico | |||
| United States | |||
| Rest of North America | |||
| South America | Brazil | ||
| Chile | |||
| Colombia | |||
| Rest of South America | |||
Need A Different Region or Segment?
Customize Now
Market Definition
- Aircraft Type - Commercial Aviation includes aircraft used to haul passengers and freight on a scheduled basis between selected airports.
- Sub-Aircraft Type - Fixed-Wing passenger aircraft and freighter aircraft operated by airlines and adapted for carrying passengers and cargo are considered under the study.
- Body Type - Narrowbody and widebody aircraft which are single aisle and twin aisle are included under this study.
| Keyword | Definition |
|---|---|
| IATA | IATA stands for the International Air Transport Association, a trade organization composed of airlines around the world that has an influence over the commercial aspects of flight. |
| ICAO | ICAO stands for International Civil Aviation Organization, a specialized agency of the United Nations that supports aviation and navigation around the globe. |
| Air Operator Certificate (AOC) | A certificate granted by a National Aviation Authority permitting the conduct of commercial flying activities. |
| Certificate Of Airworthiness (CoA) | A Certificate Of Airworthiness (CoA) is issued for an aircraft by the civil aviation authority in the state in which the aircraft is registered. |
| Gross Domestic Product (GDP) | Gross domestic product (GDP) is a monetary measure of the market value of all the final goods and services produced in a specific time period by countries. |
| RPK (Revenue Passenger Kilometres) | The RPK of an airline is the sum of the products obtained by multiplying the number of revenue passengers carried on each flight stage by the stage distance - it is the total number of kilometers traveled by all revenue passengers. |
| Load Factor | The load factor is a metric used in the airline industry that measures the percentage of available seating capacity that has been filled with passengers. |
| Original Equipment Manufacturer (OEM) | An original equipment manufacturer (OEM) traditionally is defined as a company whose goods are used as components in the products of another company, which then sells the finished item to users. |
| International Transportation Safety Association (ITSA) | International Transportation Safety Association (ITSA) is an international network of heads of independent safety investigation authorities (SIA). |
| Available Seats Kilometre (ASK) | This metric is calculated by multiplying Available Seats (AS) in one flight, defined above, multiplied by the distance flown. |
| Gross Weight | The fully-loaded weight of an aircraft, also known as “takeoff weight,” which includes the combined weight of passengers, cargo, and fuel. |
| Airworthiness | The ability of an aircraft, or other airborne equipment or system, to operate in flight and on the ground without significant hazard to aircrew, ground crew, passengers or to other third parties. |
| Airworthiness Standards | Detailed and comprehensive design and safety criteria applicable to the category of aeronautical product (aircraft, engine or propeller). |
| Fixed Base Operator (FBO) | A business or organization that operates at an airport. An FBO provides aircraft operating services like maintenance, fueling, flight training, charter services, hangaring, and parking. |
| High Net worth Individuals (HNWIs) | High Net worth Individuals (HNWIs) are individuals with over USD 1 million in liquid financial assets. |
| Ultra High Net worth Individuals (UHNWIs) | Ultra High Net worth Individuals (UHNWIs) are individuals with over USD 30 million in liquid financial assets. |
| Federal Aviation Administration (FAA) | The division of the Department of Transportation is concerned with aviation. It operates Air Traffic Control and regulates everything from aircraft manufacturing to pilot training to airport operations in the United States. |
| EASA (European Aviation Safety Agency) | The European Aviation Safety Agency is a European Union agency established in 2002 with the task of overseeing civil aviation safety and regulation. |
| Airborne Warning and Control System (AW&C) aircraft | Airborne Warning and Control System (AEW&C) aircraft is equipped with a powerful radar and on-board command and control center to direct the armed forces. |
| The North Atlantic Treaty Organization (NATO) | The North Atlantic Treaty Organization (NATO), also called the North Atlantic Alliance, is an intergovernmental military alliance between 30 member states – 28 European and two North American. |
| Joint Strike Fighter (JSF) | Joint Strike Fighter (JSF) is a development and acquisition program intended to replace a wide range of existing fighter, strike, and ground attack aircraft for the United States, the United Kingdom, Italy, Canada, Australia, the Netherlands, Denmark, Norway, and formerly Turkey. |
| Light Combat Aircraft (LCA) | A light combat aircraft (LCA) is a light, multirole jet/turboprop military aircraft, commonly derived from advanced trainer designs, designed for engaging in light combat. |
| Stockholm International Peace Research Institute (SIPRI) | Stockholm International Peace Research Institute (SIPRI) is an international institute that provides data, analysis, and recommendations for armed conflict, military expenditure, and arms trade as well as disarmament and arms control. |
| Maritime Patrol Aircraft (MPA) | A maritime patrol aircraft (MPA), also known as maritime reconnaissance aircraft is a fixed-wing aircraft designed to operate for long durations over water in maritime patrol roles, in particular, anti-submarine warfare (ASW), anti-ship warfare (AShW), and search and rescue (SAR). |
| Mach Number | The Mach number is defined as the ratio of true airspeed to the speed of sound at the altitude of a given aircraft. |
| Stealth Aircraft | Stealth is a Common term applied to low observable (LO) technology and doctrine, that makes an aircraft near invisible to radar, infrared or visual detection. |
Need More Details on Market Definition?
Ask a Question
Research Methodology
Mordor Intelligence follows a four-step methodology in all our reports.
- Step-1: Identify Key Variables: In order to build a robust forecasting methodology, the variables and factors identified in Step-1 are tested against available historical market numbers. Through an iterative process, the variables required for market forecast are set and the model is built on the basis of these variables.
- Step-2: Build a Market Model: Market-size estimations for the historical and forecast years have been provided in revenue and volume terms. For sales conversion to volume, the average selling price (ASP) is kept constant throughout the forecast period for each country, and inflation is not a part of the pricing.
- Step-3: Validate and Finalize: In this important step, all market numbers, variables and analyst calls are validated through an extensive network of primary research experts from the market studied. The respondents are selected across levels and functions to generate a holistic picture of the market studied.
- Step-4: Research Outputs: Syndicated Reports, Custom Consulting Assignments, Databases & Subscription Platforms

Get More Details On Research Methodology
Download PDF


