
Global Colorectal Cancer Therapeutics Market Size and Share
Market Overview
| Study Period | 2020 - 2031 |
|---|---|
| Market Size (2026) | USD 14.25 Billion |
| Market Size (2031) | USD 17.9 Billion |
| Growth Rate (2026 - 2031) | 4.67 % |
| Fastest Growing Market | Asia-Pacific |
| Largest Market | North America |
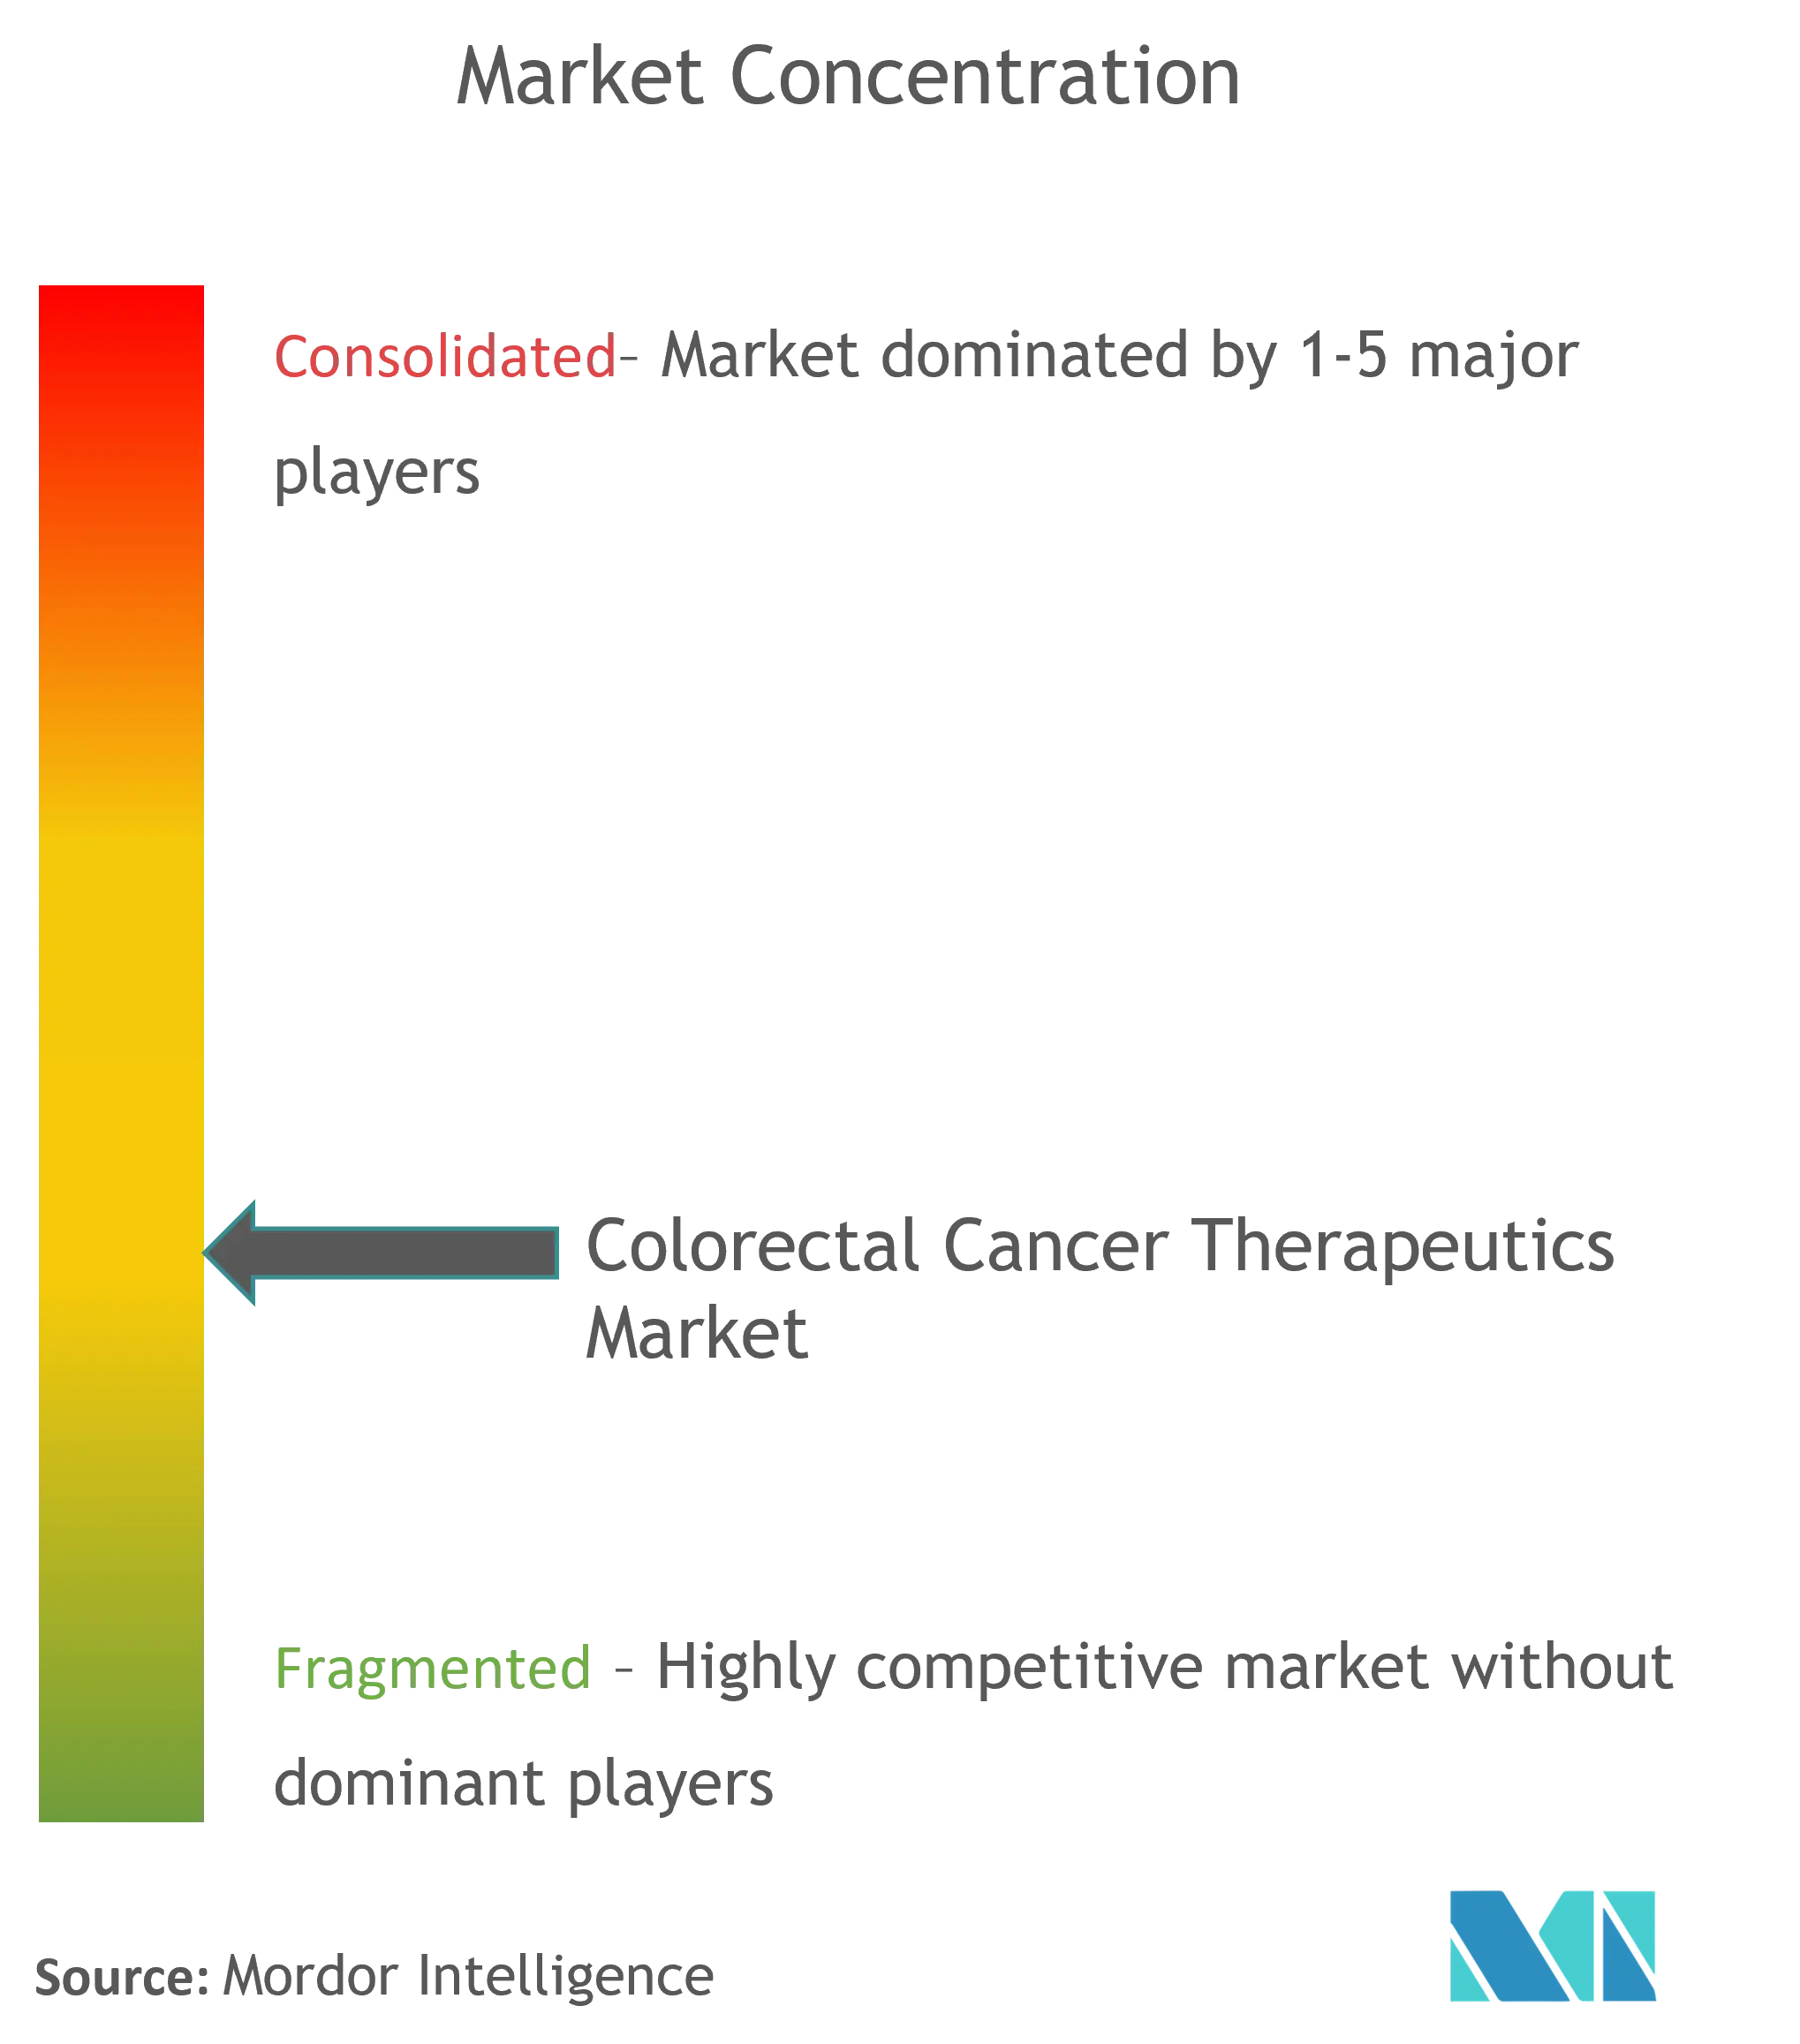
| Market Concentration | Medium |
Major Players *Disclaimer: Major Players sorted in no particular order Image © Mordor Intelligence. Reuse requires attribution under CC BY 4.0. | |
Global Colorectal Cancer Therapeutics Market Analysis by Mordor Intelligence
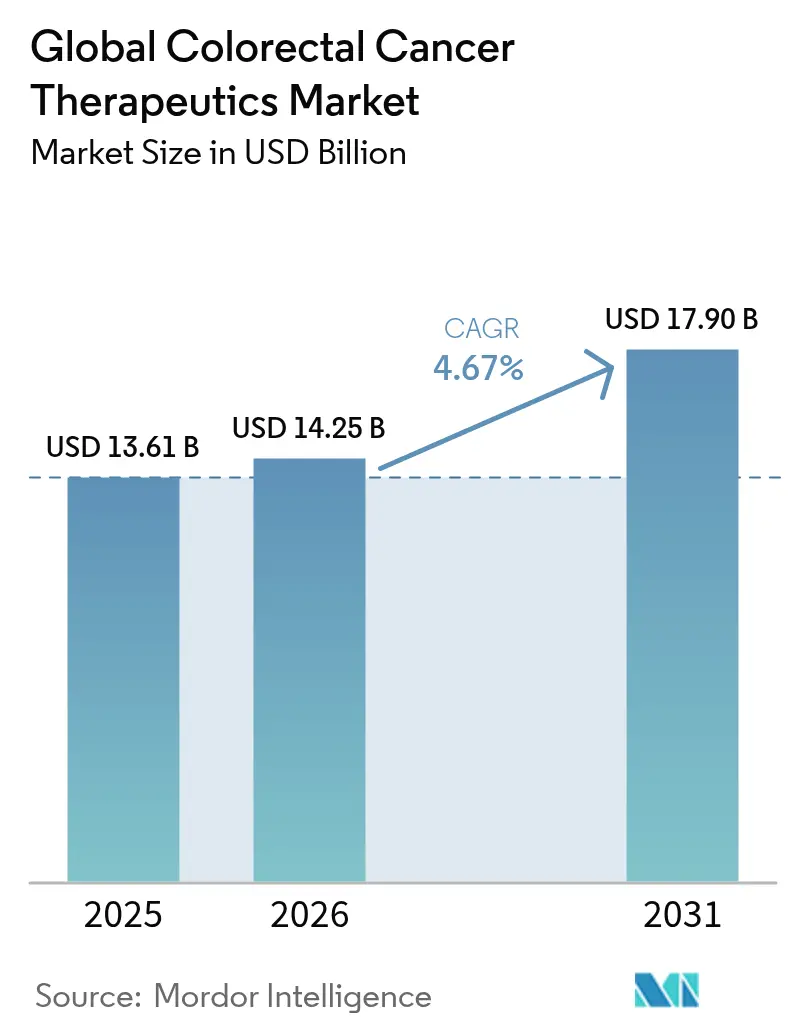
The colorectal cancer therapeutics market size is expected to grow from USD 13.61 billion in 2025 to USD 14.25 billion in 2026 and is forecast to reach USD 17.9 billion by 2031 at 4.67% CAGR over 2026-2031. Precision-medicine adoption, particularly companion-diagnostic-linked immunotherapies, is the primary engine of expansion within the colorectal cancer therapeutics market. Consolidated reimbursement pathways for biomarker-guided regimens and landmark regulatory approvals, such as dostarlimab in mismatch repair-deficient (dMMR) rectal cancer, are accelerating the pace at which new protocols replace conventional chemotherapy. Sustained oncology drug shortages for platinum backbones have inflated treatment costs, reinforcing payers’ willingness to shift toward more targeted options that promise lower overall resource utilization. Regionally, North America remains the largest contributor, while Asia Pacific delivers the fastest incremental demand as early-detection and screening programs expand.
Key Report Takeaways
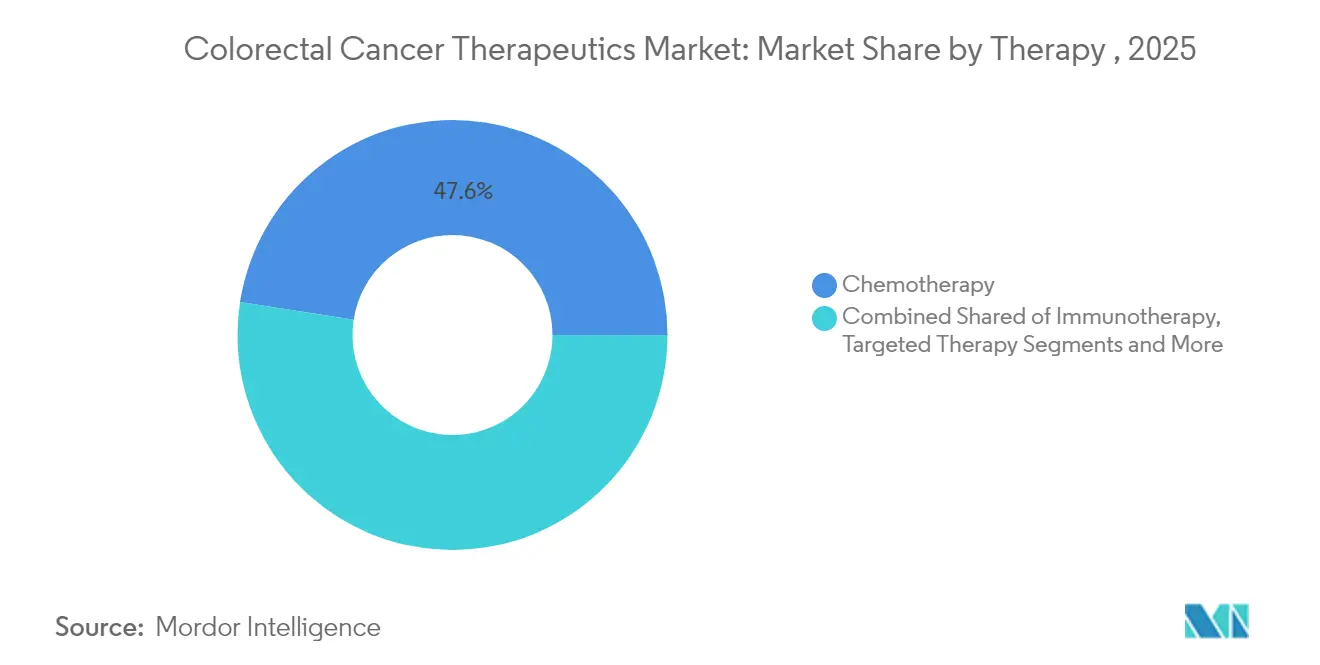
- By therapy, chemotherapy held 47.55% colorectal cancer therapeutics market share in 2025, whereas immunotherapy is projected to advance at a 14.21% CAGR through 2031.
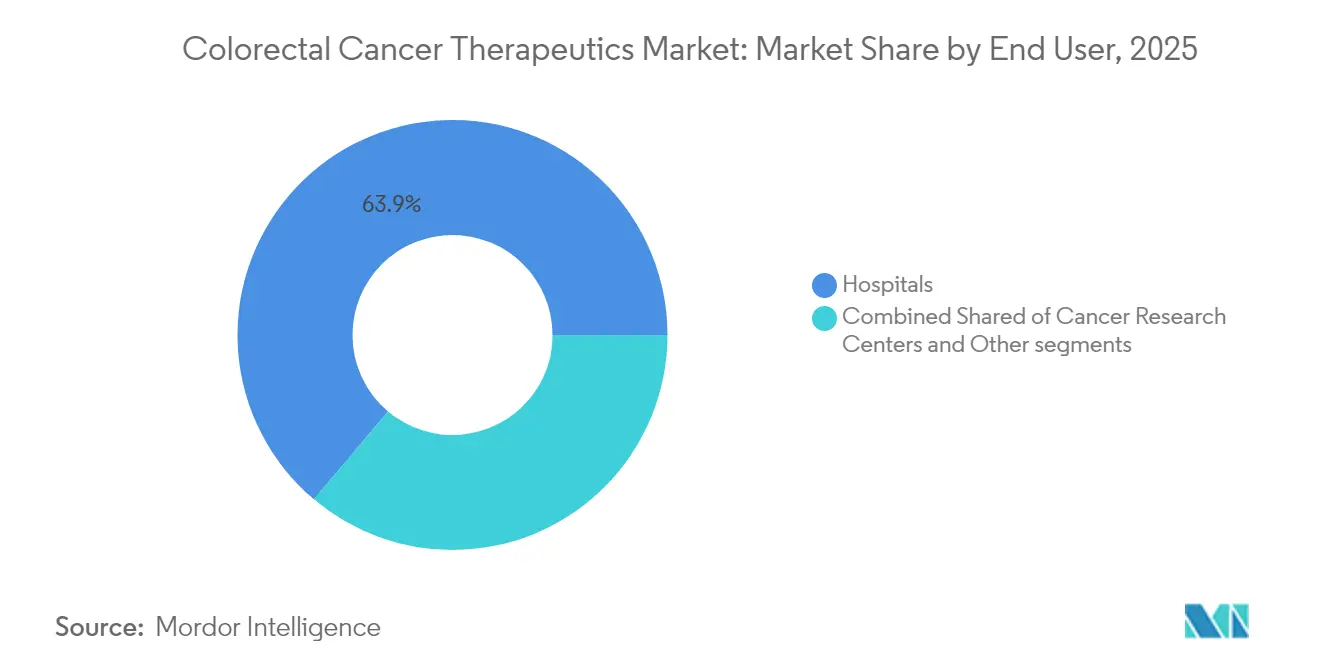
- By end user, hospitals commanded 63.85% revenue share of the colorectal cancer therapeutics market size in 2025; cancer research centers post the quickest growth at 9.78% CAGR through 2031.
- By geography, North America captured 42.35% colorectal cancer therapeutics market share in 2025, while Asia Pacific is poised to expand at a 9.46% CAGR to 2031.
Note: Market size and forecast figures in this report are generated using Mordor Intelligence’s proprietary estimation framework, updated with the latest available data and insights as of 2026.
Market Trends and Insights
Drivers Impact Analysis of Global Colorectal Cancer Therapeutics Market*
| Driver | (~) % Impact on CAGR Forecast | Geographic Relevance | Impact Timeline |
|---|---|---|---|
| Rising Incidence & Prevalence Of Colorectal Cancer | 1.20% | Global, with highest impact in Asia Pacific and emerging markets | Long term (≥ 4 years) |
| Breakthroughs In Targeted & Immune-Oncology Modalities | 1.80% | North America & EU leading, expanding to Asia Pacific | Medium term (2-4 years) |
| Expanded Reimbursement For Biomarker-Guided Therapies | 0.90% | North America & EU core, gradual expansion globally | Medium term (2-4 years) |
| Microbiome-Modulating Adjuvants Boosting Drug Response | 0.40% | North America & EU research centers, early commercial adoption | Long term (≥ 4 years) |
| AI-Enabled Early Detection Accelerating Therapy Starts | 0.60% | Global, with faster adoption in developed markets | Short term (≤ 2 years) |
| Biosimilar MAbs Price-Led Adoption In Emerging Markets | 0.30% | Asia Pacific, Latin America, Middle East & Africa | Medium term (2-4 years) |
| Source: Mordor Intelligence | |||
Rising Incidence & Prevalence of Colorectal Cancer
Global incidence is projected to climb nearly 10% in men and 12% in women by 2040, while mortality could rise more than 25%. Asia already reports the highest age-standardized rate at 23.88 per 100,000 population, positioning the region as a vital future revenue pool.[1] Growth in the colorectal cancer therapeutics market aligns with government-led screening expansion, yet sizable populations remain unscreened, sustaining late-stage diagnoses and drug demand. Persistent lifestyle risk factors and aging demographics reinforce long-haul therapy volumes, anchoring the colorectal cancer therapeutics market to a durable patient base.
Breakthroughs in Targeted & Immune-Oncology Modalities
Nivolumab plus ipilimumab delivered 72% 24-month progression-free survival in dMMR metastatic disease versus 14% for chemotherapy. Dostarlimab monotherapy achieved a 100% clinical complete response in locally advanced dMMR rectal cancer, eliminating surgery for every treated patient in a pivotal trial. KRAS G12C regimens such as adagrasib plus cetuximab showed a 34% overall response in refractory settings.[2] These data are resetting treatment algorithms and maintaining premium pricing latitude, intensifying innovation cycles inside the colorectal cancer therapeutics market.
Expanded Reimbursement for Biomarker-Guided Therapies
CMS coverage of CT colonography from January 2025 and FDA-approved blood-based screening tests enlarge the eligible diagnostic funnel, driving earlier therapeutic intervention. EMA endorsement of fruquintinib with a 7.4-month survival benefit for heavily pre-treated patients further widens the therapeutic arsenal. As reference biologic prices fall by more than 30% once biosimilars enter, cost savings recycle into broader access for novel agents, a dynamic pivotal to the colorectal cancer therapeutics market.
Microbiome-Modulating Adjuvants Boosting Drug Response
Randomized studies show agents like PHY-906 can enhance irinotecan tolerance while reducing gastrointestinal toxicity, supporting the adoption of combination therapy. Companion microbiome diagnostics are emerging to triangulate responders, an avenue likely to spawn new corporate partnerships that grow the colorectal cancer therapeutics market over the long term.
Restraints Impact Analysis of Global Colorectal Cancer Therapeutics Market*
| Restraint | (~) % Impact on CAGR Forecast | Geographic Relevance | Impact Timeline |
|---|---|---|---|
| High Cost of Novel Biologics & IO Combinations | -1.10% | Global, with the highest impact on emerging markets and price-sensitive healthcare systems | Medium term (2-4 years) |
| Severe Toxicity & QoL Trade-Offs Limiting Compliance | -0.80% | Global, particularly affecting elderly populations and centers with limited supportive care infrastructure | Short term (≤ 2 years) |
| Narrow MSI-H Pool Curbing Checkpoint-Inhibitor Adoption | -0.60% | Global, with proportionally higher impact in regions with limited biomarker testing capabilities | Medium term (2-4 years) |
| API Supply-Chain Fragility for Key Chemo Agents | -0.40% | Global, with acute impact in regions dependent on single-source manufacturing | Short term (≤ 2 years) |
| Source: Mordor Intelligence | |||
High Cost of Novel Biologics & IO Combinations
Checkpoint regimens frequently exceed USD 100,000 annually, straining payer budgets in price-sensitive systems. Immune-mediated colitis affects up to 8.6% of treated patients, adding unplanned supportive-care outlays. Value-based contracting is gaining traction to align payment with outcomes, a trend that may temper near-term revenue growth for the colorectal cancer therapeutics market.
Severe Toxicity & QoL Trade-Offs Limiting Compliance
Immune-enterocolitis risk is highest with CTLA-4 inhibitors, pressing providers to invest in specialist management frameworks. Elderly individuals with comorbidities face higher discontinuation rates, muting utilization in a demographic that forms a growing share of the colorectal cancer therapeutics market patient pool.
*Our forecasts treat driver/restraint impacts as directional, not additive. The impact forecasts reflect baseline growth, mix effects, and variable interactions.
Global Colorectal Cancer Therapeutics Market Segment Analysis
By Therapy:
Immunotherapy Disrupts Traditional ParadigmsChemotherapy sustained a 47.55% colorectal cancer therapeutics market share in 2025, yet immunotherapy is set to capture outsized incremental value through a 14.21% CAGR to 2031. Dostarlimab’s 100% response in dMMR rectal cancer is emblematic of evidence rewriting practice guidelines. Targeted inhibitors such as sotorasib and adagrasib are broadening applicability beyond MSI-H tumors, translating biomarker discovery directly into revenue. The colorectal cancer therapeutics market size for immunotherapy is forecast to more than double by 2031 as combination protocols earn first-line status in biomarker-defined cohorts.
Pipeline breadth is now anchored in cell-based modalities and bispecific antibodies. GCC19CART recorded 40% objective responses in heavily pre-treated metastatic cases, illustrating how cellular immunotherapies could lift survival in microsatellite-stable disease. As assays for circulating tumor DNA sharpen minimal-residual-disease detection, adaptive dosing models will extend treatment duration, sustaining spending inside the colorectal cancer therapeutics market.

By End User:
Research Centers Drive Innovation AdoptionHospitals retained 63.85% of the 2025 revenue share, largely due to integrated surgery, radiation, and systemic care capacity. Nonetheless, clinical research institutions are expanding at a 9.78% CAGR, leveraging investigational access to new immuno-oncology regimens. The colorectal cancer therapeutics market size attached to research centers is projected to surpass USD 4.22 billion by 2031 as global trial networks proliferate.
Drug shortages have prompted 43% of cancer centers to alter enrolment protocols, underscoring operational bottlenecks that shape drug-utilization timelines. Adoption of tele-oncology follow-up and outpatient infusion suits further reallocates volumes from tertiary hospitals to distributed settings, adding competitive tension among provider types inside the colorectal cancer therapeutics market.
Geography Analysis
North America Colorectal Cancer Therapeutics Market
North America accounted for 42.35% of 2025 revenue, supported by CMS coverage of advanced screenings and rapid FDA approvals that compress time from lab to clinic. Regional payers champion biomarker testing, embedding precision therapy into standard of care and reinforcing North American leadership within the colorectal cancer therapeutics market. Academic centers’ dense trial portfolios catalyze first-in-class uptake, turning the region into a launchpad for global rollouts.
APAC Colorectal Cancer Therapeutics Market
Asia Pacific is the fastest-growing territory with a 9.46% CAGR. Rising incidence, urbanization-linked risk factors, and stepwise healthcare investment fuel volume expansion. China’s updated colorectal guidelines mirror Western precision-medicine standards, an alignment expected to unlock multi-billion-dollar potential in the colorectal cancer therapeutics market. Yet screening penetration remains low; Thailand reports that 58.8% of eligible adults have never undergone a screening test, representing untapped demand for both diagnostics and therapies.
EMEA and South America Colorectal Cancer Therapeutics Market
Europe delivers steady growth underpinned by EMA approvals; 28 oncology products gained clearance in 2024, including fruquintinib’s progression-free survival advantage in refractory disease. Cost-containment frameworks encour-age biosimilar adoption, redistributing budgets toward high-innovation regimens. Meanwhile, Middle East & Africa and South America build capacity through public-private partnerships that prioritize biosimilars and essential medicines, gradually enlarging their presence in the colorectal cancer therapeutics market.
Regulatory Landscape
Regulatory momentum is increasingly centered on biomarker-defined regimens, with 2026 actions expanding access to first-line targeted combinations in metastatic disease. In February 2026, the US FDA granted full approval to Pfizer's Braftovi (encorafenib) in combination with cetuximab (Erbitux) and fluorouracil-based chemotherapy for BRAF V600E-mutant metastatic colorectal cancer, while in May 2026 the EMA CHMP adopted a positive opinion extending Erbitux to include first-line use in combination with encorafenib and FOLFOX for the same biomarker-defined population.
Reimbursement and market-access decisions continue to shape regimen selection across major geographies. NICE published TA1136 in February 2026 recommending bevacizumab (originator and biosimilars) with fluoropyrimidine-based chemotherapy for metastatic colorectal cancer, reinforcing biosimilar-supported pathways in the United Kingdom. In the United States, CMS removed National Coverage Determination 110.17 effective February 25, 2026, signaling a shift away from trial-specific national coverage constructs toward standard coverage mechanisms; in India, CDSCO's oncology SEC (April 2026) recommended permission to manufacture and market bevacizumab for metastatic colorectal cancer subject to Phase IV commitments, supporting domestic supply while maintaining post-marketing oversight.
Competitive Landscape
The colorectal cancer therapeutics market displays moderate fragmentation. Five leading companies, led by Roche, Pfizer, and Bristol Myers Squibb, collectively control significant market share. Their positions are reinforced through portfolio breadth across both chemo backbones and immunotherapy flagships. Biosimilar erosion pressures chemotherapy revenues, but manufacturers recoup via licensed combination packages and companion diagnostics.
Strategic alliances concentrate on codeveloping biomarker assays; Amgen and Guardant Health, for example, advance KRAS G12C testing synchronized with sotorasib rollouts. White-space ambitions focus on microsatellite-stable disease where CAR-T constructs, bispecific antibodies, and oncolytic viruses are vying for first-mover advantage. Rapid artificial-intelligence integration into image-analysis pipelines is becoming a differentiator, shortening trial timelines and improving responder selection, thereby sharpening competitiveness throughout the colorectal cancer therapeutics market.
Mergers remain targeted rather than transformational. Transactions emphasize platform synergies—drug-antibody conjugate capabilities or microbiome diagnostics—over scale buying. In-licensing of mid-phase assets allows big pharma to hedge pipeline risk while niche biotechs monetize validated mechanistic innovations, keeping deal flow buoyant in the colorectal cancer therapeutics industry.
Global Colorectal Cancer Therapeutics Industry Leaders
-
Bristol-Myers Squibb Company
-
Pfizer Inc
-
F. Hoffmann-La Roche Ltd
-
Bayer AG
-
Eli Lilly and Company
- *Disclaimer: Major Players sorted in no particular order
Global Colorectal Cancer Therapeutics Market Companies Covered in this Report
- Roche
- Pfizer
- Bayer
- Bristol-Myers Squibb
- Eli Lilly and Company
- Merck
- Amgen
- Takeda Pharmaceuticals
- Sanofi
- Teva Pharmaceutical Industries
- Regeneron Pharmaceuticals
- Genentech
- Merck
- Novartis
- Abbvie
- AstraZeneca
Read Analysis of Global Colorectal Cancer Therapeutics Companies
Market Opportunities and Future Outlook
Near-term whitespace is concentrated in expanding precision-therapy penetration beyond later lines by pairing validated biomarkers with earlier-line and adjuvant use cases. Regulatory actions in 2025-2026 broadened the commercial footprint for defined subgroups, including the FDA approval of Opdivo (nivolumab) plus Yervoy (ipilimumab) for first-line MSI-H/dMMR metastatic colorectal cancer (April 2025) and the FDA full approval of the Braftovi plus cetuximab plus fluorouracil-based chemotherapy regimen for BRAF V600E-mutant metastatic colorectal cancer (February 2026); in Europe, the European Commission approval for encorafenib in combination with cetuximab and FOLFOX for first-line BRAF V600E-mutant metastatic colorectal cancer (June 2026) underscores a shift toward regimen-specific, mutation-defined standards.
Pipeline and lifecycle activity highlights two opportunity lanes: adjuvant immunotherapy aimed at recurrence-risk reduction, and next-generation targeted payload platforms for refractory metastatic disease. Roche disclosed that the FDA accepted a supplemental BLA for adjuvant Tecentriq (atezolizumab) and Tecentriq Hybreza in combination with chemotherapy for stage III dMMR/MSI-H colon cancer under Priority Review, with a decision date of October 9, 2026, which supports movement into curative-intent settings where treatment durations, endpoints, and adoption economics differ from metastatic care. In metastatic colorectal cancer, Merck KGaA initiated the Phase 3 PROCEADE-CRC-03 trial (first patient dosed) evaluating the anti-CEACAM5 antibody-drug conjugate precemtabart tocentecan, reinforcing active investment in ADC approaches to address biomarker segments and resistance patterns not adequately served by current chemotherapy backbones and checkpoint inhibitors.
Recent Industry Developments in Global Colorectal Cancer Therapeutics Market
- June 2026: Roche (Genentech) announced the FDA accepted a supplemental BLA for adjuvant Tecentriq (atezolizumab) and Tecentriq Hybreza in combination with chemotherapy for stage III dMMR/MSI-H colon cancer and granted Priority Review with an action date of October 9, 2026. The filing moves immunotherapy further into earlier-stage, curative-intent treatment pathways, expanding the addressable setting beyond metastatic use.
- February 2026: Pfizer reported the US FDA granted full approval to Braftovi (encorafenib) in combination with cetuximab (Erbitux) and fluorouracil-based chemotherapy for adult patients with BRAF V600E-mutant metastatic colorectal cancer. This converts the regimen into a more durable standard option in a mutation-defined segment and strengthens competitive positioning for first-line targeted combinations.
- April 2025: The US FDA approved Bristol Myers Squibb's Opdivo (nivolumab) plus Yervoy (ipilimumab) for patients with previously untreated MSI-H/dMMR unresectable or metastatic colorectal cancer. The decision reinforces checkpoint inhibitor combinations in first-line care for biomarker-selected patients and raises the clinical importance of routine MSI/dMMR testing to guide prescribing.
Global Colorectal Cancer Therapeutics Market Report Scope and Research Methodology
Market Definition and Coverage
This market covers revenues earned from prescription therapies used to treat colorectal cancer across key care settings, counted in USD at ex-manufacturer pricing (net of typical rebates) and aggregated at the global level.
Scope exclusions: We exclude screening tests, surgical devices, supportive care drugs that do not have an anti-tumor effect, and investigational therapies that are not authorized for use.
Segments Covered in This Report
- By Therapy
- Immunotherapy
- Chemotherapy
- Targeted Therapy
- Combination Therapy
- By End User
- Hospitals and Clinics
- Cancer Research Centers
- Others
- By Geography
- North America
- United States
- Canada
- Mexico
- Europe
- Germany
- United Kingdom
- France
- Italy
- Spain
- Rest of Europe
- Asia Pacific
- China
- Japan
- India
- South Korea
- Australia
- Rest of Asia Pacific
- Middle East and Africa
- GCC
- South Africa
- Rest of Middle East and Africa
- South America
- Brazil
- Argentina
- Rest of South America
- North America
Data Sources, Market Sizing, and Validation
Desk Research
Desk work was used to set the demand pool and pricing guardrails before we moved to interviews. We referenced public cancer epidemiology and treatment-pathway signals from sources such as the World Health Organization (including IARC), the US CDC, the US National Cancer Institute (SEER), and national health systems and statistical offices that publish oncology utilization snapshots.
To align product uptake with real-world practice, we also reviewed regulatory and clinical evidence sources such as the US FDA and EMA approval databases, peer-reviewed oncology journals, and clinical trial registries. We then cross-checked with company filings, investor presentations, and reputable press. Where gaps remained on revenues by therapy class and geography, we used paid subscriptions for company financials and intelligence, patent databases, and selective contract and tender tracking to validate directionally. The sources named here are illustrative and not exhaustive, and many other references were also used for data collection, validation, and research clarification.
Primary Interviews and Surveys
Primary interviews and short surveys were run with oncologists, hospital and pharmacy procurement teams, payers, and therapy-area commercial leaders to pressure-test the demand build and pricing progression. Because this is a global market, feedback was gathered across APAC, EMEA, and the Americas to reflect differences in diagnosis rates, biomarker testing access, and reimbursement coverage, and then select respondents were re-contacted when assumptions shifted.
Distribution of primary research fieldwork respondents
| Company type | Respondent position | Region |
|---|---|---|
| Top tier: 34% | CXOs: 13% | APAC: 46% |
| Mid tier: 50% | Functional/Unit leaders: 33% | EMEA: 34% |
| Smaller Players: 16% | Managers: 54% | Americas: 20% |
Market-Sizing & Forecasting
Sizing started with a top-down patient and treatment-course reconstruction, where incidence, diagnosed population, stage mix, biomarker testing penetration, and treated share were converted into regimen volumes, then valued using therapy-class level pricing and typical duration assumptions. Because pricing and access can shift quickly in oncology, we also tracked signals such as new label expansions, biosimilar entry timing, line-of-therapy migration, and reimbursement coverage updates to keep the model tied to what gets used and paid for.
To corroborate totals, selective bottom-up checks were used, including supplier revenue roll-ups from public reporting, sampled country-level price benchmarks, and channel checks on mix shifts between chemotherapy, targeted therapy, immunotherapy, and combinations. Where a direct revenue split was not observable, gaps were handled through proportional allocation using epidemiology weights and expert-validated adoption curves, and then sensitivity ranges were applied to the most variable inputs. For forecasting, scenario analysis was used with a base case informed by primary feedback on adoption pace, access expansion, and expected pricing pressure, followed by consistency checks against historical growth patterns and approval calendars.
Data Validation & Update Cycle
Outputs were validated through multi-step checks that compare implied patients on therapy, average annual cost per treated patient, and regional shares against independent public signals and expert inputs. When outliers appeared, inputs were traced back to the driver level, and interviews were re-opened if the variance was tied to a specific geography, therapy class, or approval-related inflection.
Before sign-off, the model is reviewed by another analyst to confirm arithmetic integrity, assumption transparency, and that inclusions and exclusions are applied consistently across regions. Reports are refreshed annually, and interim updates are triggered when there are material events such as major approvals, safety warnings, pricing actions, or reimbursement changes. Before delivery, we do a fresh pass to ensure clients receive the most current view available.
Mordor Intelligence's Colorectal Cancer Therapeutics Market Size Compared Against Other Published Estimates
Published values for this market can look far apart, even when the same words are used, because the underlying build often starts from different patient pools, treatment boundaries, and pricing logic. Differences also show up when one estimate is updated after a wave of label expansions or biosimilar launches and another is still using older utilization and price assumptions.
Screening tests, diagnostic procedures, and related service revenues sit outside Mordor Intelligence's scope, which is one reason some published totals run higher when they bundle the broader colorectal cancer care pathway with drug therapy value. Other gaps usually come from whether combination regimens are counted as full course value versus split by component, how net pricing is treated versus list pricing, and whether access constraints by region are modeled explicitly or smoothed into a global average.
Benchmark comparison
| Source | Market Size | Gaps in Research Methodology |
|---|---|---|
| Mordor Intelligence | USD 14.25 B (2026) | |
| Industry Publisher A | USD 13.35 B (2024) | Uses an earlier base year and a broader type split that can mix diagnostics with therapeutics, and the pricing basis is not clearly stated as net of rebates, which can shift totals. |
| Consultancy B | USD 12.40 B (2023) | Anchors on a different base-year demand picture and does not clearly reconcile biomarker testing penetration and treated-share assumptions across regions, which can understate access-driven growth. |
Across the three figures, the spread is largely explained by what is counted as therapy value versus adjacent colorectal cancer care revenues, and by how net pricing and access are translated into treated volumes. Our checks using epidemiology signals and interview-validated uptake steps help keep assumptions explicit, so updates after approvals or reimbursement changes can be made without breaking the model logic.
Key Questions Answered in the Report
What is the current size of the colorectal cancer therapeutics market?
The colorectal cancer therapeutics market size reached USD 14.25 billion in 2026 and is projected to hit USD 17.9 billion by 2031
Which therapy segment is expanding the fastest?
Immunotherapy leads growth with a forecast 14.21% CAGR through 2031, driven by strong clinical efficacy in biomarker-selected patients
Which region contributes the most revenue?
North America accounted for 42.35% of global revenue in 2025, supported by advanced reimbursement and rapid regulatory approvals.
Why are biomarker tests critical for market growth?
Biomarker assays enable precision prescribing, qualify patients for high-value immunotherapies, and unlock broader reimbursement coverage.
How are supply-chain issues affecting treatment choices?
Shortages of platinum chemotherapy agents raise costs and prompt payers to consider targeted regimens that reduce inpatient resource burden.