
Collision Sensors Market Size and Share
Market Overview
| Study Period | 2020 - 2031 |
|---|---|
| Market Size (2026) | USD 4.88 Billion |
| Market Size (2031) | USD 6.89 Billion |
| Growth Rate (2026 - 2031) | 7.12% CAGR |
| Fastest Growing Market | Asia Pacific |
| Largest Market | North America |
| Market Concentration | Medium |
Major Players *Disclaimer: Major Players sorted in no particular order Image © Mordor Intelligence. Reuse requires attribution under CC BY 4.0. | |
Collision Sensors Market Analysis by Mordor Intelligence
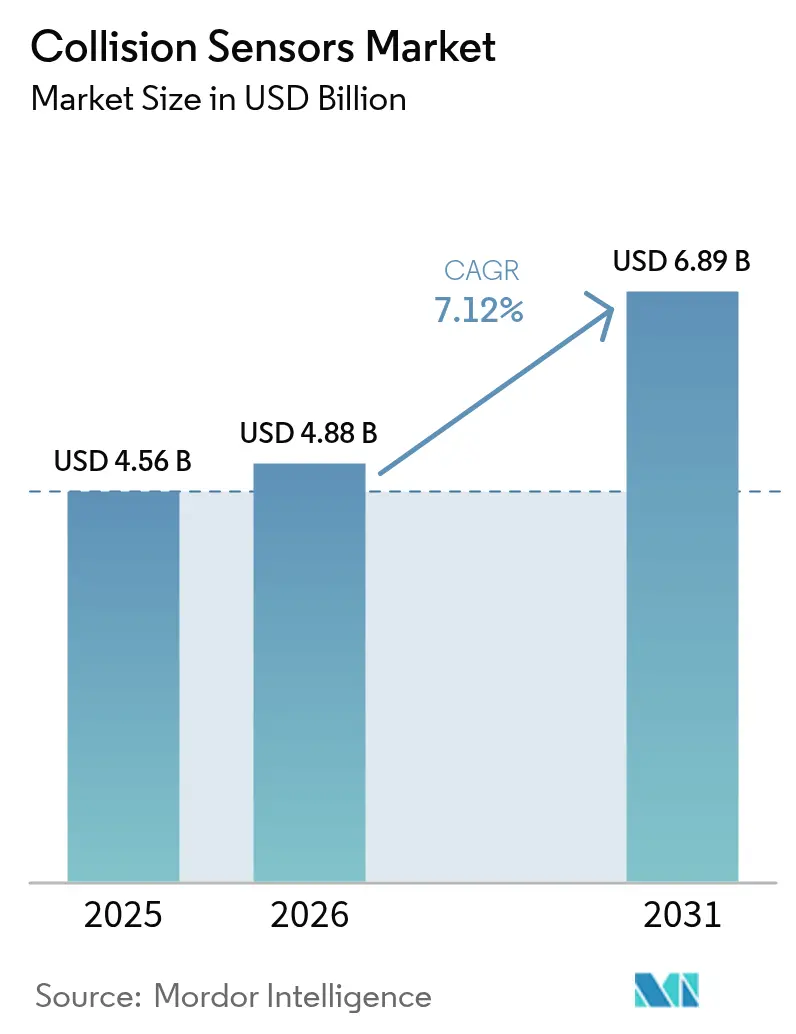
The collision sensors market size is expected to grow from USD 4.56 billion in 2025 to USD 4.88 billion in 2026 and is forecast to reach USD 6.89 billion by 2031 at 7.12% CAGR over 2026-2031. Heightened safety mandates, the rapid proliferation of Level 2-plus autonomy, and falling solid-state LiDAR prices are reinforcing demand as OEMs redesign vehicle electrical architectures around multi-sensor fusion. The United States, Europe, and China now require or strongly encourage the use of automatic emergency braking (AEB) and pedestrian detection, persuading automakers to standardize radar–camera hybrids even on entry-level trims. Mature 77 GHz radar supply chains still dominate, but LiDAR specialists cut unit costs below USD 500 in 2025, unlocking mid-tier adoption. Autonomous mobile robot deployments in logistics and defense retrofit programs add non-automotive growth runways, while cybersecurity and adverse-weather reliability remain headwinds that suppliers must address with redundant architectures.
Key Report Takeaways
- By application, adaptive cruise control led with 38.35% of the collision sensors market share in 2025; automatic emergency braking is advancing at an 7.71% CAGR through 2031.
- By technology, radar captured a 62.15% share of the collision sensor market size in 2025, whereas LiDAR is forecast to accelerate at an 8.45% CAGR through 2031.
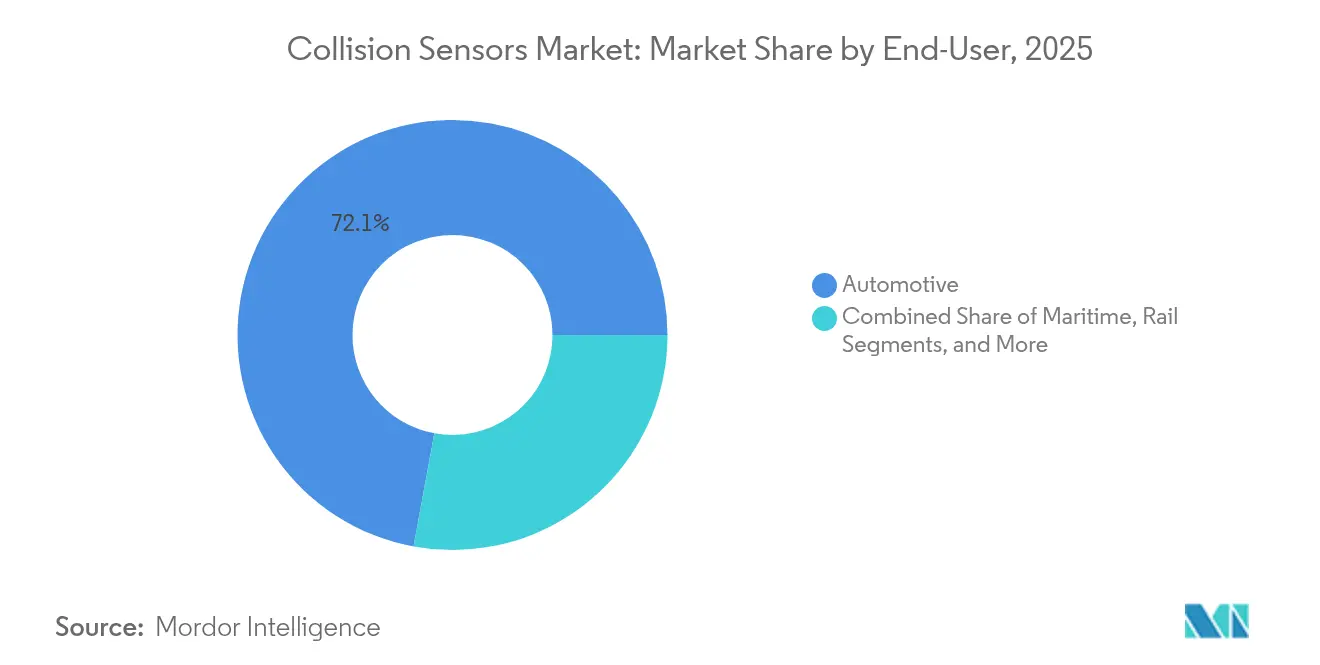
- By end-user, the automotive sector commanded 72.10% of the revenue in the collision sensors market in 2025; industrial robotics is expected to expand at a 8.88% CAGR from 2026 to 2031.
- By autonomy level, Level 2-3 systems held 49.35% of the collision sensors market in 2025, while Level 4-5 platforms are poised for an 8.02% CAGR to 2031.
- By geography, North America dominated with 45.20% revenue in 2025 in the collision sensors market; Asia-Pacific is tracking an 8.16% CAGR through 2031.
Note: Market size and forecast figures in this report are generated using Mordor Intelligence’s proprietary estimation framework, updated with the latest available data and insights as of 2026.
Global Collision Sensors Market Trends and Insights
Drivers Impact Analysis*
| Driver | (~) % Impact on CAGR Forecast | Geographic Relevance | Impact Timeline |
|---|---|---|---|
| Enhanced automotive safety regulations | +1.8% | Global, early in North America, Europe, China | Short term (≤ 2 years) |
| Rapid ADAS and autonomous-driving rollout | +2.1% | North America, Europe, China, Japan | Medium term (2-4 years) |
| Falling solid-state LiDAR cost curve | +1.3% | Global, volume in China, North America | Medium term (2-4 years) |
| V2X-enabled predictive collision alert | +0.9% | North America, Europe, China | Long term (≥ 4 years) |
| Electrified-vehicle production surge | +1.0% | Global, led by China, Europe, North America | Medium term (2-4 years) |
| Military retrofit programs for legacy fleets | +0.4% | North America, Europe, Middle East | Long term (≥ 4 years) |
| Source: Mordor Intelligence | |||
Enhanced Automotive Safety Regulations
Regulators in the United States finalized a rule in 2024 that requires pedestrian AEB on new passenger vehicles by 2029, prompting OEMs to integrate thermal or near-infrared cameras with millimeter-wave radar, incurring an additional USD 120–180 in bill-of-materials costs. Insurers reward this investment through 8–12% premium discounts.[1]National Highway Traffic Safety Administration, “AEB Technology Mandate,” nhtsa.gov Euro NCAP’s 2024 protocol withholds five-star ratings from models lacking cyclist protection at urban intersections, accelerating the rollout of corner radar. China’s C-NCAP added vulnerable-road-user scoring in 2024, prompting domestic suppliers to combine low-cost ultrasonic sensors with radar to keep sedans under strict price ceilings. India drafted mandates that retrofit 1.2 million heavy trucks with forward-collision warning by 2028, while Japan subsidizes aftermarket kits for vehicles older than 10 years.
Rapid ADAS and Autonomous-Driving Rollout
Waymo surpassed 2 million paid robotaxi rides after expanding to Los Angeles and Austin in late 2024, proving Level 4 scalability once sensor suites marry long-range LiDAR with imaging radar. Tesla shipped FSD v12.5 to 1.8 million cars, relying on cameras only, but critics question redundancy during complex edge cases. Mercedes-Benz secured Level 3 approval in California and Nevada using stereo cameras plus LiDAR at speeds up to 40 mph, shifting liability from driver to OEM. China’s 2026 Level 2 ADAS mandate equips roughly 28 million vehicles annually, solidifying a captive sensor market for Huawei and Desay. GM’s 2025 integration of Mobileye EyeQ6 Lite targets sub-USD 200 camera-radar fusion to counter Tesla’s vision-only path
Falling Solid-State LiDAR Cost Curve
Hesai slashed the AT128 price by half in January 2025 to USD 500, reaching a crossover where LiDAR can be optioned on mid-tier vehicles. Volume gains stem from 905 nm VCSEL arrays on 8-inch silicon wafers that deliver 40% higher photon efficiency. Luminar, Innoviz, and Continental each locked sub-USD 1,000 unit pricing for series production, while Valeo shipped 150,000 scanning modules to Chinese OEMs in 2024.
V2X-Enabled Predictive Collision Alert
A U.S. Notice of Proposed Rulemaking in 2024 proposes mandating V2X radios on light-duty vehicles by 2028, thereby extending the collision-alert range beyond the reach of on-board sensors. Qualcomm and Michigan DOT trials achieved sub-100 ms latency for intersection warnings. China plans to install roadside C-V2X on 10,000 km of highways by the end of 2024. ETSI has updated ITS-G5 to support cooperative perception, allowing vehicles to share raw sensor packets. Autoliv embedded V2X receivers into its radar-camera fusion module, eliminating the need for extra hardware.
Restraints Impact Analysis*
| Restraint | (~) % Impact on CAGR Forecast | Geographic Relevance | Impact Timeline |
|---|---|---|---|
| High BOM cost for multi-sensor fusion | -1.2% | Global, acute in India, SE Asia, Latin America | Short term (≤ 2 years) |
| Reliability limits in snow, fog and debris | -0.8% | North America, Northern Europe, mountains | Medium term (2-4 years) |
| Semiconductor supply-chain volatility | -0.6% | Global, 77 GHz radar and image sensors | Short term (≤ 2 years) |
| Cyber-security exposure of sensor networks | -0.5% | Global, regulation in Europe, North America | Medium term (2-4 years) |
| Source: Mordor Intelligence | |||
High BOM Cost for Multi-Sensor Fusion
Full radar-camera-LiDAR stacks add USD 600–1,200 to vehicles, limiting penetration in price-sensitive markets. Tier-one ECUs account for up to 45% of ADAS hardware cost because they need high-performance SoCs. Maruti Suzuki postponed Level 2 ADAS on compact sedans in 2024 to avoid breaching key price thresholds. Fleet buyers often forgo hands-free options in favor of payload and fuel economy, and Stellantis reported sub-15% ADAS take-up across Southern Europe and South America.
Reliability Limits in Snow, Fog and Debris
Camera accuracy drops by up to 60% in snow or fog, and radar maintains range but creates clutter from spray. Bosch documented false positives and is refining signal processing. Velodyne introduced heated LiDAR lenses for operation down to −40 °C. Continental invested EUR 120 million in self-cleaning radomes that use ultrasonic vibration to shed debris. Aftermarket heated camera mounts are proliferating in Nordic EV communities.
*Our forecasts treat driver/restraint impacts as directional, not additive. The impact forecasts reflect baseline growth, mix effects, and variable interactions.
Segment Analysis
By Application: AEB Gains as Insurers Reward Crash Prevention
In 2025, adaptive cruise control commanded a dominant 38.35% share of the collision sensors market, while automatic emergency braking is projected to grow at an 7.71% CAGR, continuing through 2031. Insurance incentives worth 8–12% of premiums and U.S. federal mandates catalyze uptake, while forward-collision warning remains bundled with AEB in most regions. Blind-spot monitoring already exceeds a 60% fitment rate in North America and Europe, but growth is slowing now that the feature is standard. Ultrasonic parking sensors face pressure from surround-view cameras, suppliers react by adding automated-parking software to preserve value.
Other advanced functions, including pedestrian and cyclist detection, are rapidly gaining popularity in dense urban markets. Euro NCAP credits for motorcycle intersection protection force OEMs to integrate corner radar and wide-angle cameras. Volvo’s City Safety system cut insurance claims by 28%, validating ROI for vulnerable-road-user solutions. Denso’s compact radar module targets India’s vast two-wheeler market, opening up a new adjacency.


By Technology: LiDAR Narrows Gap as Solid-State Costs Halve
Radar retained 62.15% revenue in 2025 thanks to year-round reliability and supply maturity, but LiDAR’s 8.45% forecast CAGR will chip away as sub-USD 500 solid-state units become attainable for mass-market trims. Cameras gain from high-resolution CMOS sensors yet remain sensitive to low light, limiting solo use beyond Level 2. Ultrasonic sensors continue to dominate low-speed maneuvers due to their low cost. Infrared modules for night pedestrian detection and MEMS pressure sensors, which bridge the gap between passive and active safety, drive niche growth.
Bosch shipped more than 100 million radar units in 2024, leveraging SiGe transceivers and antenna-in-package designs. Continental’s fifth-generation short-range radar is expected to deliver 4-degree azimuth resolution at a sub-USD 40 price point by 2026. Omnivision launched a 5MP sensor with 140 dB dynamic range, improving tunnel-exit performance. Murata raised the ultrasonic output 40% to serve Chinese EVs
By End-User: Industrial Robotics Outpaces Automotive Growth
Automotive accounted for 72.10% of 2025 revenue, while warehouse automation drives industrial robotics to a 8.88% CAGR, surpassing overall collision sensor market growth. Amazon alone operates 750,000 autonomous mobile robots, each laden with LiDAR and ultrasonics. Aerospace, maritime and rail consume fewer units but command USD 2,000–5,000 sensor modules under harsh-environment specs.
Passenger cars still account for the largest volumes, while light commercial vehicles are rising the fastest as last-mile delivery fleets seek lower insurance premiums. Heavy trucks integrate radar-camera fusion to meet Euro VII idle penalties. Agriculture and construction machinery adopt ultrasonics to cut job-site accidents amid stricter safety rules.
By Vehicle Autonomy Level: Level 4-5 Pipelines Drive Sensor Complexity
Level 2-3 systems contributed 49.35% of the collision sensor market in 2025, mirroring the mass adoption of Highway-Assist. Waymo’s sixth-generation suite combines 29 cameras, six LiDARs and five radars to sustain perception despite occlusion, underscoring the complexity required for Level 4. Level 4-5 CAGR stands at 8.02% as Cruise, Zoox, and Aurora scale freight pilots.
Liability hand-off and redundancy drive bills of material beyond USD 1,500 per vehicle. GM’s Super Cruise already spans 400,000 miles of mapped roads, charging users a subscription after the trial. Chinese OEMs launch comparable navigation-on-pilot features to differentiate EVs in a crowded market.
Geography Analysis
North America contributed 45.20% of the 2025 revenue, as AEB mandates and premium-vehicle penetration created the world’s largest collision sensor market. Consumers are willing to pay USD 1,500–2,500 for Level 2-plus bundles, and insurers reward forward-collision warning systems with lower premiums. Canada aligns its standards with those of the NHTSA for a 2028 deadline, while Mexico’s domestic sales grow as safety awareness increases. Semiconductor allocations continue to favor the region’s premium OEMs during shortages, thereby reinforcing supply resilience.
The Asia-Pacific region is set for an 8.16% CAGR, the highest regional growth rate. China’s 2026 Level 2 mandate affects 28 million annual vehicles, ensuring a large captive base for domestic radar and camera suppliers. India plans to retrofit 1.2 million heavy trucks with forward-collision warning systems by 2028, and the six-airbag rules have already lifted the sensor content per vehicle. Japan, South Korea and Taiwan exploit optics and packaging expertise to export LiDAR modules, while ASEAN nations start with ultrasonic parking sensors before ascending the technology ladder.
Europe captured roughly 27% share in 2025 on the back of Euro NCAP’s influential five-star criteria and the EU General Safety Regulation that requires AEB and lane-keeping assist on all new models from 2024 onward. Germany’s supplier triad, Bosch, Continental and ZF, keeps value in-region through vertical integration. The Netherlands pilots V2X cooperative perception across 2,000 km of highways, while France and Italy expand electric-vehicle incentives that also mandate advanced safety functions.
South America plus the Middle East and Africa form a nascent market below 10% revenue. Brazil enforces electronic stability control and rear cameras, positioning for future collision-sensor uptake. Gulf states deploy premium sensor suites in smart-city pilots, and South Africa installs sensors mainly for export models bound for Europe.


Regulatory Landscape
Collision-sensing adoption is being driven by tighter vehicle-safety scoring and mandates, alongside machinery functional-safety rules that govern sensors used around people and autonomous equipment. In the United States, NHTSA finalized a 2024 rule requiring pedestrian AEB on new passenger vehicles by 2029. In parallel, its late-2024 NCAP roadmap expands the set of ADAS technologies emphasized in consumer ratings, which reinforces demand for radar-camera fusion with robust vulnerable-road-user performance. In Europe, the EU General Safety Regulation requires AEB and lane-keeping assist on all new models from 2024, while Euro NCAPs 2024 protocols raise the bar for cyclist and intersection scenarios and push fitment of corner radar and wider-angle vision sensing.
For industrial and off-highway applications, compliance is anchored in machinery and functional-safety frameworks where collision sensors often operate as part of safety functions and protective fields. OSHA requirements for machine guarding and presence-sensing devices (29 CFR 1910.212 and 1910.217) continue to shape safety system validation in the United States. In the EU, Machinery Regulation (EU) 2023/1230 entered into force in 2023 and applies from January 20, 2027, adding explicit attention to software, AI, and cybersecurity for high-risk machinery, which raises documentation and conformity-assessment requirements for sensor suppliers and integrators. Standards such as ISO 3691-4 for driverless industrial trucks and IEC specifications for electro-sensitive protective equipment also frame how collision sensing is verified in mobile robotics and safety scanner use cases.
Value Chain Analysis
The collision sensors value chain begins with semiconductor and photonics inputs, including RF CMOS/SiGe and packaging for 77 GHz radar, image sensors and optics for cameras, and laser emitters and receivers for LiDAR. This is followed by sensor module manufacturing and calibration, then tier-one integration of sensor-fusion ECUs and software stacks into OEM platforms. Upstream component availability and qualification cycles remain key gating factors, especially where cybersecurity and functional-safety requirements influence microcontroller choice and secure communications. In automotive, tier-one suppliers and semiconductor vendors hold bargaining power due to qualified chipsets and long design-in timelines, while OEMs increasingly specify standardized interfaces to reduce integration effort across multi-sensor architectures.
Value capture is shifting toward integrated modules and safety-certified solutions that reduce commissioning time and liability for operators. The ISO 23150 series publication in June 2026, covering logical interfaces between environmental perception sensors (radar, lidar, camera, ultrasonic) and data fusion units for automated driving, supports a more modular approach where sensor hardware can be swapped with less revalidation at the fusion layer. In industrial automation and logistics, safety certification is also a commercial differentiator: terminal and robotics deployments tend to favor sensors and systems validated to ISO 13849 and IEC-aligned functional-safety practices. Distribution splits between OEM factory fitment, which is dominant in passenger vehicles and new industrial equipment, and a growing aftermarket for retrofit safety kits on existing fleets and facilities, where integrators package sensors with controllers, safety communications, and commissioning services.
Competitive Landscape
Continental, Bosch, Denso, and ZF held an estimated 55% share in 2024, underscoring a moderately consolidated market for collision sensors. Their vertical integration, including transceivers, camera modules, and sensor-fusion ECUs, offers OEMs turnkey solutions and guarantees a global supply. Mobileye disrupted the camera space by pricing its SuperVision package at USD 1,200 in China, winning contracts with Geely and Nio. Hesai, Luminar, and Innoviz leverage steep LiDAR cost curves to pitch full perception stacks, shifting emphasis from hardware to data services.
Semiconductor vendors like NXP and Infineon command bargaining power by controlling radar processors and microcontrollers with built-in cybersecurity, as ISO/SAE 21434 requires encryption and intrusion detection across external sensors. Allocation decisions in 2024 favored premium OEMs, delaying mid-tier vehicle launches. Suppliers diversify with in-house wafer fabs (Bosch Dresden) and joint ventures (Continental–Qualcomm) to secure critical components.
White-space opportunities center on aftermarket retrofit kits for aging commercial fleets where operators seek crash avoidance without buying new vehicles. Software-defined stacks allow over-the-air upgrades that boost detection accuracy, a capability Tesla monetized in 2024. Patent filings show Aptiv developing machine-learning fault isolation to keep Level 3 features active even when one sensor type is impaired.
Collision Sensors Industry Leaders
Continental AG
NXP Semiconductors N.V.
Delphi Automotive LLP
Infineon Technologies AG
Murata Manufacturing Co., Ltd.
- *Disclaimer: Major Players sorted in no particular order


Market Opportunities and Future Outlook
White space is clearest where regulation and safety certification directly change buying behavior, particularly in commercial fleets, industrial robotics, and automated logistics sites that need documented functional safety. The EU Machinery Regulation 2023/1230 applying from January 20, 2027 tightens scrutiny of software, AI, and cybersecurity for machinery, which increases demand for collision-sensing architectures that can be certified and maintained through lifecycle updates rather than installed as standalone hardware. Standards-led automation programs and operator requirements in warehouses and terminals also create room for suppliers that combine sensing, safety controllers, and validated protective-field logic using established frameworks such as ISO 13849 and IEC 61508/62061, reducing commissioning and revalidation burdens for integrators.
On the automotive side, opportunities cluster around cost-down multi-sensor fusion and interface standardization that lowers integration complexity across vehicle lines. NHTSAs late-2024 NCAP ADAS roadmap and the U.S. pedestrian AEB mandate with a 2029 compliance horizon increase the value of robust perception performance in vulnerable-road-user scenarios, which supports upgrades in radar resolution, camera dynamic range, and redundancy strategies. The June 2026 publication of the ISO 23150 interface series further supports modular sensor-fusion architectures in automated-driving stacks, complementing ongoing moves by semiconductor vendors and tier-ones toward more integrated sensing-and-processing modules that reduce wiring, ECU load, and calibration effort. Industrial deployments also favor safety-rated sensing as human-robot collaboration expands, reinforcing demand for certified 3D sensing and safety communications, for example PROFIsafe and CIP Safety, as part of complete collision-avoidance systems rather than stand-alone sensors.
Recent Industry Developments
- June 2026: Infineon Technologies AG started mass production of its RASIC CTRX8188F, positioned as an 8Tx8Rx imaging radar MMIC for automotive applications. The move supports higher-resolution radar sensing that can improve object classification and angular accuracy for collision-avoidance functions. It also supports supply availability for OEMs and tier-one radar module makers working on more centralized, software-defined ADAS architectures.
- March 2025: Hesai Technology announced a USD 150 million expansion of its solid-state LiDAR production facility in Shanghai, targeting 1 million units of annual capacity by 2027. The investment added automated assembly and deeper in-house capability around key components such as VCSEL arrays to push down unit costs. Scaling supply at this level increases price pressure on competing perception modalities and broadens LiDAR availability for mid-tier vehicle programs and autonomy stacks.
- November 2024: Continental AG introduced two airbag crash sensors, Acceleration Satellite gSAT and Standard Pressure Satellite pSAT, aimed at collision service and replacement demand. The launch reinforces the aftermarket channel as a meaningful route to volume beyond new-vehicle fitment, particularly as repair complexity rises with modern restraint and sensing systems. For suppliers, it highlights the need to support serviceability, diagnostics, and parts availability alongside OEM design-ins.


Research Methodology Framework and Report Scope
Market Definition and Coverage
This market covers revenue generated from collision sensing devices and modules that detect nearby obstacles, supporting collision warning, avoidance, and parking safety functions across vehicles and other moving platforms.
Scope exclusions: Standalone software-only ADAS algorithms, dashboards, and vehicle control units are excluded unless they are sold as part of the collision sensor hardware value.
Segmentation Overview
- By Application
- Adaptive Cruise Control
- Forward Collision Warning
- Blind Spot Monitoring
- Lane Departure Warning
- Parking Sensors
- Rear Cross-Traffic Alert
- Automatic Emergency Braking
- Other Applications
- By Technology
- Ultrasonic
- Radar
- Camera / Vision
- LiDAR
- Infra-red
- Pressure / MEMS
- By End-User
- Automotive
- Passenger Vehicles
- Light Commercial Vehicles
- Heavy Commercial Vehicles
- Aerospace and Defense
- Maritime
- Rail
- Industrial Robotics
- Other End-Users
- Automotive
- By Vehicle Autonomy Level
- Level 0-1
- Level 2-3
- Level 4-5
- By Geography
- North America
- United States
- Canada
- Mexico
- South America
- Brazil
- Argentina
- Rest of South America
- Europe
- Germany
- United Kingdom
- France
- Netherlands
- Rest of Europe
- Asia-Pacific
- China
- India
- Japan
- South Korea
- Rest of Asia-Pacific
- Middle East and Africa
- Middle East
- Saudi Arabia
- United Arab Emirates
- Rest of Middle East
- Africa
- South Africa
- Nigeria
- Rest of Africa
- Middle East
- North America
Data Sources, Market Sizing, and Validation
Desk Research
Desk research was used to build the base structure for the model and anchor it to observable signals in automotive and industrial activity. We referred to public sources such as transportation safety agencies and crash statistics publications, vehicle regulation and standards bodies, national statistics offices for vehicle production and registrations, customs trade portals for sensor-related imports and exports, and patent office databases to track sensing technology momentum.
On top of this, we reviewed annual reports, investor presentations, and product documentation to understand typical sensor fitment patterns by function and platform. A paid subscription for company financials and news was also used to cross-check revenue splits and key product introductions when the public narrative was unclear. These sources are not exhaustive, and other public documents were used to collect data, validate assumptions, and clarify open questions during the study.
Primary Interviews and Surveys
Primary interviews and surveys were used to stress-test desk assumptions on sensor content per platform, typical pricing movements, and adoption timing for functions such as AEB, blind spot monitoring, and parking assistance. We spoke with a mix of sensor ecosystem participants, vehicle and platform stakeholders, and domain experts across APAC, EMEA, and the Americas, so the final model reflects regional rollout differences and real purchasing behavior.
Distribution of primary research fieldwork respondents
| Company type | Respondent position | Region |
|---|---|---|
| Top tier: 34% | CXOs: 12% | APAC: 43% |
| Mid tier: 52% | Functional/Unit leaders: 38% | EMEA: 36% |
| Smaller Players: 14% | Managers: 50% | Americas: 21% |
Market-Sizing & Forecasting
Market size was first reconstructed using a top-down approach where vehicle production and parc indicators, ADAS and safety feature penetration, and average sensor content per vehicle are converted into a demand pool by region and platform type. After the model math was built and the early totals looked directionally right, we used selective bottom-up approximations to corroborate and tune the result. This included sampled shipment discussions, channel feedback on radar, ultrasonic, camera, and LiDAR volumes, and price sanity checks by application.
Key inputs in the model include new vehicle production by region, the mix of passenger versus light and heavy commercial platforms, adoption rates of functions such as forward collision warning and parking sensors, autonomy level rollout patterns, and average selling price ranges by sensing technology. Because pricing is not uniform, ASP progression was handled using application-level ranges and expected cost-down curves, then checked against interview feedback and publicly visible product positioning. Forecasting relies mainly on scenario analysis supported by regression-style relationships between vehicle output, safety feature penetration, and regulatory momentum, and then reconciles the scenarios to expert consensus on timing. Where bottom-up views had gaps for niche end-users like rail or industrial robotics, those portions were estimated using proxy activity indicators and kept conservative until validated.
Data Validation & Update Cycle
Outputs were validated through multiple checks so the final number stays consistent with observed market behavior. We compare modeled revenue against independent signals such as vehicle build cycles, feature fitment trends, and known technology substitution patterns, and then review outliers until the reason is clear. If a large variance appears in a region or technology, analysts re-contact industry participants to confirm whether it is a data timing issue, a scope mismatch, or a true market shift.
Before publication, the model and assumptions are reviewed in steps by more than one analyst to catch calculation errors and inconsistent inputs early. Reports are refreshed annually, and interim updates are made when material events occur, for example regulation changes or sharp production swings. Right before delivery, a final pass is done so clients receive the latest updated view rather than an older snapshot.
Mordor Intelligence's Collision Sensors Market Sizing Compared With Other Published Estimates
Published market sizes for collision sensors often vary because the scope line is drawn differently and because pricing and adoption assumptions are refreshed at different speeds. Differences also come from whether the estimate focuses only on automotive collision avoidance, or whether it also counts industrial robotics, rail, maritime, and aerospace-related sensing demand.
ADAS sensor content per vehicle, technology mix shifts between radar, ultrasonic, camera, and LiDAR, and how ASP declines are applied over time tend to create the biggest gaps. Coverage of autonomy levels also matters because Level 2 to 3 take rates can be modeled using feature penetration, while more advanced levels are sometimes projected using aggressive scenarios that are not tied back to near-term production plans or regulations.
Benchmark comparison
| Source | Market Size | Gaps in Research Methodology |
|---|---|---|
| Mordor Intelligence | USD 4.88 B (2026) | |
| Global Consultancy A | USD 7.51 B (2025) | Uses an earlier base year and a broader automotive-centric definition that can bundle adjacent ADAS sensing value, which lifts the starting market value and amplifies growth through higher penetration assumptions. |
| Industry Publisher B | USD 6.41 B (2024) | Frames the market as collision avoidance sensors largely within automotive, and applies faster technology growth and price trajectories, which tends to scale the 2024 value upward versus a mixed end-user model. |
Camera-only ADAS perception stacks and domain controller electronics sit outside Mordor Intelligence's scope, which reduces the chance of counting non-sensor value that some broader ADAS estimates may include. Across the three figures, the spread is mainly explained by base-year choice, how tightly the sensor hardware is separated from surrounding electronics, and whether non-automotive end-users are modeled with conservative proxy indicators or higher adoption curves.


Key Questions Answered in the Report
What is the current value of the collision sensors market?
The collision sensors market size stands at USD 4.88 billion in 2026.
How fast is demand expected to grow?
Market revenue is forecast to climb to USD 6.89 billion by 2031, equivalent to a 7.12% CAGR.
Which application is expanding the quickest?
Automatic emergency braking posts the fastest growth at an 7.71% CAGR through 2031, driven by regulatory mandates and insurance incentives.
Why are LiDAR prices falling sharply?
Suppliers moved to 905 nm VCSEL arrays on larger silicon wafers, doubling output and halving the AT128 unit price to roughly USD 500.
Which region offers the highest growth upside?
Asia-Pacific is projected for the strongest regional CAGR at 8.16% thanks to China’s compulsory Level 2 ADAS rule commencing in 2026.
Page last updated on:






