
Cold Insulation Market Size and Share
Market Overview
| Study Period | 2020 - 2031 |
|---|---|
| Market Size (2026) | USD 7.6 Billion |
| Market Size (2031) | USD 9.54 Billion |
| Growth Rate (2026 - 2031) | 4.65 % |
| Fastest Growing Market | Asia Pacific |
| Largest Market | Asia Pacific |
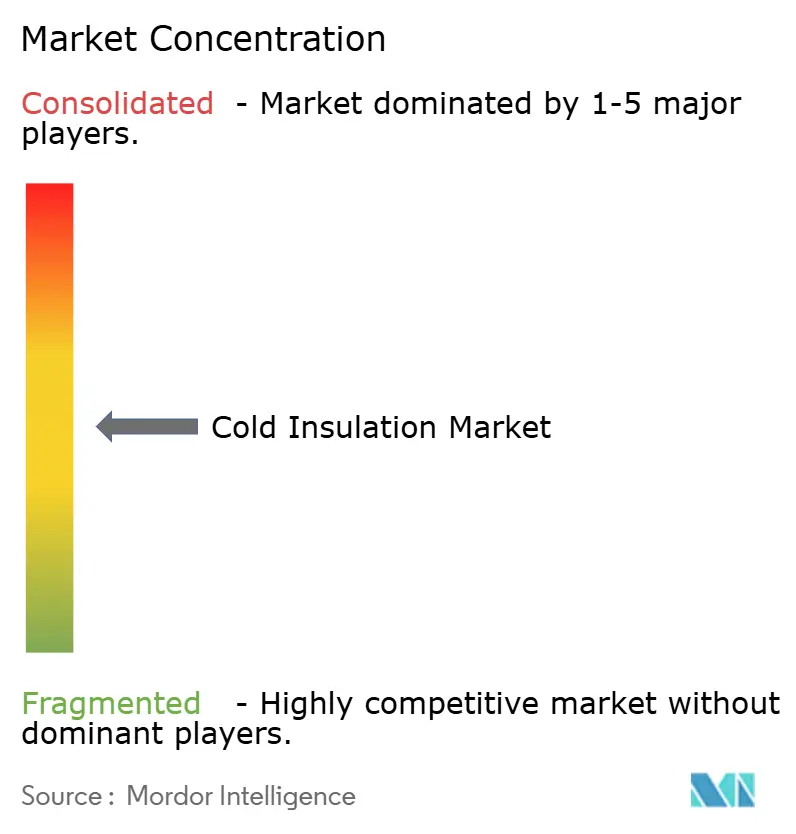
| Market Concentration | Medium |
Major Players *Disclaimer: Major Players sorted in no particular order Image © Mordor Intelligence. Reuse requires attribution under CC BY 4.0. | |
Cold Insulation Market Analysis by Mordor Intelligence
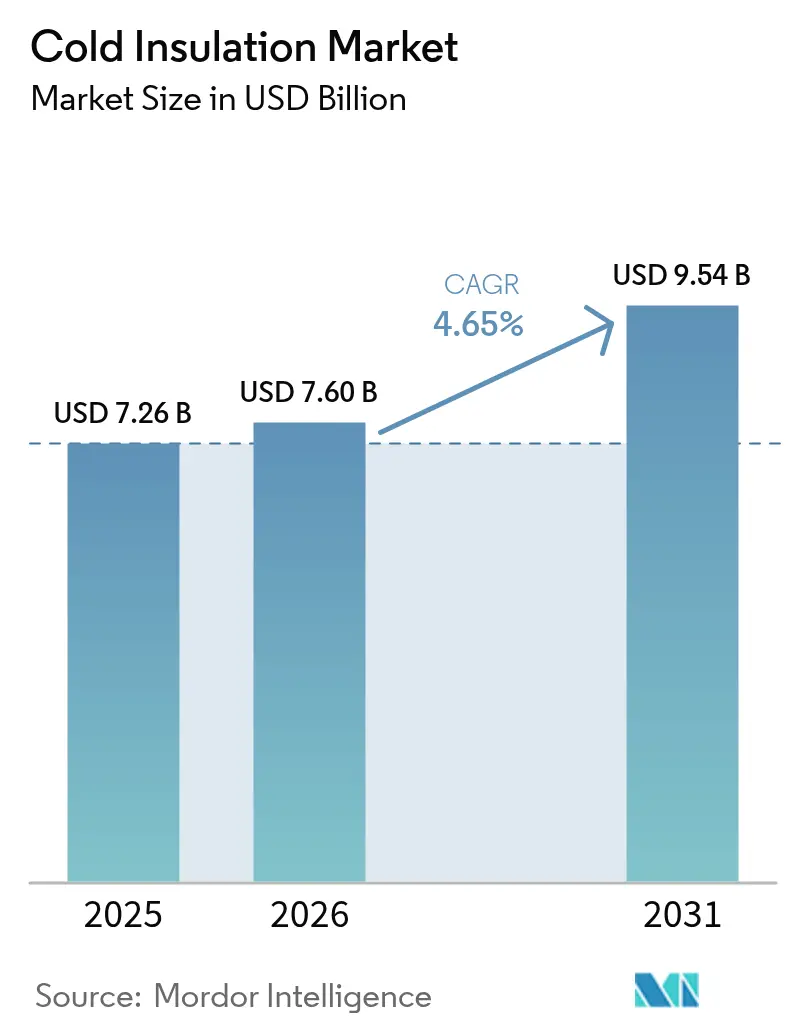
Cold Insulation market size in 2026 is estimated at USD 7.6 billion, growing from 2025 value of USD 7.26 billion with 2031 projections showing USD 9.54 billion, growing at 4.65% CAGR over 2026-2031. Demand is propelled by liquefied natural gas (LNG) build-outs, stricter energy-efficiency mandates for building retrofits, and wider adoption of temperature-controlled logistics. Technology improvements, particularly phenolic foam’s enhanced fire resistance and aerogel-based composites, allow suppliers to meet tougher performance specifications while easing installation constraints. Regulatory pressure to decarbonize industrial assets keeps R-value requirements moving upward, expanding the addressable scope for high-performance products. Meanwhile, the installer talent gap for advanced systems and volatile diisocyanate costs create periodic margin swings even for leading manufacturers. As capital requirements rise, larger players rely on vertical integration and regional manufacturing footprints to secure feedstocks and shorten delivery cycles, reinforcing high entry barriers across the cold insulation market.
Key Report Takeaways
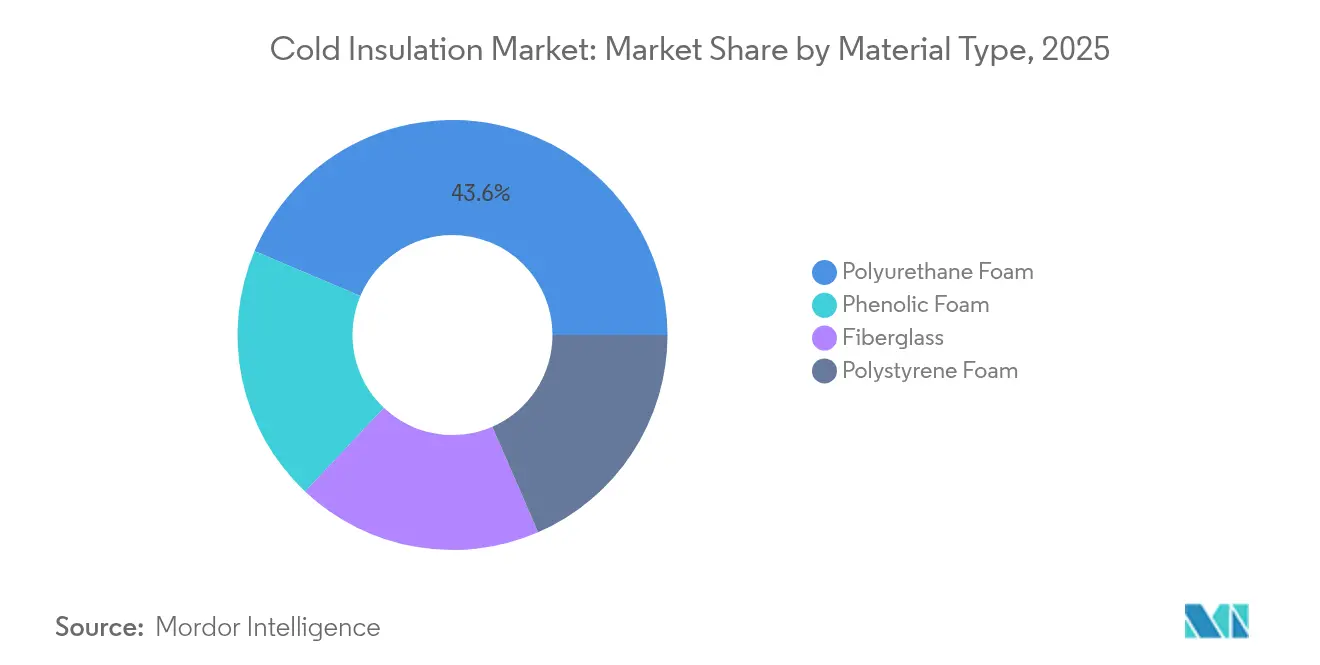
- By material, polyurethane foam held 43.62% of the cold insulation market share in 2025; phenolic foam is growing fastest at a 4.82% CAGR through 2031.
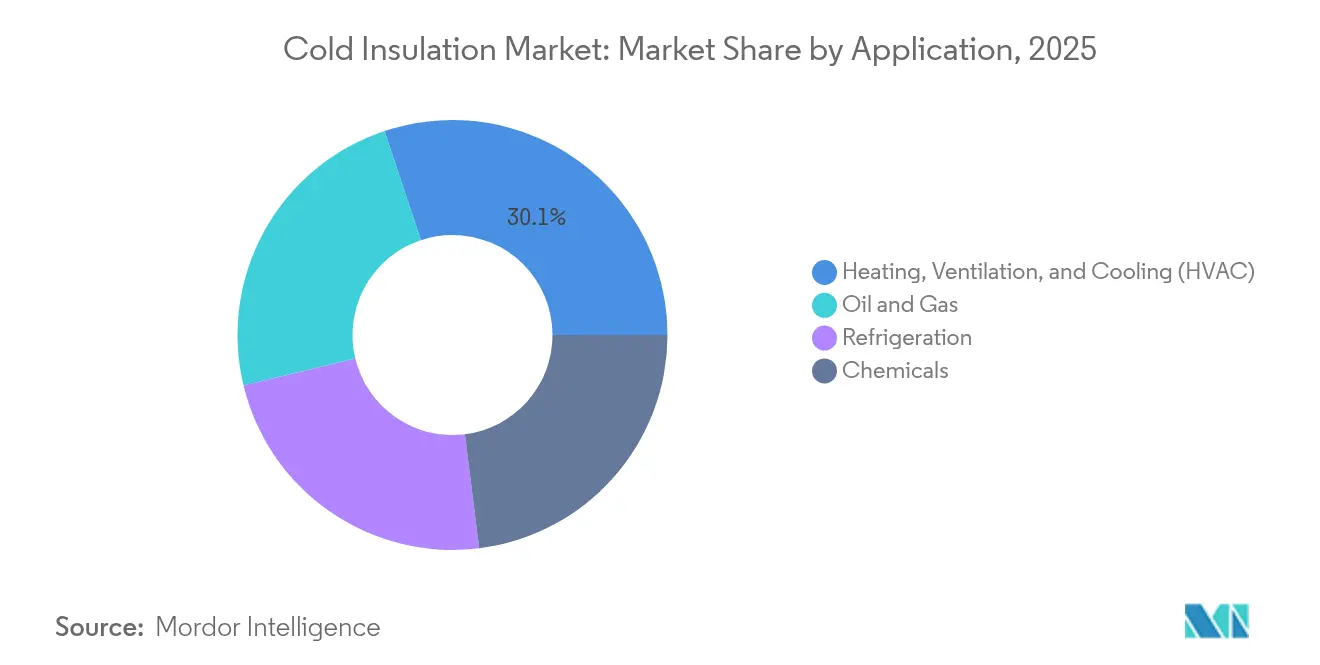
- By application, HVAC accounted for 30.12% of the cold insulation market size in 2025, while oil and gas is expanding at a 5.02% CAGR to 2031.
- By geography, Asia Pacific led with 37.35% revenue in 2025 and posts the highest regional CAGR of 5.4% over the forecast period.
Note: Market size and forecast figures in this report are generated using Mordor Intelligence’s proprietary estimation framework, updated with the latest available data and insights as of 2026.
Market Trends and Insights
Drivers Impact Analysis of Cold Insulation Market*
| Drivers | (~) % Impact on CAGR Forecast | Geographic Relevance | Impact Timeline |
|---|---|---|---|
| Rising demand for cryogenic insulation (LNG and LH₂ projects) | +1.6% | Global, with concentration in Asia Pacific and North America | Medium term (2-4 years) |
| Growing need for energy-efficiency and Net-Zero retrofits | +0.8% | Europe and North America primarily | Long term (≥ 4 years) |
| Expansion of global cold-chain logistics and e-grocery | +1.2% | Global, led by North America and Asia Pacific | Short term (≤ 2 years) |
| Surge in small-scale LNG bunkering infrastructure | +0.9% | Global maritime routes, concentrated in Europe and Asia | Medium term (2-4 years) |
| Industrial and Infrastructure Growth in Emerging Markets | +0.5% | Asia Pacific, Middle East, and Latin America | Long term (≥ 4 years) |
| Source: Mordor Intelligence | |||
Rising Demand for Cryogenic Insulation (LNG And LH₂ Projects)
Cryogenic applications require materials that withstand –162 °C for LNG and –253 °C for liquid hydrogen without structural creep or delamination. Composite systems pairing phenolic foam with multilayer barriers are therefore displacing legacy fiberglass, explaining phenolic’s 5.05% growth. In LNG bunkering, insulation integrity safeguards against flash vaporization events that would spike boil-off rates, so ship-to-ship transfer operators specify lower thermal conductivity thresholds. Floating storage and regasification units add complexity because cryogenic CO₂ capture zones demand separate temperature envelopes within the same hull. Suppliers responding with aerogel-reinforced foams gain differentiation while securing early-stage approvals from classification societies. The result is a premium-priced niche that punches above its volume weight yet exerts outsized pull on research and development spending across the cold insulation market.
Growing Need for Energy-Efficiency and Net-Zero Retrofits
EU renovation policy calls for a 3% annual deep-renovation rate, driving EUR 275 billion in yearly spending and tightening U-value ceilings for external walls[1]. Vacuum insulation panels (VIPs) and aerogel sheets solve space-constraint issues in heritage buildings, achieving 35% lower thermal transmittance versus mineral wool while keeping façade thickness unchanged. Retrofit programs such as Energiesprong have validated industrialized over-cladding kits that cut site labor by half, signaling scalable pathways for large housing stocks. Corporate landlords and municipalities consequently rank envelope performance as a top capital-allocation priority, further broadening opportunity for the cold insulation market.
Expansion of Global Cold-Chain Logistics and E-Grocery
E-commerce grocers and pharmaceuticals heighten demand for urban micro-fulfillment hubs that hold –30 °C chambers adjacent to ambient pick stations. Robotics adopted in these sites suffer from condensation-induced sensor faults unless panel joints achieve tight tolerances, making high-density EPS, VIPs, or bio-based polyurethane preferred solutions. Sustainability scorecards add another layer: grocery retailers now request Environmental Product Declarations for facility envelopes, nudging suppliers toward low-embodied-carbon foams that still meet freezer-grade R-values. These intertwined drivers secure a steady pipeline of retrofit and greenfield work for players across the cold insulation industry.
Industrial and Infrastructure Growth in Emerging Markets
India’s Production-Linked Incentive scheme, targeting a 25% manufacturing GDP share by 2025, lifts demand for chilled warehouses supporting vaccine exports and processed foods[2]. Mexico, now the world’s fourth-largest polyurethane consumer, shows how near-shoring bolsters local panel makers supplying appliances and automotive assemblies. Price sensitivity in these markets sustains fiberglass and EPS volumes, yet multinationals still introduce phenolic lines to satisfy export-oriented factories obligated to meet stricter global standards. Over time, maturing building codes and carbon disclosure frameworks are expected to steer procurement toward higher-spec products, lengthening the runway for the cold insulation market.
Restraints Impact Analysis of Cold Insulation Market*
| Restraints | (~) % Impact on CAGR Forecast | Geographic Relevance | Impact Timeline |
|---|---|---|---|
| Volatile petrochemical raw-material pricing | –0.7% | Global, notably polyurethane producers | Short term (≤ 2 years) |
| Shortage of certified installers for aerogel/VIP systems | –0.4% | North America and Europe | Medium term (2-4 years) |
| Lack of awareness about cold insulation materials | –0.3% | Emerging markets | Long term (≥ 4 years) |
| Source: Mordor Intelligence | |||
Volatile Petrochemical Raw-Material Pricing
With 85% of MDI’s cradle-to-gate global-warming potential linked to feedstock inputs, polyurethane makers face both cost and emissions exposure. Diversification into bio-circular feedstocks partially hedges against price volatility, yet scale remains limited to pilot lines. On the demand side, appliance OEMs often delay procurement during price spikes, producing short-run volume dips that ripple through the cold insulation market. Vertical integration, such as Owens Corning’s resin procurement contracts and Kingspan’s pipeline of local MDI storage tanks, softens but does not eliminate the headwind.
Shortage of Certified Installers for Aerogel/VIP Systems
Vacuum panels lose nearly all R-value once punctured, so site crews must be trained to avoid damage and seal joints precisely. Industry leader Armacell instituted a global certification pathway in 2024 to triple the number of qualified contractors by 2027. Still, capacity lags demand, particularly across U.S. and German retrofit programs, where union labor shortages compound scheduling delays. Installation errors, inflating field failure rates, discourage some building owners despite strong modeled paybacks, muting uptake of high-performance solutions across the cold insulation market.
*Our forecasts treat driver/restraint impacts as directional, not additive. The impact forecasts reflect baseline growth, mix effects, and variable interactions.
Cold Insulation Market Segment Analysis
By Material Type:
Polyurethane Dominance Faces Phenolic ChallengeThe polyurethane segment captured 43.62% of the cold insulation market size in 2025, buoyed by mature supply chains and favourable spray-foam economics. Phenolic foam is expanding at a 4.82% CAGR on the strength of LNG and hydrogen projects demanding low flame-spread and robust cryogenic performance. Bio-based polyurethane variants containing 25% recycled or plant-derived polyols lower embodied-carbon footprints by 43% and help manufacturers win public-sector bids.
Competitive intensity inside polyurethane tightens as producers backward-integrate into diisocyanate synthesis to manage price risk. Owens Corning’s 2025 feedstock sourcing program stabilizes margins while enabling bulk purchasing economies. Meanwhile, Kingspan’s Ukraine campus injects new regional capacity, reducing freight emissions and enhancing supply security for Eastern Europe. These moves reinforce the high threshold for new entrants seeking scale inside the cold insulation market.

By Application:
Heating, Ventilation, and Cooling (HVAC) Leadership Challenged by Energy-Sector GrowthHeating, Ventilation, and Cooling (HVAC) held 30.12% the cold insulation market share in 2025, lifted by aggressive renovation targets that specify higher R-values for ducting, chilled-water lines, and rooftop units. Oil and gas is the fastest-rising application at 5.02% CAGR, reflecting LNG liquefaction trains, bunkering modules, and hydrogen storage tanks that require multi-layer cryogenic systems. Cold-chain refrigeration follows closely; demand from e-grocery dark stores and vaccine freezers keeps panel volumes high even when construction cycles soften. Chemical processing plants favour phenolic and cellular-glass solutions where chemical resistance trumps price.
Emerging sub-applications, such as phase-change panels integrated inside HVAC plenum cavities, spawn niche demand for hybrid insulation-plus-energy-storage assemblies. Building owners accept modest cost premiums because load-shifting cuts chiller runtime and peak-demand charges. Taken together, these trends diversify growth vectors beyond traditional building shells, ensuring the cold insulation market remains resilient through macroeconomic swings.
Geography Analysis
APAC Cold Insulation Market
Asia Pacific dominated with 37.35% revenue in 2025 and is projected to add a further 5.4% CAGR to 2031, making it both the largest and fastest region. China’s automation-driven cold-chain overhaul, which deploys autonomous forklifts inside –30 °C warehouses, calls for ultra-low-permeability panel joints to maintain humidity control. India’s policy push for a 25% manufacturing GDP share, coupled with fiscal incentives for cold-store construction, attracts polyurethane suppliers setting up local rigid-foam board lines.
North America, Europe, Middle East and LATAM Cold Insulation Market
North America commands a sizeable slice, supported by federal retrofit tax credits and record LNG export terminal builds along the Gulf Coast. Owens Corning’s new Ohio fiberglass line, slated for 2027, underpins regional supply, while DOE grants accelerate aerogel VIP commercialization that could unlock deeper building retrofits. Europe, though facing sluggish construction output, maintains healthy insulation demand thanks to legally mandated deep-renovation rates. Kingspan and Knauf Insulation expand regional capacity even as energy-price volatility challenges operating margins. Middle East mega-projects such as Qatar’s LNG expansion and Saudi hydrogen hubs apply stringent cryogenic specs that invite aerogel players, while Latin America benefits from refrigeration investments connected to agrifood exports. Collectively, these regional vectors guarantee broad-based opportunity for the cold insulation market.

Value Chain Analysis
Cold insulation value creation starts upstream with petrochemical and mineral inputs: MDI/TDI and polyols for polyurethane systems, polystyrene resins for EPS/XPS, phenolic resins, and mineral feedstocks for stone wool and fiberglass, plus blowing agents, facers, vapor barriers, and fire-performance additives. These inputs flow into formulation and conversion steps such as foam board and pipe-section manufacturing, aerogel blanket production, and composite cryogenic system fabrication, followed by testing and certification and application engineering for LNG, HVAC piping, and cold-chain facilities.
Downstream, distribution runs through insulation converters, mechanical insulation contractors, HVAC wholesalers, and OEM channels (appliances, refrigerated storage, and industrial refrigeration). The chain is increasingly shaped by regional manufacturing and near-market warehousing as lead times and freight constraints affect both chemicals and finished goods; Europur highlighted logistics disruptions in May 2026, and isocyanate cargo availability has been a particular bottleneck. Capacity additions and localization moves, including ROCKWOOL breaking ground on a USD 175 million stone wool facility in Wallula, Washington (April 2026) and IKO starting construction on a USD 45 million XPS plant in Brantford, Ontario (June 2026), support a supply model centered on local production to reduce duty and transport exposure while enabling just-in-time delivery for cold-chain and retrofit projects.
Competitive Landscape
The cold insulation market is moderately fragmented, yet capital-intensive. Owens Corning, Kingspan, Armacell, and Knauf Insulation headline the tier-one group, combining global brands with vertically integrated feedstock positions. Technology differentiation dominates market-share battles. Aerogel VIPs, non-isocyanate foams, and phase-change-enhanced boards allow suppliers to secure LEED and BREEAM credits for projects chasing tax incentives. Installer certification programs, pioneered by Armacell, further lock in customers by guaranteeing field performance, a competitive moat when contractor scarcity persists.
Cold Insulation Industry Leaders
-
Owens Corning
-
Armacell
-
Aspen Aerogels Inc.
-
BASF
-
ROCKWOOL A/S
- *Disclaimer: Major Players sorted in no particular order
Cold Insulation Market Companies Covered in this Report
- Armacell
- Aspen Aerogels Inc.
- BASF
- Carlisle Companies Inc.
- Covestro AG
- Dongsung Finetec
- Dow
- Huntsman International LLC
- International Corrosion Services LLC
- Kingspan Group
- Knauf Insulation
- Owens Corning
- ROCKWOOL A/S
- Saint-Gobain
Market Opportunities and Future Outlook
Opportunity whitespace concentrates where performance requirements tighten and installation constraints are most pronounced: cryogenic LNG and liquid-hydrogen adjacent assets needing multilayer, low-permeability systems; space-constrained retrofit envelopes where aerogel sheets and vacuum insulation panels help address thickness limits; and industrial refrigeration and cold-chain nodes where condensation control and corrosion mitigation push system-level specifications rather than commodity material selection. Reported demand pull from temperature-controlled logistics and deep-renovation programs supports more packaged solutions that combine insulation, vapor management, and accessories, increasing the value per project beyond board or blanket volumes.
On the supply side, material innovation and capacity regionalization create space for differentiated entrants and partnerships. Armacell’s 2024 contractor certification pathway (to expand qualified installers for advanced systems) addresses a documented adoption constraint for aerogel/VIP installations, while manufacturers continue to invest in regional output to shorten lead times and improve supply assurance. Owens Corning’s refrigeration-focused FOAMULAR XPS Pipe Insulation System completion (built around its food-grade PINK Pipe Gel FG launch in May 2026) also reflects this shift toward application-specific, compliance-friendly offerings for food, beverage, and cold storage operators, where buyers increasingly prioritize repeatable performance and easier installation workflows.
Recent Industry Developments in Cold Insulation Market
- May 2026: Owens Corning launched PINK Pipe Gel FG, a food-grade corrosion inhibitor positioned to complete its FOAMULAR XPS Pipe Insulation System for ammonia refrigeration applications. The initiative targets food, beverage, and cold storage operators that need corrosion control and hygienic materials alongside freezer-grade thermal performance, strengthening system-level specification pull.
- June 2025: Armacell inaugurated its aerogel insulation manufacturing facility in Pune, India, expanding output to include ArmaGel XGH and ArmaGel XGC product lines and doubling aerogel blanket capacity. The added APAC capacity supports faster supply for dual-temperature and cryogenic projects and improves Armacell’s ability to serve large, schedule-driven industrial accounts.
- October 2024: Carlisle Companies acquired Plasti-Fab for USD 259.5 million, expanding its polystyrene insulation platform across North America. The deal increased Carlisle’s footprint in EPS/XPS-related products used in refrigeration, building envelopes, and cold-chain applications, improving scale in a region where contractors value dependable local supply.
Cold Insulation Market Report Scope and Research Methodology
Market Definition and Coverage
This market covers the value of materials and systems used to reduce heat gain and control condensation on equipment, piping, ducts, and vessels operating below ambient temperatures in industrial and commercial settings.
Scope exclusions: We exclude active cooling equipment (such as chillers and compressors), standalone cold storage construction, and routine maintenance labor that is not tied to insulation material demand.
Segments Covered in This Report
- By Material Type
- Polyurethane Foam
- Fiberglass
- Polystyrene Foam
- Phenolic Foam
- By Application
- Oil and Gas
- Chemicals
- Heating, Ventilation, and Cooling (HVAC)
- Refrigeration
- By Geography
- Asia-Pacific
- China
- India
- Japan
- South Korea
- Australia
- New Zealand
- Rest of Asia-Pacific
- North America
- United States
- Canada
- Mexico
- Europe
- Germany
- United Kingdom
- France
- Italy
- Russia
- Rest of Europe
- South America
- Brazil
- Argentina
- Rest of South America
- Middle-East and Africa
- Saudi Arabia
- United Arab Emirates
- Qatar
- South Africa
- Egypt
- Rest of Middle-East and Africa
- Asia-Pacific
Data Sources, Market Sizing, and Validation
Desk Research
Desk research was used to build the demand context and to set practical boundaries on what should and should not be counted as cold insulation spend. We referenced public sources such as the International Energy Agency for energy intensity signals, UN Comtrade for insulation material trade flows, the US Energy Information Administration for oil and gas and LNG indicators, and US Census Bureau construction data for nonresidential activity that influences HVAC and refrigeration builds.
To connect those signals to market value, we also reviewed manufacturer sustainability reports, annual filings, and investor decks, along with building energy code and refrigeration safety updates published by regulators. Patent databases helped identify where material innovation is concentrated, including phenolic formulations and aerogel related work, which then informed pricing and adoption assumptions. For company-level benchmarking and news cross checks, we used our internal subscriptions for company financials and news, and we selectively used shipment level import export data where it clarified material movements. These examples are not exhaustive, and other public sources were used as well for data collection, validation, and research clarification.
Primary Interviews and Surveys
Primary work focused on validating how cold insulation demand forms in real projects, and how pricing is negotiated across industrial plants, cold chain operators, and mechanical contractors. We interviewed a mix of material suppliers, fabricators, distributors, EPC and MEP contractors, and large end users across APAC, EMEA, and the Americas, so regional mix, code requirements, and project timing could be reflected in the final model.
Distribution of primary research fieldwork respondents
| Company type | Respondent position | Region |
|---|---|---|
| Top tier: 32% | CXOs: 13% | APAC: 45% |
| Mid tier: 53% | Functional/Unit leaders: 28% | EMEA: 34% |
| Smaller Players: 15% | Managers: 59% | Americas: 21% |
Market-Sizing & Forecasting
Sizing started with a top-down build where industrial activity and temperature controlled infrastructure indicators were translated into insulation demand pools by application, and then priced into value using region specific average selling price ranges. To keep the model workable, we relied on a limited set of repeatable inputs such as LNG and gas processing additions, refinery and chemical capex signals, cold chain capacity additions, HVAC installation intensity in nonresidential buildings, and published polymer and fiber price movements that influence insulation pricing.
Those totals were then corroborated with selective bottom-up approximations, including sampled supplier revenue splits, channel checks with distributors and contractors, and volume times ASP sanity checks for common material forms. Where direct volume indicators were thin, we used proxy ratios such as insulated surface area per project type and typical replacement cycles, then reviewed those assumptions against interview feedback. For forecasting, we ran scenario analysis around project cycles and raw material cost pass-through, and we adjusted scenario weights based on the consensus on pipeline timing, refrigeration expansion, and retrofit momentum.
Data Validation & Update Cycle
Validation was done in steps so that the model did not rely on a single data stream. Outputs were checked against independent signals like industrial production trends, construction starts, and trade movements, and then variances were investigated before numbers were finalized. When a region or application showed an unusual swing, we rechecked the scope mapping and followed up with select experts to confirm whether it was a one-time project effect or a real demand shift.
Each report is refreshed annually, and interim updates are triggered when material events occur, such as sharp feedstock price changes, major LNG project decisions, or code updates that influence insulation choices. Before delivery, an analyst performs a fresh pass across the key inputs so clients receive the latest updated view.
Mordor Intelligence's Cold Insulation Market Sizing Compared With Other Published Estimates
Published market values for cold insulation often do not match because the scope line is drawn differently and the pricing logic is not updated in the same way across sources. Timing can also differ, since some studies lock currency conversion early in the year while others adjust later, changing the reported USD totals.
In our work, the biggest drivers of spread are usually whether adjacent items, such as broader industrial insulation or installed service bundles, are counted, and how quickly average selling prices are allowed to move with polymer and fiber inputs. The refresh cadence and the month used for FX conversion can also shift the base year value, and the tighter validation loop using application level demand checks is what keeps the estimate grounded, which is handled through Mordor Intelligence.
Benchmark comparison
| Source | Market Size | Gaps in Research Methodology |
|---|---|---|
| Mordor Intelligence | USD 7.60 B (2026) | |
| Trade Publisher A | USD 6.81 B (2024) | Uses an earlier base year and a faster growth path, and its scope appears to include a wider list of material types and end uses, which can inflate totals when industrial and commercial boundaries are not separated cleanly. |
| Industry Platform B | USD 7.70 B (2024) | Published as a materials-only view with limited visibility on how ASPs are rolled forward and converted to USD, which can shift the final value when resin and fiber price swings are high. |
The table indicates that year selection and pricing treatment explain a large share of the gap, even before regional mix is considered. By keeping the scope tied to cold temperature applications and by updating FX and ASP assumptions in line with observable cost and demand signals, the final market value remains traceable to clear inputs and can be repeated in future refreshes.
Key Questions Answered in the Report
What is the projected value of the cold insulation market by 2031?
It is expected to reach USD 9.54 billion, growing at a 4.65% CAGR.
Which region leads the cold insulation market?
Asia Pacific holds 37.35% of revenue and also records the fastest 5.4% CAGR.
Why is phenolic foam gaining share in cold insulation applications?
Superior fire resistance and cryogenic stability make it the preferred choice for LNG and hydrogen projects.
How do volatile diisocyanate prices influence insulation suppliers?
Price swings compress polyurethane margins by up to 25%, pushing producers toward vertical integration and bio-based feedstocks.
What hinders faster adoption of aerogel and vacuum insulation panels?
A shortage of certified installers raises field failure risks, delaying project schedules and limiting uptake.