
Coconut Products Market Size and Share
Market Overview
| Study Period | 2021 - 2031 |
|---|---|
| Market Size (2026) | USD 8.96 Billion |
| Market Size (2031) | USD 12.90 Billion |
| Growth Rate (2026 - 2031) | 7.57 % |
| Fastest Growing Market | Asia Pacific |
| Largest Market | Asia Pacific |
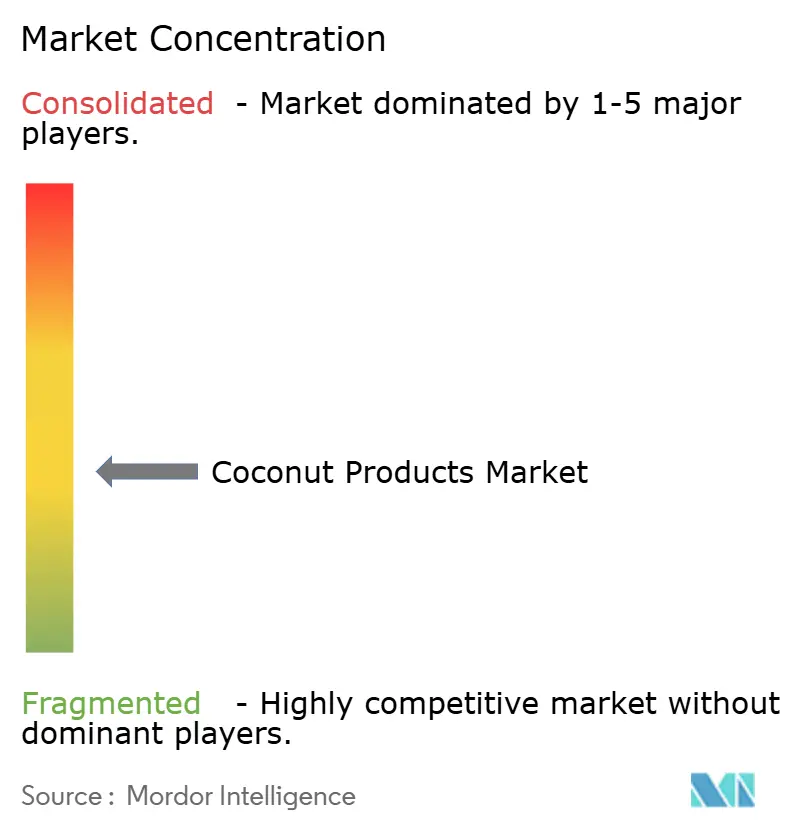
| Market Concentration | Medium |
Major Players *Disclaimer: Major Players sorted in no particular order Image © Mordor Intelligence. Reuse requires attribution under CC BY 4.0. | |
Coconut Products Market Analysis by Mordor Intelligence
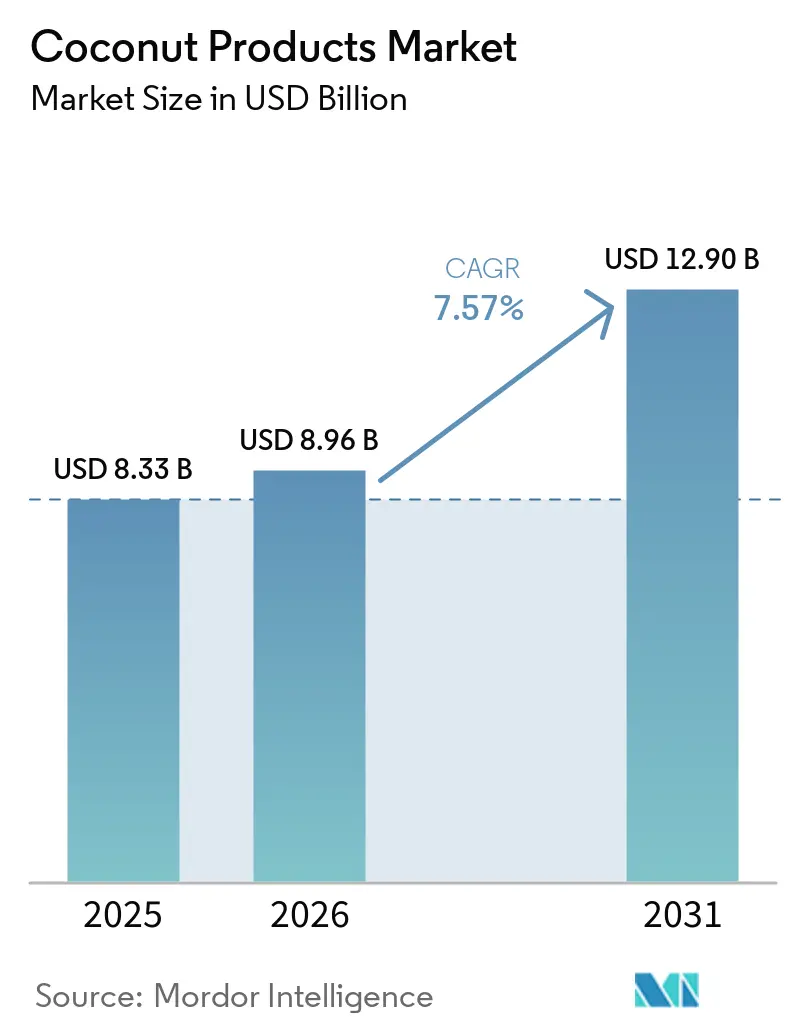
The Coconut Products Market size was valued at USD 8.33 billion in 2025 and is estimated to grow from USD 8.96 billion in 2026 to reach USD 12.90 billion by 2031, at a CAGR of 7.57% during the forecast period (2026-2031). This sustained expansion stems from rising demand for plant-based nutrition, clean-label ingredients, and functional hydration solutions that coconut-derived offerings uniquely satisfy. The Asia-Pacific region remains pivotal because the Philippines, Indonesia, Thailand, and India supply more than 70% of the world's coconuts, giving processors a structural cost advantage over import-reliant buyers in North America and Europe, according to the International Coconut Community. Liquid formats, such as coconut water and milk, continue to dominate retail shelves, yet solid and powder forms are gaining traction as ambient-stable solutions for bakery, confectionery, and sports nutrition blends. Rapid e-commerce adoption is enabling niche labels to bypass traditional gatekeepers and target health-conscious millennials who reward organic, fair-trade, and sustainability claims with brand loyalty. Competitive intensity remains moderate, as no single firm exceeds a low double-digit share, forcing incumbents and challengers alike to secure raw material supplies through vertical integration and long-term grower contracts.
Key Report Takeaways
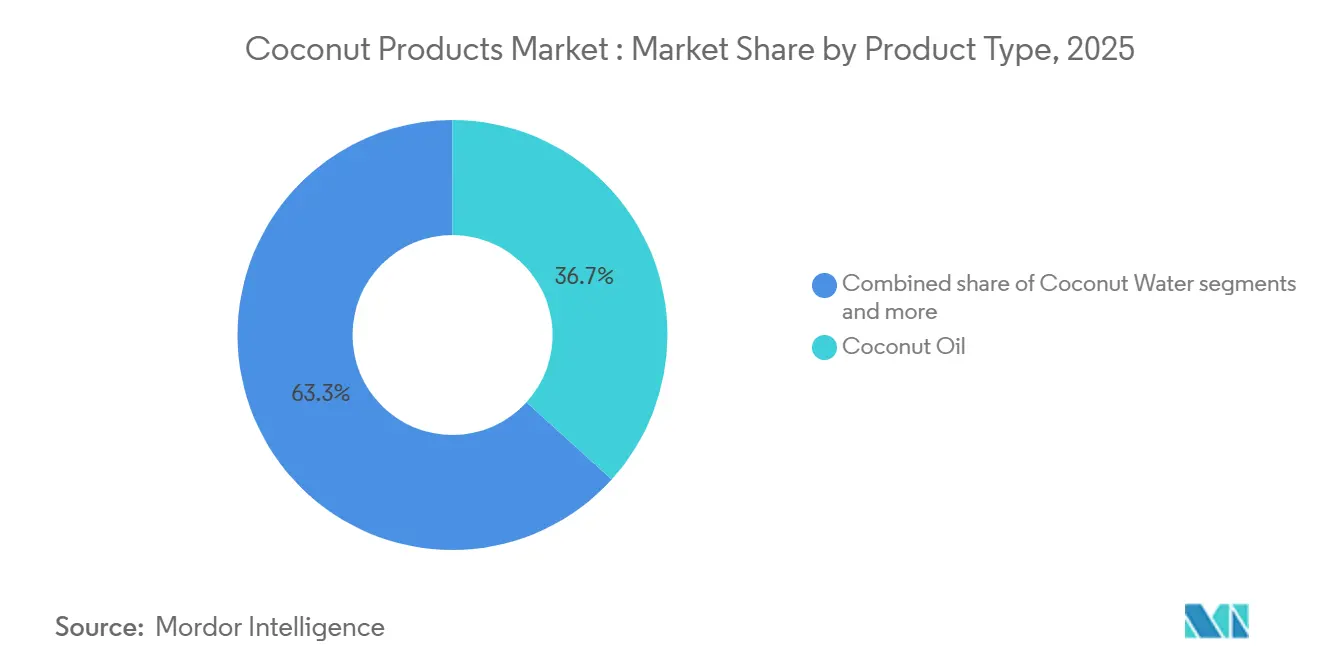
- By product type, coconut oil led with 36.72% revenue share in 2025; coconut milk is projected to expand at an 8.82% CAGR through 2031.
- By form, liquid formats accounted for 72.39% share of the coconut products market size in 2025, while solid and powder formats are advancing at a 9.64% CAGR to 2031.
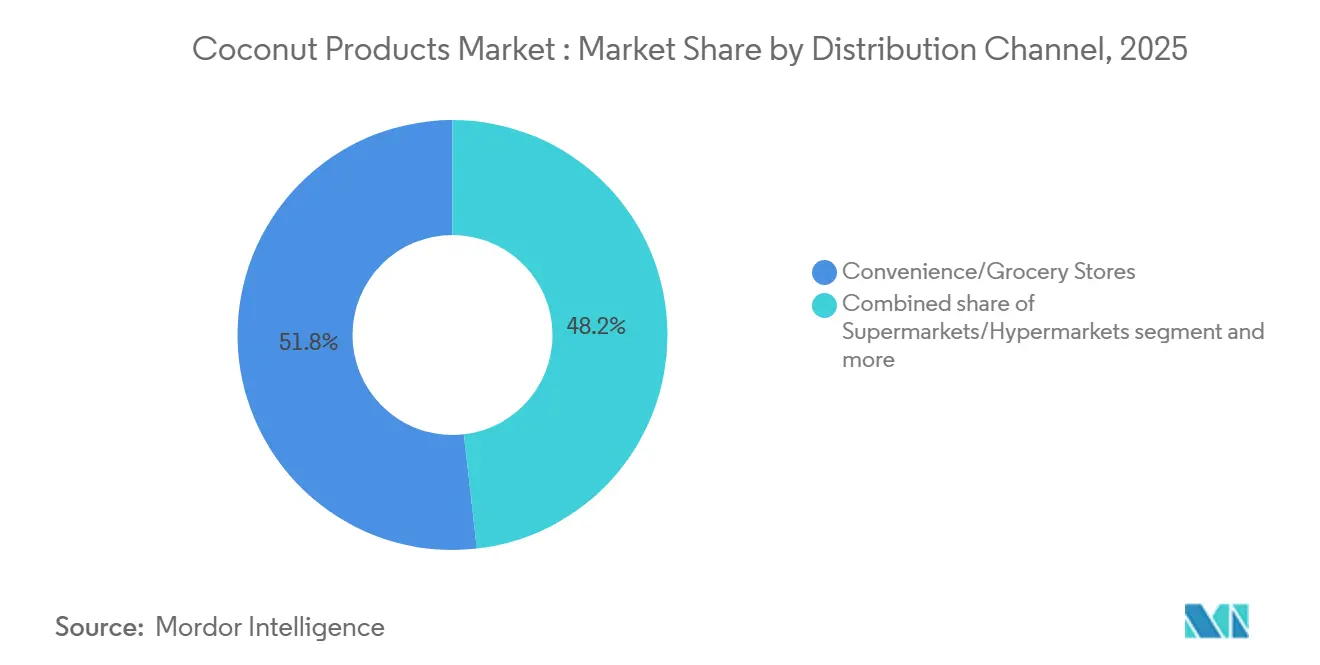
- By distribution channel, convenience and grocery stores held 51.81% of the coconut products market share in 2025, while online retail stores are projected to expand at a 9.98% CAGR through 2031.
- By geography, the Asia-Pacific region captured a 34.85% share of the coconut products market size in 2025 and is expected to expand at a 9.49% CAGR through 2031.
Note: Market size and forecast figures in this report are generated using Mordor Intelligence’s proprietary estimation framework, updated with the latest available data and insights as of January 2026.
Market Trends and Insights
Drivers Impact Analysis of Coconut Products Market *
| Driver | (~) % Impact on CAGR Forecast | Geographic Relevance | Impact Timeline |
|---|---|---|---|
| Rising health consciousness driving demand for natural and plant-based products | +1.8% | Global with focus on North America and Europe | Medium term (2–4 years) |
| Coconut water gaining popularity as a low-calorie hydration beverage | +1.2% | North America, Europe, expanding to Asian cities | Short term (≤ 2 years) |
| Growth in vegan and dairy-free diets boosting demand for coconut milk and cream | +1.5% | Global, led by North America and Europe | Medium term (2–4 years) |
| E-commerce platforms expanding access to premium and organic coconut products | +0.9% | Global, strongest in developed markets | Short term (≤ 2 years) |
| Growth of ayurveda and traditional medicine is reviving interest in coconut-based remedies | +0.8% | Asian core, spill-over to North America wellness markets | Long term (≥ 4 years) |
| Increasing global culinary use of coconut products is driving demand | +1.0% | Global, with regional variations in product preferences | Medium term (2–4 years) |
| Source: Mordor Intelligence | |||
Rising health consciousness is driving demand for natural and plant-based products
As consumers become more health-conscious, they're increasingly turning to coconut products, viewing them as natural alternatives to both processed foods and synthetic supplements. The 2025 United States Dietary Guidelines Advisory Committee has recommended replacing saturated fats with plant-based alternatives, further boosting the appeal of coconut oil. This regulatory nod not only spurs innovation in premium-priced virgin coconut oil and MCT (medium-chain triglyceride) oil derivatives but also underscores their perceived health advantages, such as improved metabolism and potential cardiovascular benefits[1]. Additionally, the growing awareness of the environmental impact of food choices has positioned coconut products as sustainable options, aligning with the preferences of eco-conscious consumers. With the rising demand for clean-label products and the trend towards functional foods, coconut products are carving out a niche, satisfying both taste and wellness needs. These dynamics, combined with increasing consumer education on the benefits of plant-based alternatives, point to a robust growth trajectory for coconut products, suggesting a continued market expansion in the years ahead.
Coconut water gaining popularity as low-calorie hydration beverage
Coconut water is steadily replacing traditional sports drinks as consumers favor natural electrolytes with fewer calories and no added sugars, appealing strongly to health-conscious buyers. It offers hydration comparable to isotonic beverages while naturally providing potassium and magnesium. Brands are capitalizing on this shift, with The Vita Coco Company launching Vita Coco Spiked to tap into higher-margin alcoholic segments. E-commerce further fuels growth by effectively communicating functional and sustainability benefits. At the same time, advances in UHT processing, such as Tetra Pak’s Direct Ultra High Temperature (UHT) technology, have extended shelf life and expanded reach into markets with limited cold-chain infrastructure. These innovations have enabled product launches, such as Tata Consumer Products’ Lyfe+ coconut water in 2025, reinforcing coconut water’s competitive position in the global beverage market.
Growth in vegan and dairy-free diets boosting demand for coconut milk and cream
Rising dairy avoidance, driven by lactose intolerance, ethical considerations, and health perception, is expanding demand for coconut milk and cream, especially in foodservice and bakery applications where functionality and flavor are critical. In the U.S., 40% of adults consumed plant-based meat or dairy alternatives in 2024, with 24% doing so monthly, and coconut-based products hold a notable share despite competition from oat and almond products, according to the Good Food Institute[2]. Coconut milk’s high fat content and creamy texture make it a preferred option for dairy-free lattes, ice creams, and yogurts, where other alternatives struggle to match dairy's richness. This strength is reflected in The Coconut Collab’s GBP 1.5 million Series B raise in January 2024, which supports European expansion and highlights the resilience and defensible position of coconut-based products in indulgent plant-based dairy categories.
Growth of ayurveda and traditional medicine reviving interest in coconut-based remedies
Coconut oil, particularly virgin coconut oil, is experiencing renewed demand in India and Southeast Asia as consumers reconnect with traditional wellness practices, supported by the AYUSH Ministry's policies that promote Ayurvedic formulations. Used in roughly 40% of Ayurvedic medicines, coconut oil is benefiting from efforts to integrate traditional medicine into mainstream healthcare, boosting both domestic demand and export potential for certified organic and virgin variants. This has created a bifurcated market: low-margin commodity coconut oil for cooking and industrial use, and premium virgin coconut oil positioned for health and wellness applications. Brands such as Nutiva have capitalized on this shift by marketing Fair Trade Certified Virgin Coconut Oil, which undergoes extensive third-party testing, thereby appealing to transparency-driven consumers. As Ayurvedic-inspired wellness gains traction in Western markets, coconut oil is increasingly viewed as a functional health product rather than a basic cooking staple, which supports higher price points and reduces exposure to commodity price fluctuations.
Restraints Impact Analysis of Coconut Products Market *
| Restraint | (~) % Impact on CAGR Forecast | Geographic Relevance | Impact Timeline |
|---|---|---|---|
| Price volatility due to weather-sensitive coconut farming affects market stability | -1.4% | Global, concentrated in Asia-Pacific producing regions | Short term (≤ 2 years) |
| Limited shelf life of fresh coconut products hampers supply chain efficiency | -0.8% | Global, acute in regions distant from production centers | Medium term (2–4 years) |
| Competition from alternative plant-based ingredients (e.g., almond, oat) limits growth | -1.1% | North America and Europe primarily, expanding to urban Asia-Pacific region | Medium term (2–4 years) |
| High processing and export costs reduce margins for manufacturers | -0.7% | Asia-Pacific producing regions, affecting global competitiveness | Long term (≥ 4 years) |
| Source: Mordor Intelligence | |||
Price volatility due to weather-sensitive coconut farming affecting stability
Coconut farming is highly exposed to typhoons, droughts, and erratic monsoons, with climate shocks in 2024 quickly translating into supply shortages and price volatility. In the Philippines, Typhoons Kristine and Pepito damaged nearly 39,000 hectares of coconut farms, affecting over 1.2 million farmers and causing losses exceeding USD 20 million, while El Niño-driven droughts cut Indonesian yields by 15–20%, raising coconut oil production costs. These disruptions led to sharp export price increases, with desiccated coconut prices rising 26% year-over-year in the Philippines, 76.8% in Indonesia, and 62% in Sri Lanka[3]. For food manufacturers in North America and Europe, this volatility strains procurement planning, forcing a choice between margin erosion and higher consumer prices, and weakening competitiveness versus oat and almond alternatives with more stable supply chains.
Limited shelf life of fresh coconut products hampers supply chain efficiency
Fresh coconut water typically lasts only 24-48 hours without processing, prompting manufacturers to adopt high-pressure processing (HPP), ultra-high-temperature (UHT) treatment, or aseptic packaging, each of which adds cost and impacts taste or nutrient retention. HPP preserves bioactive compounds and fresh flavor, offering a 30-45 day shelf life, but requires expensive equipment and continuous cold-chain logistics, which limits its application to premium brands targeting health-conscious consumers. UHT extends shelf life to 12 months, eliminating cold-chain requirements, but diminishes flavor and nutrients, making it suitable for price-sensitive segments. This trade-off creates a bifurcated market: premium HPP brands, such as Vita Coco, command higher prices, while UHT-based private-label and value brands compete on cost. For coconut milk and cream, aseptic packaging enhances shelf life and enables ambient distribution; however, high capital requirements remain a barrier for smaller processors in the Philippines, Indonesia, and Thailand.
*Our forecasts treat driver/restraint impacts as directional, not additive. The impact forecasts reflect baseline growth, mix effects, and variable interactions.
Coconut Products Market Segment Analysis
By Product Type:
Coconut Milk Accelerates as Dairy-Free Demand SurgesCoconut milk is projected to grow at an 8.82% CAGR through 2031, fueled by rising demand for creamy dairy alternatives that perform well in coffeehouse drinks, ready meals, and other prepared foods. While coconut oil remains the largest segment, holding a 36.72% market share in 2025, its dominance is gradually declining amid growing scrutiny of saturated fats. Desiccated coconut remains a staple in baking applications, while niche products like coconut sugar appeal to diabetic and health-conscious consumers, despite their higher price points. The Vita Coco Company’s 15% revenue increase to USD 463.8 million in the first nine months of 2024 demonstrates how beverage-focused brands can accelerate growth by layering new coconut-milk SKUs onto existing water supply chains.
Shifts in consumer behavior are further driving the mainstream adoption of coconut milk. In the U.K., the rise of café culture and plant-based trends has led to 27% of households purchasing plant-based milk monthly, expanding opportunities for coconut milk across retail and foodservice channels. Thailand’s Theppadungporn Coconut, which exports 95% of its output, reported USD 262 million in nine-month revenue on strong coconut milk shipments, highlighting how specialist processors leverage global foodservice demand. Collectively, these trends position coconut milk as the primary growth engine of the coconut products market, supported by both domestic adoption and international export opportunities.

By Form:
Solid and Powder Formats Gain Ground in Ambient-Stable ApplicationsSolid and powder coconut derivatives, including desiccated coconut, coconut flour, and milk powder, are growing at a 9.64% CAGR, outpacing liquid forms that require cold-chain logistics. Although liquids still account for 72.39% of the segment in 2025, rising freight costs and carbon-reduction mandates are shifting demand toward lightweight, dry ingredients that can be rehydrated on-site. Philippine desiccated coconut exports increased 9.5% to 81,728 metric tons in the first half of 2024, with the United States and the Netherlands absorbing most shipments, according to the International Coconut Community. This trend reflects a broader move toward more sustainable, logistically efficient formats that maintain performance while reducing transportation and storage costs.
Processors are also creating value through certification and sustainable practices to capture premium segments. Nutiva’s acquisition of Coconut Secret expands its portfolio to include coconut aminos, targeting soy-free Asian sauces where organic and fair-trade credentials drive brand loyalty. Similarly, Century Pacific Food’s USD 40 million acquisition of Coco Harvest integrates renewable energy from coconut shells, aligning operations with European carbon reporting standards and enhancing gross-margin resilience. Together, these initiatives demonstrate how product innovation, certification, and sustainability are reshaping the solid and powdered coconut segment while supporting profitability and global competitiveness.
By Distribution Channel:
Online Retail Disrupts Grocery DominanceConvenience and grocery outlets still account for 51.81% of coconut products sales, but online retail is expanding rapidly at a 9.98% CAGR, driven by younger consumers who favor subscriptions and digital touchpoints that highlight ingredient transparency, sourcing, and sustainability. Platforms like Thrive Market and Amazon Fresh showcase certifications, sustainability badges, and user reviews that encourage trial of emerging coconut SKUs, broadening the category and accelerating adoption, according to the Organic Trade Association. Direct-to-consumer channels have become a key growth engine for premium brands, with Califia Farms citing DTC (Direct-to-Consumer) sales in its SEC filings as evidence of the scalability of online storytelling for coconut beverages. These channels allow brands to communicate provenance, functional benefits, and wellness claims more effectively than traditional retail, fostering deeper consumer engagement and loyalty.
At the same time, supermarkets and convenience stores are expanding their private-label coconut assortments to protect foot traffic, putting pressure on branded products unless they can differentiate through functionality, taste, or sustainability narratives. This evolving retail landscape underscores the importance of agile fulfillment, inventory visibility, and supply-chain responsiveness. Brands that combine high-quality products with compelling digital storytelling and efficient delivery are best positioned to capture market share over the next five years, leveraging both e-commerce growth and traditional retail presence to drive trial, repeat purchases, and long-term loyalty.
Geography Analysis
APAC Coconut Products Market
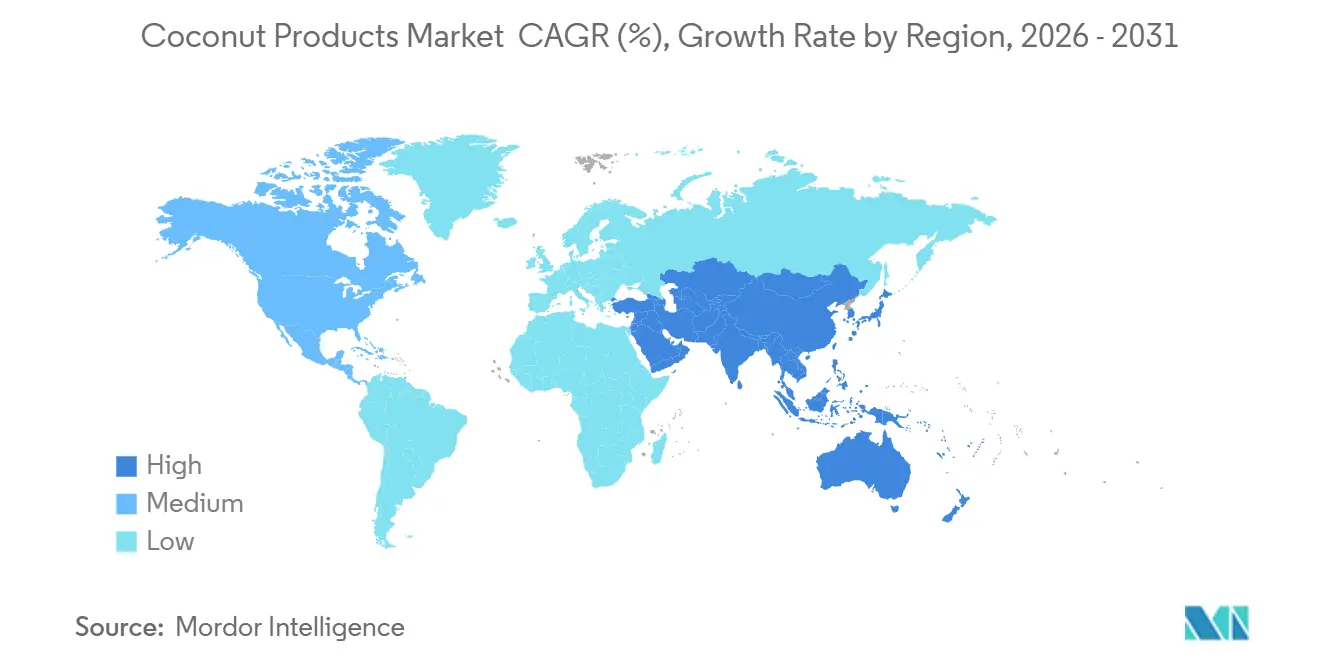
Asia-Pacific leads the coconut products market with a 34.85% share in 2025 and is projected to grow at a 9.49% CAGR through 2031, driven by integrated farming and processing ecosystems that provide proximity to raw materials and favorable labor economics, according to the International Coconut Community. The Philippines produced 2.56 million metric tons of copra in 2024/25 and maintained USD 482 million in coconut exports during Q1 2024 despite typhoon-related losses, highlighting the sector’s structural resilience, per the Philippine Coconut Authority[4]. Thailand exported USD 341.11 million in coconut milk in the first ten months of 2024, with 70.5% destined for the United States, reflecting the country's export-focused orientation, according to Thailand’s Ministry of Commerce.
North America and Europe Coconut Products Market
India harvested 21.37 billion coconuts in FY24 and shipped USD 452 million in value-added coconut products, supported by a resurgence in Ayurveda and growing demand from the EU for organic grades, as noted by the Coconut Development Board. These dynamics position the Asia-Pacific region as the backbone of global supply chains, catering to both domestic consumption and international demand. North America and Europe rely heavily on imports, underscoring the importance of traceability, certifications, and quality assurance in maintaining consumer trust. The European Union imported 105,104 metric tons of coconuts valued at USD 156 million in 2023, with the Netherlands re-exporting 47% to regional processors, according to Eurostat. U.S. organic food sales reached USD 71.6 billion in 2024, driving demand for certified coconut milk and yogurt, per the Organic Trade Association, while USDA (U.S. Department of Agriculture) quarantine rules under 7 CFR Part 319 impose strict phytosanitary controls, raising compliance costs but ensuring pest-free entry.
MEA and South America Coconut Products Market
South America, the Middle East, and Africa contribute smaller volumes but offer growth potential through urbanization and tourism. Brazil imported 11,579 metric tons in 2023, and the United Arab Emirates (UAE) imported 75,848 metric tons valued at USD 40.9 million, establishing Dubai as a logistics hub for Gulf Cooperation Council states, according to the World Integrated Trade Solution (WITS). South Africa and Nigeria show rising personal-care demand for coconut oil, yet import-dependent supply chains highlight opportunities for joint ventures with Asia-Pacific processors to develop local packaging and distribution.
Value Chain Analysis
The coconut products value chain begins with smallholder farms and estate growers supplying coconuts that pass through harvest contractors, local traders and commission agents, and aggregation nodes such as cooperatives and farmer producer companies (FPCs) before reaching primary processors. Upstream constraints influence throughput and costs, including aging palms, insufficient replanting, limited improved planting material, and climate shocks (drought, El Nino, and typhoons) that tighten raw material availability. For export-oriented categories such as coconut milk and cream, coconut water, oil, desiccated coconut, and sugar or syrup, processors increasingly rely on structured offtake arrangements and longer-term grower programs to reduce spot-market volatility. New plantings typically require about 4 to 5 years to reach meaningful yields.
Midstream value addition is concentrated in producing regions, particularly across Asia-Pacific, where processors use technologies such as UHT and aseptic packaging and high-pressure processing (HPP) to extend shelf life and enable ambient distribution. Downstream, products move through importers, distributors, and modern retail, while online retail and direct-to-consumer models support premium, certified, and functional positioning. Bottlenecks include fragmented traceability across multi-tier sourcing, high inland logistics and harvesting costs, and infrastructure gaps that limit coordinated post-harvest handling. Initiatives such as the Sustainable Coconut Partnership (SCP) Sustainable Coconut Charter (including supply chain and chain-of-custody modules, with the Origin Standard V1.1 finalized in October 2025) provide a common framework for transparency that supports market access. Evidence from February 2026 stakeholder analysis in North Kolaka, Indonesia, highlights practical value-chain upgrades with near-term impact, including shared processing facilities, post-harvest training, cooperative strengthening, replanting programs, and formal offtake contracting.
Competitive Landscape
The coconut products market is moderately fragmented, with the top five players, Zico Rising, Ducoco Alimentos, The Vita Coco Company, Coco do Vale, and Sambu Group, holding a meaningful but non-dominant share. Competitive dynamics center on securing a reliable supply, effective brand storytelling, and diversifying distribution channels to enhance market reach. For example, the Vita Coco Company secured 90 million liters of coconut water through a five-year agreement with Century Pacific Food, supporting a USD 40 million expansion of processing lines and a farmer seedling initiative to plant 10 million trees by 2030. These strategies demonstrate how leading brands utilize scale, long-term supply agreements, and sustainability initiatives to maintain their market relevance.
Regional specialists and innovators are also scaling to capture growth opportunities. Thailand’s Theppadungporn Coconut generated USD 262 million in nine-month revenue, underscoring the country’s export strength, while the Philippines’ Axelum Resources is doubling desiccated coconut capacity to meet European bakery demand. Nutiva’s acquisition of Coconut Secret positions it to lead the soy-free condiment segment, demonstrating how bolt-on deals can expand category reach.
Technology adoption, including high-pressure processing (HPP) and aseptic packaging, extends shelf life and supports premium pricing, enabling smaller players to compete effectively even amid private-label pressure. Interest from private equity and strategic investors remains strong, as reflected in Califia Farms’ IPO prospectus, signaling confidence in differentiated beverage portfolios that blend coconut with oat and almond bases. Together, these trends point to a phase of selective consolidation, where companies deploy capital to secure certified supply chains and proprietary processing capabilities while defending market share.
Coconut Products Industry Leaders
-
Zico Rising, Inc.
-
Ducoco Alimentos SA
-
The Vita Coco Company, Inc.
-
Coco do Vale
-
Sambu Group
- *Disclaimer: Major Players sorted in no particular order
Coconut Products Market Companies Covered in this Report
- Coco do Vale
- Zico Rising, Inc
- Ducoco Alimentos S.A.
- The Vita Coco Company, Inc.
- Sambu Group
- Coconut Palm Group
- Theppadungporn Coconut Co.
- Danone S.A.
- Zhejiang New Dekay Co., Ltd.
- Thai Coconut Public Company Limited
- Edward & Sons Trading Co.
- Thaitan Foods International Co., Ltd.
- McCormick & Company, Inc.
- Califia Farms, LLC
- The Charoen Pokphand Group Company Ltd
- Axelum Resources Corp.
- Celebes Coconut Corporation
- Windmill Organics Limited
- Coconut Merchant
- Greenfield Products, LLC
Market Opportunities and Future Outlook
Capacity build-out and vertical integration across Southeast Asia are creating whitespace for value-added coconut ingredients, including UHT coconut milk and water, concentrated formats, and specialty oils. These formats are less dependent on cold chain and are more suited to long-distance export. Investment momentum supports this opportunity: Century Pacific Food committed about USD 45 million to acquire and upgrade an integrated facility in Tupi, South Cotabato (announced in 2025), IOI Corp and Mega Star Holding began development of a USD 24 million coconut mill complex in Johor in January 2026, and Asia Ingredients Group broke ground on a USD 24.2 million processing plant expansion in Vinh Long, Vietnam in May 2026. Together, these moves align with demand for ambient-stable liquids and solids and powders that reduce logistics intensity for North American and European buyers.
Traceability, sustainability assurance, and origin verification are also being used as commercial enablers for export programs, shifting upside toward premium and certified segments rather than only commodity trade. The Sustainable Coconut Charter Assurance System (effective March 1, 2025) sets standardized expectations around traceability, environmental protection, and human-rights due diligence, and country-level actions support compliant supply, including the Philippines NSC on Coconut Policy Resolution No. 01, Series of 2025, which mandates stricter enforcement against illegal coconut tree cutting. On the demand and trade-interface side, the Viet Nam Coconut Association program to digitalize and map controlled organic raw-material areas using UAVs and satellite imagery offers an investable route for exporters to document compliant sourcing, shorten verification cycles, and coordinate processing expansion. Separately, early-stage pilots in AI-enabled grading and route optimization reported in 2026 academic work create another opportunity for processors and aggregators aiming to reduce post-harvest losses and transport costs, especially where collection hubs feed centralized plants.
Recent Industry Developments in Coconut Products Market
- May 2026: Asia Ingredients Group broke ground on the Asia Coconut Processing Plant II in Vinh Long province, Vietnam, with a total investment reported at USD 24.2 million and a planned 2027 startup. The 60,000 sq.m project adds processing capacity closer to raw material areas and supports a shift toward higher value-added coconut exports. It also intensifies competitive pressure on regional suppliers that rely on lower-value, less processed shipments.
- February 2025: Ducoco Alimentos S.A. filed for bankruptcy protection in Brazil amid financial distress and elevated debt burdens reported in local business press. The restructuring process can disrupt procurement and customer fulfillment in the near term, particularly for buyers dependent on incumbent supply relationships in Brazil. It also creates openings for competing brands and importers to capture shelf space and private-label contracts.
- July 2024: Califia Farms, LLC launched Organic Coconut Milk for use across cereal, coffee, baking, and cooking applications. The launch expands branded assortment depth in plant-based dairy alternatives and reinforces coconut milk visibility in mainstream retail sets.
Coconut Products Market Report Scope and Research Methodology
Market Definition and Coverage
This market covers processed coconut-based goods sold into food, beverage, and personal care demand, where value is counted at the point the product is sold as an ingredient or finished consumer item.
Scope exclusions: Excludes coir and other fiber uses, shell charcoal, farm and plantation services, and processing equipment.
Segments Covered in This Report
- By Product Type
- Coconut Oil
- Coconut Water
- Coconut Milk and Cream
- Desiccated Coconut
- Coconut Sugar and Syrup
- Others
- By Form
- Liquid
- Solid/Powder
- By Distribution Channel
- Supermarkets/Hypermarkets
- Convenience/Grocery Stores
- Online Retail Stores
- Other Distribution Channels
- By Geography
- North America
- United States
- Canada
- Mexico
- Rest of North America
- Europe
- Germany
- United Kingdom
- Italy
- France
- Spain
- Netherlands
- Poland
- Belgium
- Sweden
- Rest of Europe
- Asia-Pacific
- China
- India
- Japan
- Australia
- Indonesia
- South Korea
- Thailand
- Singapore
- Rest of Asia-Pacific
- South America
- Brazil
- Argentina
- Colombia
- Chile
- Peru
- Rest of South America
- Middle East and Africa
- South Africa
- Saudi Arabia
- United Arab Emirates
- Nigeria
- Egypt
- Morocco
- Turkey
- Rest of Middle East and Africa
- North America
Data Sources, Market Sizing, and Validation
Desk Research
Desk work starts with mapping supply and trade so the demand pool is not overstated in years with short harvests. We refer to public sources such as FAOSTAT for coconut production, UN Comtrade for import and export flows, and national agriculture statistics from key producing countries for area, yield, and seasonality.
To translate volumes into value, we check price direction using sources such as World Bank commodity data, customs unit values, and select central bank currency series. Company filings, investor presentations, and reputable press are used to understand product mix shifts like oil versus liquid formats, and how pricing moves with packaging and freight. A paid subscription for company financials and news is used in a limited way to confirm revenue splits and corporate actions. These sources are not exhaustive, and many other public references were used for cross-checks and clarification during the study.
Primary Interviews and Surveys
Primary work is used to validate the conversion from coconut inputs into sellable products, and to pressure-test price progression assumptions by product form. We spoke with manufacturers, brand teams, distributors, ingredient buyers, and trade participants across APAC, EMEA, and the Americas, so gaps in secondary data could be closed before finalizing the model.
Distribution of primary research fieldwork respondents
| Company type | Respondent position | Region |
|---|---|---|
| Top tier: 38% | CXOs: 12% | APAC: 44% |
| Mid tier: 40% | Functional/Unit leaders: 38% | EMEA: 30% |
| Smaller Players: 22% | Managers: 50% | Americas: 26% |
Market-Sizing & Forecasting
Sizing is built using a top-down approach where production and trade data are used to reconstruct how much coconut material is available for processing, which is then translated into product-level value using realistic conversion yields and average selling prices. After the first cut, we corroborate totals using selective bottom-up checks such as sampled price per kilogram or liter by country, channel markups, and supplier and buyer share-of-wallet discussions.
The model is guided by market fingerprints that can be tracked consistently, including coconut production cycles in major origins, export intensity by product form, retail and foodservice mix for liquids versus solids, and observed price spreads between bulk ingredient grades and packaged consumer grades. Other practical inputs include currency movements in key trading pairs, freight and packaging cost direction, and the pace of adoption for plant-based alternatives in priority end uses.
Forecasts are built using scenario analysis, where demand growth and pricing are stressed under different harvest and trade conditions, then aligned with what interviewees expect in contract renewals and channel performance. When bottom-up views are incomplete for smaller countries or niche formats, we handle gaps by applying proxy consumption ratios from similar markets and then rechecking totals against trade and production limits.
Data Validation & Update Cycle
Outputs are checked in several passes so that one strong assumption does not distort the whole market. We compare the final value totals against independent signals such as export value growth, changes in reported coconut output, and pricing direction in key product baskets, and then investigate outliers before sign-off.
When variance is large, the analyst rechecks unit conversions, conversion yields, and the timing of price inputs, followed by a second review to confirm the fix is consistent across regions and product forms. The report is refreshed annually, and material events like sharp harvest swings, tariff changes, or major price shocks can trigger an interim reassessment. Before delivery, a fresh pass is completed so clients receive an up-to-date view based on the latest available data.
Mordor Intelligence's Coconut Products Market Size Compared Against Other Published Estimates
Published market values for coconut products can look far apart even when they discuss similar end uses, because the market is defined and priced in different ways. Differences usually come from what is counted as a coconut product, the point in the value chain where it is priced, and how currency and inflation are handled in the base year.
A common gap driver is whether adjacent categories are included, such as coir and shell-derived materials, or whether only food-grade and cosmetic-grade processed products are counted. Another driver is price build logic, where some studies lean heavily on retail shelf prices across all countries, while others blend bulk ingredient pricing with packaged premiums, which changes the total when liquids are fast growing. The spread also reflects refresh cadence and scenario choice, since harvest variability and trade disruptions can move volumes in a single season. In this study, the scope choices exclude coir, shell charcoal, and plantation services, which keeps the 2025 total more focused, a modeling choice applied by Mordor Intelligence.
Benchmark comparison
| Source | Market Size | Gaps in Research Methodology |
|---|---|---|
| Mordor Intelligence | USD 8.33 B (2025) | |
| Global Consultancy A | USD 26.20 B (2025) | Likely uses a wider definition that can bundle broader coconut-linked categories and may lean more on end-consumer pricing across products and regions, which inflates totals versus an ingredient and processed-goods scope. |
| Industry Research Group B | USD 15.80 B (2025) | Appears to include a broader mix of coconut product types and may apply different assumptions for channel margins and price escalation, with less visible checks against production and trade constraints. |
The table shows that scope and pricing level explain most of the gap, followed by how quickly assumptions are refreshed when harvest and trade conditions shift. By keeping the model tied to observable supply and trade limits and using practical price bridges by form and channel, our estimate stays traceable to inputs that can be rechecked and repeated year to year without hidden add-ons that change the market boundary.
Key Questions Answered in the Report
What is the forecast size of the Coconut products market by 2031?
The Coconut products market size is projected to reach USD 12.90 billion by 2031, reflecting a 7.57% CAGR from 2026 to 2031.
Which region will grow fastest over the forecast period?
The Asia-Pacific region is projected to achieve a CAGR of 9.49% through 2031, driven by the development of integrated farming and processing ecosystems in countries such as Indonesia, the Philippines, Thailand, and India.
Which product type is gaining the most momentum?
Coconut milk is the fastest-growing segment, advancing at an 8.82% CAGR as consumers seek dairy-free options with creamy texture.
How is e-commerce affecting coconut sales?
Online retail is expanding at a 9.98% CAGR because digital platforms highlight sustainability credentials and bypass traditional shelf-space constraints.
What major risk could disrupt supply?
Extreme weather events such as typhoons and droughts can slash harvests, driving price spikes that challenge downstream manufacturers.