
Cobalt Market Size and Share
Market Overview
| Study Period | 2020 - 2031 |
|---|---|
| Market Volume (2026) | 258.99 Million tons |
| Market Volume (2031) | 398.2 Million tons |
| Growth Rate (2026 - 2031) | 8.98 % |
| Fastest Growing Market | Asia-Pacific |
| Largest Market | Asia-Pacific |
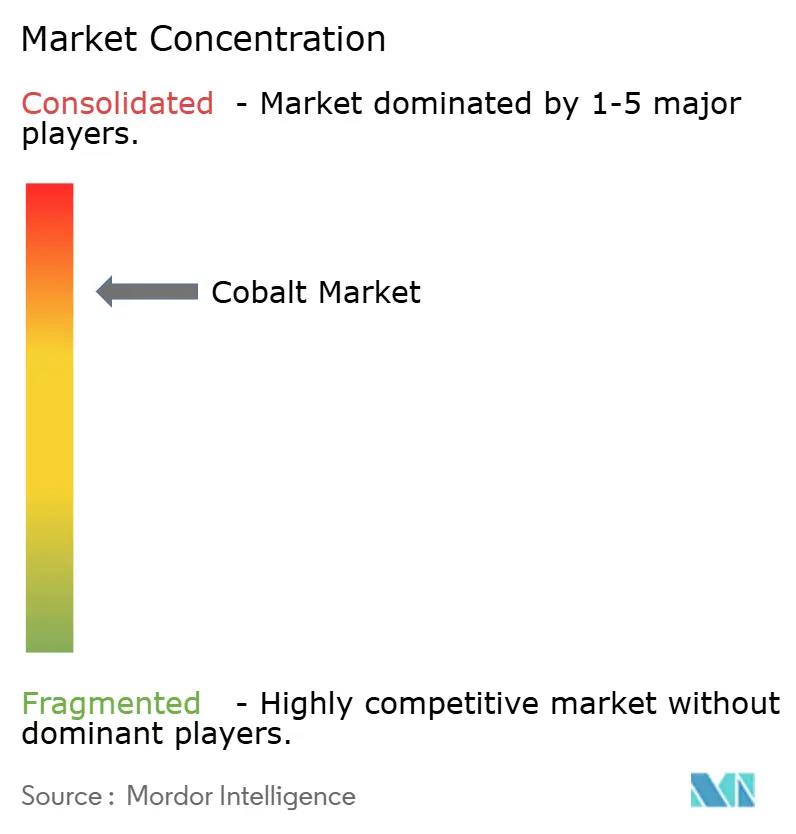
| Market Concentration | High |
Major Players *Disclaimer: Major Players sorted in no particular order Image © Mordor Intelligence. Reuse requires attribution under CC BY 4.0. | |
Cobalt Market Analysis by Mordor Intelligence
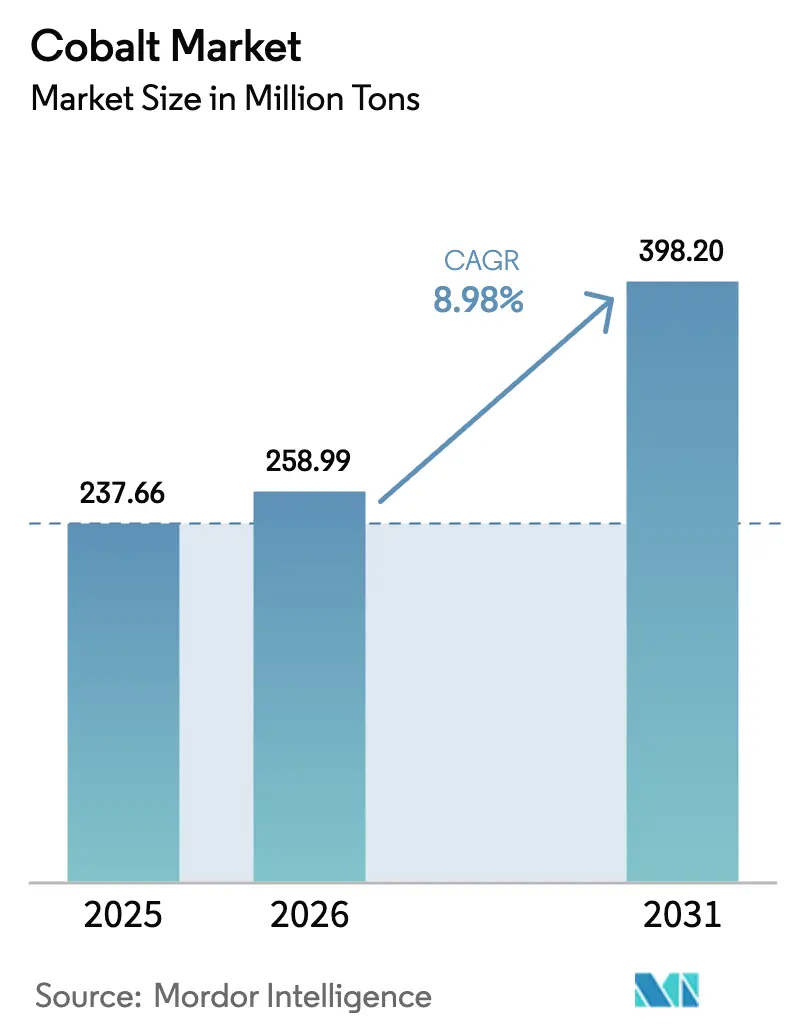
Cobalt market size in 2026 is estimated at 258.99 Million tons, growing from 2025 value of 237.66 Million tons with 2031 projections showing 398.2 Million tons, growing at 8.98% CAGR over 2026-2031. Robust demand for battery‐grade sulfate, aerospace superalloys, and high-performance magnetic alloys is expanding the market even as refined output struggles to keep up. Supply security remains a central theme because the Democratic Republic of Congo (DRC) delivers 76% of mined cobalt; a four-month export suspension in early 2025 drove spot prices sharply higher, exposing systemic vulnerability to policy shocks. Outside Central Africa, Indonesia’s high-pressure acid-leach projects and scattered North American sulfide developments will add new tons. End-use diversity further underpins the cobalt market because batteries, aerospace, defense machining, and 5 G hardware each contribute independent growth streams that dilute the impact of cyclical swings in any single sector.
Key Report Takeaways
- By form, metal led with 47.52% cobalt market share in 2025, while purchased scrap is forecast to expand at a 10.82% CAGR between 2026 and 2031.
- By application, batteries accounted for 57.65% of the cobalt market size in 2025 and are poised for an 11.63% CAGR to 2031.
- By production source, primary mining supplied 81.55% of the 2025 output; secondary supply records the fastest growth at a 10.14% CAGR through 2031.
- By end-user industry, automotive commanded 43.65% cobalt market share in 2025 and shows the highest forward CAGR of 14.89%.
- By geography, Asia-Pacific held 51.32% cobalt market share in 2025 and is projected to grow at an 11.03% CAGR to 2031.
Note: Market size and forecast figures in this report are generated using Mordor Intelligence’s proprietary estimation framework, updated with the latest available data and insights as of 2026.
Market Trends and Insights
Drivers Impact Analysis of Cobalt Market*
| Drivers | (~) % Impact on CAGR Forecast | Geographic Relevance | Impact Timeline |
|---|---|---|---|
| Usage in rechargeable batteries | +3.2% | Global – China, Europe, North America | Medium term (2-4 years) |
| Superalloy demand from engine restarts | +1.1% | North America, Europe, China | Short term (≤ 2 years) |
| High-speed cutting tools | +0.7% | North America, Europe, China | Short term (≤ 2 years) |
| 5 G/IoT magnetic materials | +0.8% | East Asia early-adopter cluster | Medium term (2-4 years) |
| Regulatory Push for Conflict-Free, Traceable Cobalt Supply Chains | +0.5% | Global, with emphasis on EU, North America | Long term |
| Source: Mordor Intelligence | |||
Rising Usage in Rechargeable Batteries
Battery manufacturers consumed over half of total cobalt demand in 2024, driven by record electric-vehicle (EV) sales exceeding 17 million units. Even with ongoing efforts to reduce cobalt intensity in nickel-rich NCM cathodes, the metal remains essential for high-voltage stability and long cycle life. Major cell producers are actively stockpiling cobalt sulfate to hedge against price volatility, a strategy that amplifies short-term market swings. The practice also supports government designation of cobalt as a strategic material, unlocking public financing for new refining and recycling assets. These feedback loops strengthen the cobalt market by ensuring that supply-side investments track expanding battery footprints.
Growing Demand for Superalloys from Commercial Aerospace Engine Restarts
Commercial jet output has rebounded, and turbine manufacturers have restarted lines that rely on cobalt-rich discs and combustor liners. NATO’s 2024 defense-critical raw-materials list explicitly includes cobalt, highlighting the alloy’s irreplaceable heat resistance[1]European Commission, “CNSTech Programme Results,” cordis.europa.eu. With backlogs above 12,000 aircraft, original equipment makers forecast high-single-digit growth in superalloy demand through 2030. Qualification barriers deter substitution, so aero-engine offtake contracts offer miners and refiners a predictable, high-margin outlet. This stable pull complements the more volume-driven battery segment and supports long-term allocations.
Increasing Adoption of Cobalt-Rich Cutting Tools
Cobalt levels between 8% and 20% are now common in cemented-carbide tools machining next-generation nickel and titanium aerospace parts. The EU-funded CNSTech program demonstrated cobalt-based high-entropy alloys that outperform traditional nickel grades in thermal-fatigue tests[2]North Atlantic Treaty Organization, “Defence-Critical Raw Materials List 2024,” nato.int . Tool makers report solid order books as airlines accelerate engine overhauls, signalling that this specialized demand will retain premium pricing. Because margins on cutting-tool alloys exceed those on battery chemicals, miners are keen to protect allocations to tooling customers, reinforcing diversified demand within the cobalt market.
Accelerated 5G/IoT Roll-Out Driving High-Frequency Magnetic Materials
Telecom vendors are adopting cobalt-based amorphous and nanocrystalline alloys for compact gigahertz-grade filters and antennas. These materials exhibit high permeability and low coercivity, enabling lower power consumption in 5 G radios. As connected devices multiply into the tens of billions, specialized ribbon and powdered cores enlarge the customer base beyond mobility and machining. Diversification lowers the probability that any single technology pivot, such as cobalt-free batteries, could derail aggregate growth, supporting resilience in the cobalt market.
Restraints Impact Analysis of Cobalt Market*
| Restraints | (~) % Impact on CAGR Forecast | Geographic Relevance | Impact Timeline |
|---|---|---|---|
| Complex refining from ore | −1.2% | DRC, Indonesia | Medium term (2-4 years) |
| Limited solvent extraction outside China | −1.8% | All except China | Long term (≥ 4 years) |
| ESG and Human Rights Scrutiny Increasing Supply Chain Costs | -0.9% | Global, with emphasis on DRC | Medium term |
| Source: Mordor Intelligence | |||
Complex Refining from Ore
Most cobalt originates as a by-product of copper or nickel mining, and complex mineralogy complicates downstream hydrometallurgy. High-pressure acid-leach circuits in the DRC and Indonesia face permitting hurdles, reagent logistics, and energy constraints. These challenges slow capacity ramp-ups and raise operating costs, restraining near-term supply growth in the cobalt market. Policy pressure for more environmentally managed flows adds further capital requirements that extend project timelines.
Limited Solvent Extraction Capacity Outside China
China hosts most of the solvent-extraction and crystallization infrastructure required for battery-grade cobalt chemicals. Emerging projects in Europe and North America strain to secure proprietary extractants and engineering talent, delaying diversification. As a result, non-Chinese refiners pay premiums for intermediates or must ship mixed hydroxide back to Asia, adding freight and working-capital burdens. Unless new regional plants reach scale, the cobalt market will continue to exhibit geographic bottlenecks that temper supply elasticity.
*Our forecasts treat driver/restraint impacts as directional, not additive. The impact forecasts reflect baseline growth, mix effects, and variable interactions.
Cobalt Market Segment Analysis
By Form:
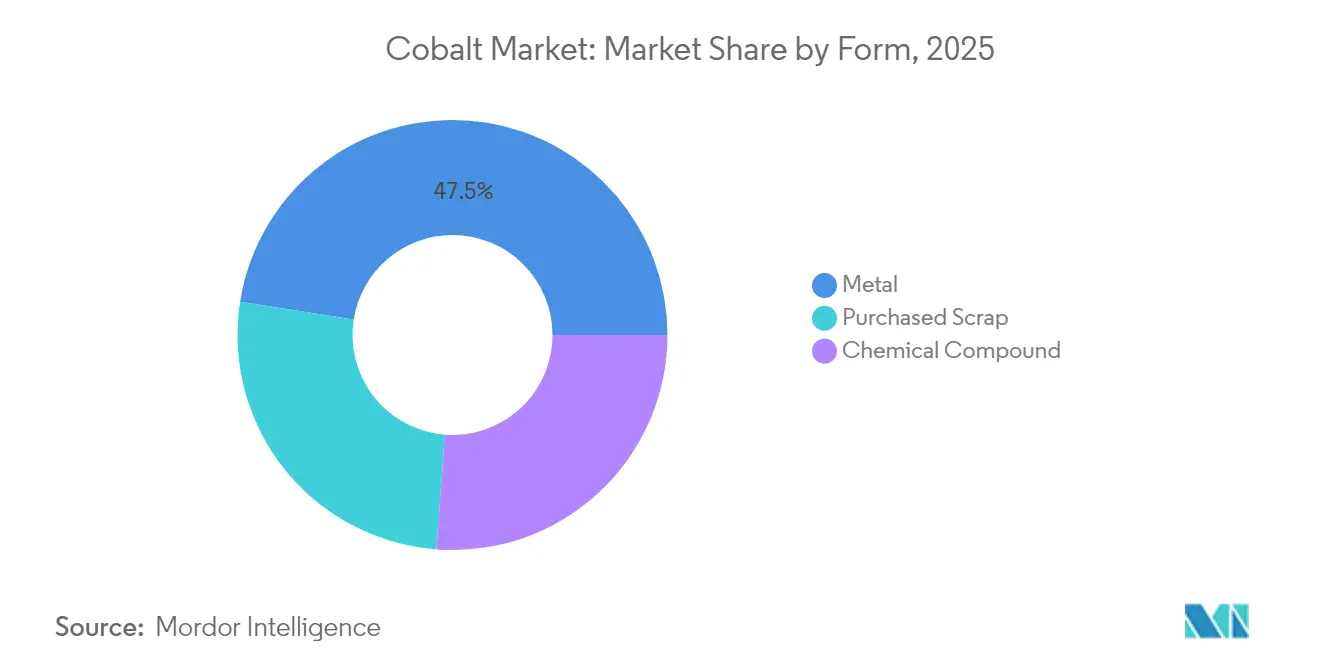
Growing Dominance of Metal and Recycled FeedstockMetal accounted for 47.52% of the cobalt market share in 2025, reflecting versatile use in superalloys, cutting tools, and soft magnetic components. High-temperature alloy producers lock in multi-year contracts to secure consistent quality, and recent price spikes led several aerospace primes to negotiate toll-refining deals that guarantee physical delivery, further tightening spot availability. Preference for long-term offtake could lengthen lead times for smaller buyers, encouraging exploration of recycled briquettes as a hedge.
The purchased-scrap sub-segment is forecast to post a 10.82% CAGR from 2026 to 2031 as regional battery recycling plants ramp up. Regulatory quotas for recycled content, paired with economic gains from recovering nickel and lithium, make cobalt extraction from black mass financially attractive even at moderate prices. Companies such as Electra Battery Materials are building hydrometallurgical circuits dedicated to scrap, signalling confidence in steady feedstock supply. Over time, increasing secondary flows will erode metal’s dominance in the cobalt market while elevating resource efficiency.


By Application:
Batteries Maintain Majority Share Amid Alloy ResilienceBatteries represented 57.65% of the cobalt market size in 2025 and are on track for an 11.63% CAGR to 2031, powered by EV rollouts and premium consumer electronics. Nickel-rich NCM cathodes still incorporate 10%–15% cobalt to maintain lattice stability under fast-charge conditions, a requirement unlikely to disappear in the medium term. Even partial thrifting leaves absolute tonnage needs high because total cell output is expanding so quickly.
Outside batteries, alloy applications hold a durable niche in gas-turbine engines, while catalysts gain traction from cobalt-based Fischer–Tropsch routes that convert captured CO₂ into synthetic aviation fuel. Magnetic powders enjoy steady growth alongside 5G base-station deployments, and ceramic pigments move to lower‐cobalt blends that still meet color fastness standards. This broad portfolio allows the cobalt market to absorb moderate substitution in one application without derailing overall growth.
By Production Source:
Primary Mining Remains Dominant, but Secondary Supply ScalesPrimary mining delivered 81.55% of global cobalt output in 2025, underpinned by DRC copper–cobalt ores. When the DRC temporarily halted exports, quarter-on-quarter prices advanced despite soft demand, underscoring high concentration risk. Indonesia’s HPAL projects will raise cobalt output to mid-double-digit kiloton levels by 2030, adding geographic diversity and attracting advance offtake agreements from non-Chinese refiners seeking to hedge Central African exposure.
Secondary supply is the fastest-growing source, with a projected 10.14% CAGR through 2031. The International Energy Agency estimates that recycling could cut the need for virgin cobalt by up to 40% by mid-century. Rising volumes of spent EV batteries and consumer devices create predictable feedstock flows, anchoring new hydrometallurgical capacity in jurisdictions with strict environmental standards. Shorter transport distances and lower carbon footprints strengthen the sustainability narrative across the cobalt market.
By End-User Industry:
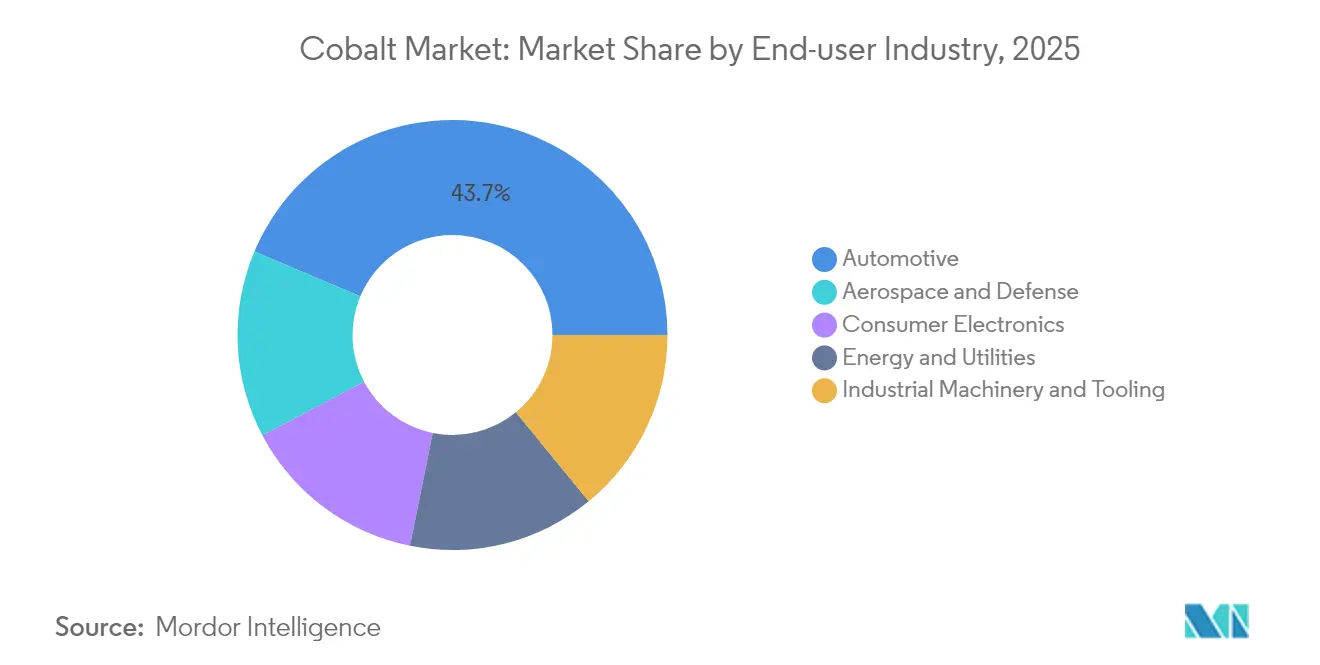
Automotive Accelerates While Aerospace Sustains High MarginsAutomotive commanded 43.65% cobalt market share in 2025 and shows the highest forward CAGR of 14.89% as policy incentives amplify EV adoption. Original equipment manufacturers have moved upstream through direct procurement and joint-venture mine stakes, signalling that secure cobalt supply is now a board-level priority. Suppliers able to certify traceability stand to win longer contracts at premium prices, supporting investment in responsibly managed operations.
Aerospace and defense consume smaller volumes yet demand superalloys with very high cobalt percentages, multiplying value per kilogram. Air-traffic recovery and military modernization programs ensure a steady, high-margin outlet. Electronics maintains relevance for lithium-cobalt-oxide batteries in smartphones and laptops, though growth is moderating as replacement cycles lengthen. Industrial tools and machinery provide an enduring baseline demand, giving the cobalt market a balanced portfolio across end industries.
Geography Analysis
APAC and Africa Cobalt Market
Asia-Pacific held 51.32% cobalt market share in 2025 and is forecast to grow at an 11.03% CAGR to 2031. China refines a major portion of the global cobalt chemicals and maintains equity stakes in many DRC mines, securing an integrated mine-to-cathode chain that underpins its battery dominance. South Korea and Japan have responded by taking minority stakes in Indonesian HPAL ventures, pointing toward a more multipolar supply map later in the decade. Heightened competition for concentrates meeting stringent ESG criteria is already driving premium payments.
North America and Europe Cobalt Market
North America is accelerating supply-chain localization under the United States Inflation Reduction Act and Defense Production Act. In August 2024, the Department of Defense granted USD 20 million to Electra Battery Materials to establish sustainable cobalt-sulfate refining. Europe sustains sizable downstream demand through a growing battery-cell ecosystem backed by the EU Battery Regulation, which links market access to life-cycle reporting.


Regulatory Landscape
The cobalt regulatory environment is increasingly shaped by battery supply-chain due diligence, recycled-content rules, and export controls in concentrated producing regions. In the European Union, the Batteries Regulation (EU) 2023/1542 provides the anchor for life-cycle and supply-chain obligations for battery materials, while Regulation (EU) 2025/1561 postponed the application date for certain battery due diligence obligations from August 18, 2025, to August 18, 2027, giving cathode and battery makers more time to align audit systems and contracts for cobalt-bearing inputs.
On the supply side, the Democratic Republic of Congo has used formal constraints to manage cobalt flows, reinforcing policy risk in a market where the country is the dominant mined supplier. ARECOMS implemented an annual cobalt export cap of 96,600 metric tons for 2026 and 2027. Operational frictions also emerged, including reports in July 2026 of a technical failure in a customs platform that prevented export declaration registration and threatened a portion of planned exports. In the United States, critical-minerals sourcing rules are tightening in defense procurement, with FY2026 NDAA provisions and proposed legislation such as H.R. 2310 (COBALT Supply Chain Act) pointing to traceability and China-related refining exposure as compliance issues for cobalt-containing batteries.
Value Chain Analysis
Cobalt supply begins largely as a by-product stream from copper and nickel mining, with upstream concentration in the DRC shaping the rest of the value chain. Major miners and integrated players operating in or sourcing from the DRC include CMOC, Glencore, Eurasian Resources Group (ERG), and Huayou Cobalt, and producer-country export administration, including ARECOMS quota mechanisms, can directly affect the availability of cobalt intermediates. Concentrates and intermediates then feed hydrometallurgical refining to produce battery-grade cobalt sulfate and other chemicals, or go to metal production for superalloys, tool materials, and magnetic applications.
Downstream conversion and qualification remain uneven by geography, with a large share of solvent extraction and crystallization capacity concentrated in China. This concentration has supported two parallel sourcing pathways: a China-centered mine-to-chemical chain anchored by Chinese refiners and equity-linked offtake, and an alternative pathway in which OEMs and cell makers contract for traceable cobalt units and invest in regional refining and recycling to reduce exposure to single-country policy shocks. Secondary supply from recycling adds a growing loop, with black mass and scrap feeding hydrometallurgical circuits that can deliver cobalt chemicals aligned to tightening ESG and documentation requirements.
Competitive Landscape
The cobalt industry exhibits high consolidation. The top five miners control most ore, but a wider set of refiners and recyclers manage downstream chemistry. Chinese groups such as CMOC and Zhejiang Huayou leverage integrated mine-to-chemical chains to secure bargaining power with cathode makers. European and North American buyers are countering by underwriting non-Chinese capacity, as evidenced by long-term offtake agreements between automakers and emerging producers in Australia and Canada. These moves signal a gradual shift from a global supply oligopoly toward regionally ring-fenced value chains, each with distinct pricing.
Cobalt Industry Leaders
CMOC
Eurasian Resources Group
Glencore
Huayou Cobalt Co., Ltd.
Vale S.A.
- *Disclaimer: Major Players sorted in no particular order
Cobalt Market Companies Covered in this Report
- BHP
- CMOC
- Cobalt Blue Holdings Limited
- Eramet
- Eurasian Resources Group
- First Quantum Minerals Ltd.
- Freeport-McMoRan
- GECAMINES SA.
- Glencore
- Huayou Cobalt Co., Ltd.
- Jervois
- Jinchuan Group International Resources Co. Ltd
- MITSUI MINING & SMELTING CO.,LTD.
- Sherritt International Corporation
- Sumitomo Metal Mining Co., Ltd.
- Umicore
- Vale S.A.
- Wheaton Precious Metals

Market Opportunities and Future Outlook
Regulatory and procurement rules are creating white space for traceable, non-Chinese-aligned cobalt units across mining, refining, and recycling. In the United States, defense procurement requirements for batteries that are free from Foreign Entity of Concern (FEOC) sourcing begin phasing in from January 1, 2028. Proposed measures such as H.R. 2310 also increase scrutiny of cobalt refined in China and linked to DRC labor standards. Together, these signals support opportunities for North American and allied-country refining, qualification of battery-grade cobalt sulfate, and contract structures that bundle custody documentation with physical supply.
In Europe, the Batteries Regulation framework provides a route for recycling-led cobalt supply commercialization. The European Commission has set a 90% cobalt recovery efficiency requirement for recyclers by end-2027, and the EU defined mandatory recycled-content thresholds for cobalt in batteries starting in 2031 (16%) and 2036 (26%). These provisions expand the addressable market for battery recycling and hydrometallurgical upgrading of scrap and black mass into compliant cobalt chemicals, while also encouraging long-term procurement partnerships among recyclers, cell makers, and OEMs that need to demonstrate recycled content and traceability.
Recent Industry Developments in Cobalt Market
- April 2026: Glencore published First Quarter 2026 production report confirming DRC cobalt export quotas validity extended from 2025 into April 2026 and unused Q1 2026 quotas valid until 30 June 2026. The extension reinforces copper priority in DRC and tightens cobalt availability, affecting near-term prices and allocation.
- January 2026: Glencore released Full Year 2025 production report stating own sourced cobalt production of 36,100 tonnes, a 5% decrease from 2024. This downturn in output suggests tighter supply dynamics for 2026 and informs expectations for pricing and availability.
- January 2026: CMOC announced US$1.2 billion convertible bonds due 2027. Debt financing capacity could enable expansion or timing adjustments for cobalt projects, with implications for future supply chain dynamics.


Cobalt Market Report Scope and Research Methodology
Market Definition and Coverage
For this methodology, the cobalt market covers cobalt in metal, cobalt chemical compounds, and purchased scrap that is processed and sold into end uses such as batteries, alloys, catalysts, and tool materials across major producing and consuming regions.
Scope exclusions: We do not count downstream finished products like battery cells, cathode active materials, or superalloy components as market value, only the cobalt-bearing inputs sold into those chains.
Segments Covered in This Report
- By Form
- Chemical Compound
- Metal
- Purchased Scrap
- By Application
- Batteries
- Alloys
- Catalysts
- Tool Materials
- Magnets
- Ceramics and Pigments
- Other Applications
- By Production Source
- Primary
- Secondary
- By End-user Industry
- Automotive
- Aerospace and Defense
- Consumer Electronics
- Energy and Utilities
- Industrial Machinery and Tooling
- Geography (Production)
- Australia
- Canada
- China
- Democratic Republic of Congo
- Cuba
- Indonesia
- Morocco
- Russia
- United States
- Rest of World
- Geography (Consumption)
- Asia-Pacific
- China
- India
- Japan
- South Korea
- Rest of Asia-Pacific
- North America
- United States
- Canada
- Mexico
- Europe
- Germany
- United Kingdom
- France
- Italy
- Rest of Europe
- South America
- Brazil
- Chile
- Rest of South America
- Middle-East and Africa
- Saudi Arabia
- South Africa
- Rest of Middle-East and Africa
- Asia-Pacific
Data Sources, Market Sizing, and Validation
Desk Research
Desk research was used to set the supply and demand backbone for cobalt and to align unit definitions (metal content versus product weight) before the model was built. We leaned on public production, reserves, and trade indicators, then translated those into realistic conversion factors between mined output, intermediate products, and refined forms.
Typical references included sources such as USGS Mineral Commodity Summaries, UN Comtrade trade statistics, the International Energy Agency for EV and battery demand context, World Bank commodity data for macro assumptions, and official mining ministry or geological survey publications in key producing countries. Company filings, investor presentations, and reputable press were also reviewed to understand capacity additions, ramp-up timelines, and refinery utilization. For cross-checking company financials, shipment mentions, patents, and contract awards, we also used a few paid subscriptions focused on company intelligence, news, and patent coverage. The desk sources listed here are illustrative only, and many other public and paid references were used for data collection, validation, and clarification.
Primary Interviews and Surveys
Primary work focused on validating assumptions that do not show up cleanly in public tables, especially product mix, battery-grade versus standard-grade splits, and how spot and contract pricing flows through the chain. We spoke with participants across mining, refining, recycling, trading, and downstream procurement, and we checked inputs across APAC, EMEA, and the Americas so regional differences in payables and premia were not missed.
Distribution of primary research fieldwork respondents
| Company type | Respondent position | Region |
|---|---|---|
| Top tier: 32% | CXOs: 15% | APAC: 49% |
| Mid tier: 52% | Functional/Unit leaders: 30% | EMEA: 30% |
| Smaller Players: 16% | Managers: 55% | Americas: 21% |
Market-Sizing & Forecasting
The market was sized using a top-down build that reconstructs cobalt consumption and trade flows by form, and then translates those volumes into value using observed price series and negotiated premia. Where the public record is incomplete, results were corroborated with selective bottom-up checks such as sampled supplier roll-ups, stated capacity times utilization, and sanity checks using typical payables from concentrate to intermediate products.
Key inputs in the model included mined and refined production volumes (in cobalt content), import and export flows by HS codes, recycling availability and recovery yields, battery chemistry mix shifts (for example, NMC versus LFP adoption effects on intensity), and benchmark cobalt prices with regional premia and product differentials (metal versus sulfate versus intermediates). Because value can change even when tonnage is stable, pricing logic was handled carefully using annual average pricing and a lag where contracting norms indicated pass-through delays.
For forecasting, scenario analysis was used and then anchored to a base case aligned with expert expectations on EV build, refinery ramp-ups, and policy-driven supply risks. When a data point was missing for a country or form, we filled gaps with proxy ratios from similar markets and then re-tested the output against global totals so we did not overstate smaller producing regions.
Data Validation & Update Cycle
Outputs were validated through cross-checks against independent signals, such as global mine supply versus refinery output, trade balances versus apparent consumption, and price movement versus reported surplus or deficit commentary. Large variances triggered a second pass on unit conversions, metal-content assumptions, and the timing of price averaging, and then the related inputs were re-checked with selected interviewees.
A multi-step review is followed before sign-off, where an analyst re-tests sensitivities and another reviewer checks consistency across chapters and exhibits. Reports are refreshed annually, and interim updates are made when material events occur, such as major mine disruptions, policy changes, or sharp price resets. Before delivery, we do a fresh final pass so the client receives the latest updated view.
Mordor Intelligence's Cobalt Market Size Measured Against Other Published Estimates
Published cobalt market estimates often disagree because the unit of measure and boundary can shift, and then the reported number changes even when the underlying physical market is similar. Differences commonly come from whether a study reports value or volume, which cobalt forms are counted, and how price assumptions are treated during volatile periods.
In this market, the biggest gaps usually show up in currency timing and ASP logic, because cobalt prices can swing materially within a year and product premia vary by grade and region. When the refresh cadence is faster and annual average pricing is enforced consistently across forms, the value estimate stays tied to a repeatable demand pool, which is the approach applied in Mordor Intelligence.
Benchmark comparison
| Source | Market Size | Gaps in Research Methodology |
|---|---|---|
| Mordor Intelligence | USD 258.99 M (2026) | |
| Industry Association A | USD 231.00 M (2024) | Often communicated as a metal-content demand figure and can be misread as market value, and it typically does not convert consistently across cobalt forms and regional premia in the same year. |
| Trade Journal B | USD 410.90 M (2030) | Commonly derived from supply-side output projections and then valued using point-in-time price assumptions, which can inflate totals when short-term price spikes are treated as representative. |
The comparison shows that the spread is mostly created by unit choices and how prices are averaged, not just by different growth views. By keeping the scope limited to cobalt inputs and re-checking value using consistent annual pricing and form-level differentials, our sizing stays easier to trace back to clear volumes and assumptions.


Key Questions Answered in the Report
What is the current size of the cobalt market?
The cobalt market size is 258.99 million tons in 2026 and is forecast to reach 398.2 million tons by 2031.
Which segment dominates cobalt consumption today?
Rechargeable batteries account for 57.65% of the cobalt market size in 2025 due to strong electric-vehicle demand.
How dependent is supply on the Democratic Republic of Congo?
The DRC supplies 76% of mined cobalt, making the global supply chain highly sensitive to policy changes in that country.
What growth rate is expected for automotive demand?
Automotive applications are projected to grow at a 14.89% CAGR, the fastest among end-use industries
Can recycling significantly reduce primary cobalt requirements?
Yes. The International Energy Agency estimates recycling could displace up to 40% of virgin cobalt needs by mid-century, and secondary supply already shows a 10.14% CAGR outlook.
Page last updated on:


 Your data is secure and never sold or shared.


