
Coalescing Agents Market Size and Share
Market Overview
| Study Period | 2020 - 2031 |
|---|---|
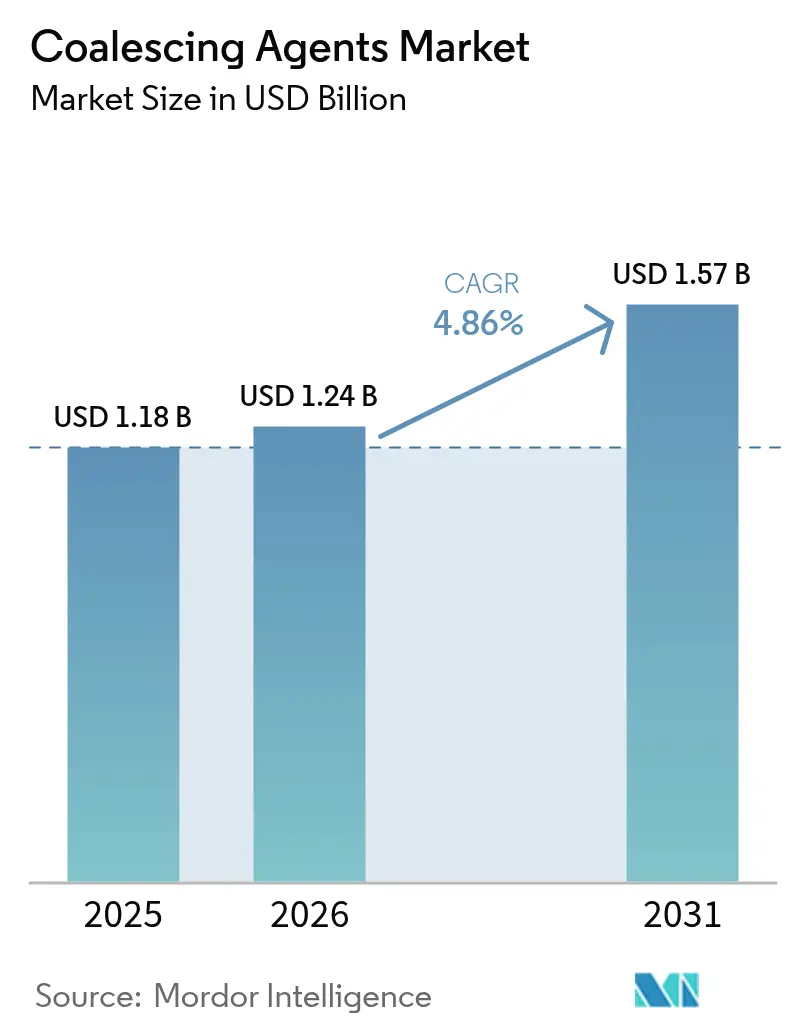
| Market Size (2026) | USD 1.24 Billion |
| Market Size (2031) | USD 1.57 Billion |
| Growth Rate (2026 - 2031) | 4.86 % |
| Fastest Growing Market | Asia Pacific |
| Largest Market | Asia Pacific |
| Market Concentration | Medium |
Major Players *Disclaimer: Major Players sorted in no particular order Image © Mordor Intelligence. Reuse requires attribution under CC BY 4.0. | |
Coalescing Agents Market Analysis by Mordor Intelligence
The Coalescing Agent market size is expected to grow from USD 1.18 billion in 2025 to USD 1.24 billion in 2026 and is forecast to reach USD 1.57 billion by 2031 at 4.86% CAGR over 2026-2031. Current demand is anchored in water-borne architectural, industrial, and specialty coating systems that must balance performance with strict environmental rules. Tightening volatile-organic-compound (VOC) limits, wider adoption of low-temperature curing, and growth in personal care emulsions jointly elevate consumption of next-generation additives. Manufacturers continue to relocate capacity to Asia-Pacific in response to favorable feedstock economics and large-scale coating line investments. At the same time, price spikes in glycol-ether intermediates and pending EPA aerosol-coating deadlines compel formulators to diversify raw-material portfolios and accelerate zero-VOC innovation.
Key Report Takeaways
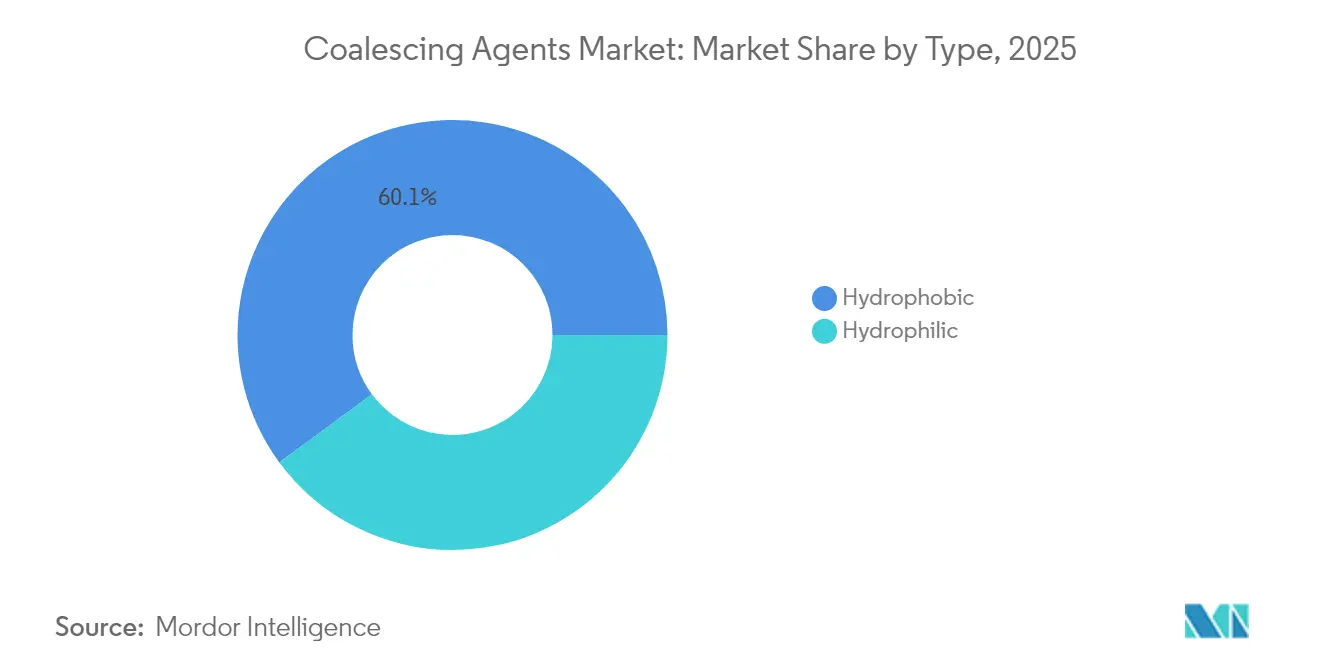
- By type, hydrophobic agents led with 60.10% of the coalescing agents market share in 2025, while hydrophilic agents are projected to expand at a 5.51% CAGR to 2031.
- By chemistry, alcohols accounted for 40.88% share of the coalescing agents market size in 2025, while esters are set to advance at a 5.34% CAGR through 2031.
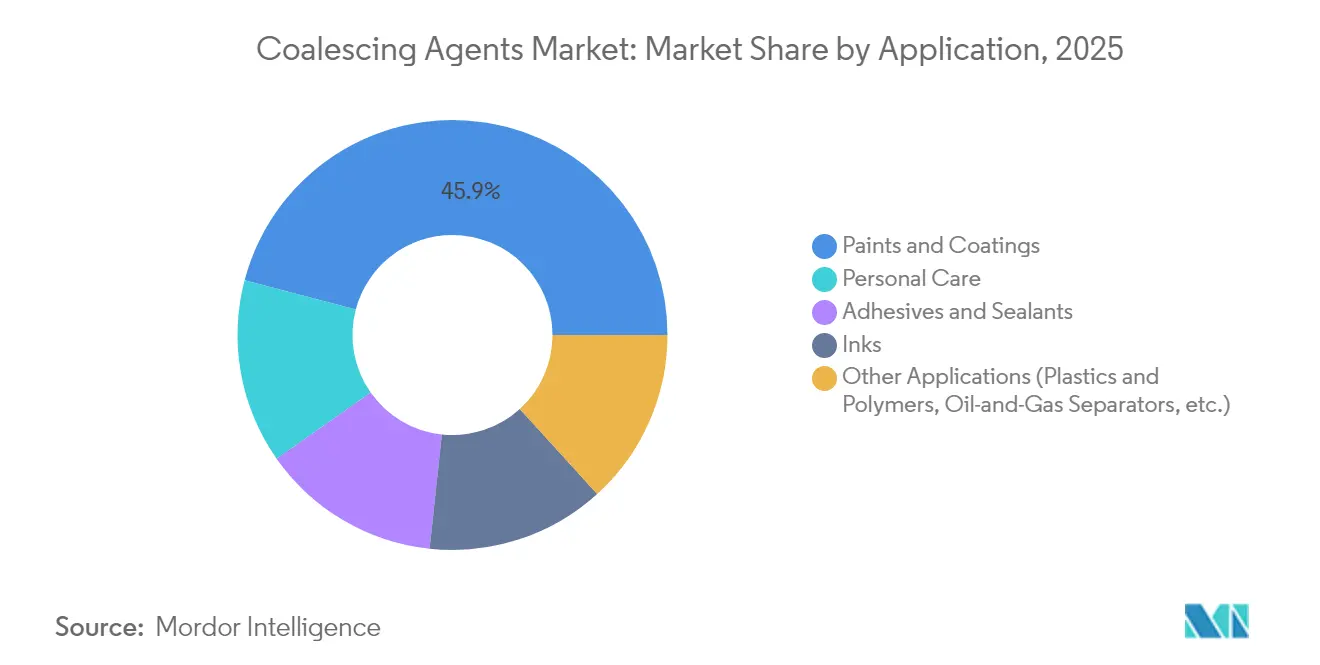
- By application, paints and coatings commanded 45.90% of 2025 demand within the coalescing agents market, while personal care is forecast to grow at a 5.72% CAGR up to 2031.
- By geography, Asia-Pacific captured 38.40% of the coalescing agents market size in 2025 and is expected to post the fastest 5.29% CAGR through 2031.
Note: Market size and forecast figures in this report are generated using Mordor Intelligence’s proprietary estimation framework, updated with the latest available data and insights as of 2026.
Market Trends and Insights
Drivers Impact Analysis of Coalescing Agents Market*
| Driver | (~) % Impact on CAGR Forecast | Geographic Relevance | Impact Timeline |
|---|---|---|---|
| Expansion of Industrial Coating Lines in Developing Economies | +1.2% | APAC core, spill-over to MEA | Medium term (2-4 years) |
| Uptake of Low-Temperature Film-Formation Additives in Automotive Refinish | +0.8% | Global, with concentration in North America and EU | Short term (≤ 2 years) |
| Tightening Indoor-Air-Quality Norms in Building Codes | +0.6% | North America and EU, expanding to APAC | Long term (≥ 4 years) |
| Commercialization of Reactive (Zero-VOC) Coalescing Agents | +0.7% | Global | Medium term (2-4 years) |
| Commercialization of Reactive (Zero-VOC) Coalescing Agents | +0.5% | Global, with focus on North America and Europe | Medium term (2-4 years) |
| Source: Mordor Intelligence | |||
Expansion of Industrial Coating Lines in Developing Economies
Record infrastructure outlays across China, India, and Southeast Asia are lifting industrial coating throughput and creating a volume pull for the coalescing agents market. New ethylene and propylene crackers, such as SABIC’s USD 6.4 billion Fujian project with 1.8 million t/y capacity, guarantee backward integration for acrylic esters and glycol-ether derivatives essential to additive production. As water-borne formulations become mandatory in factory-applied metal, plastic, and wood coatings, demand concentrates on hydrophobic grades that accelerate film formation at ambient humidity. Regional petrochemical self-sufficiency also curbs import dependency, enabling local suppliers to shorten lead times while tailoring products to divergent national VOC caps. Collectively, these factors improve supply security and strengthen APAC’s positional advantage within the broader coalescing agents market.
Uptake of Low-Temperature Film-Formation Additives in Automotive Refinish
Electric-vehicle platforms and stringent air-district rules push refinish shops toward lower bake profiles to conserve energy and protect sensitive battery components. The South Coast Air Quality Management District’s revised Rule 1151, effective May 2025, tightens VOC ceilings across primer, base-coat, and clear-coat systems, accelerating the switch to high-boiling, low-odor coalescing agents that deliver proper film coalescence below 60 °C. Large refinish paint makers are incorporating ester blends that remain in the film long enough to promote latex fusion yet volatilize before service, helping body shops meet cycle-time KPIs. Global uptake is rapid because identical low-temperature needs exist in plastics finishing, aerospace touch-ups, and composite repair. This cross-sector adoption enlarges the coalescing agents market and mitigates cyclical swings tied solely to automotive volumes.
Tightening Indoor-Air-Quality Norms in Building Codes
Since 2024, multiple U.S. federal agencies and green-building programs have synchronized guidance that elevates indoor-air-quality benchmarks, disallowing high-VOC paint ingredients. Europe follows suit by revising EN 16516 to mandate lower emissions from decorative coatings. Architects therefore specify interior paints containing zero-VOC or chemically reactive coalescing agents that polymerize into the film. Suppliers who certify emissions through UL GREENGUARD quickly capture premium positions, especially in commercial and education projects where occupant-health metrics factor into funding decisions. Over the forecast period, the driver adds incremental growth to the coalescing agents market by stimulating formulation redesign across both renovation and new-build segments.
Commercialization of Reactive (Zero-VOC) Coalescing Agents
Reactive coalescent technology covalently integrates additive molecules into the polymer backbone, eliminating evaporative emissions and enabling compliance ahead of pending 2027 EPA aerosol-coating limits. BASF’s 2024 bio-based ethyl acrylate, which delivers 40% certified renewable content and a 30% smaller carbon footprint, represents a first mover in this category[1]. Parallel academic research into polyurea-acrylic hybrids confirms viability for scratch-resistant clear-coat markets. Cost hurdles persist, but early adopters in electronics and luxury cosmetics signal that premium pricing is acceptable when paired with a demonstrable green label. Widespread scale-up is expected during the medium term, adding technology-rich sales to the coalescing agents market.
Restraints Impact Analysis of Coalescing Agents Market*
| Restraint | (~) % Impact on CAGR Forecast | Geographic Relevance | Impact Timeline |
|---|---|---|---|
| REACH and EPA Restrictions on High-VOC Ester Alcohols | -0.9% | North America and EU, expanding globally | Short term (≤ 2 years) |
| Volatility in Glycol-Ether Feedstock Pricing | -0.6% | Global | Short term (≤ 2 years) |
| Self-Coalescing Polymer Dispersion Technologies | -0.4% | Global, with early adoption in North America and Europe | Long term (≥ 4 years) |
| Source: Mordor Intelligence | |||
REACH and EPA Restrictions on High-VOC Ester Alcohols
EU REACH dossiers and the U.S. National VOC Emission Standards are progressively blacklisting high-reactivity ester alcohols, obliging formulators to re-screen raw materials and re-qualify end-use coatings Compliance timelines consume R&D budgets and slow product launches, especially for SMEs. Because acceptable substitutes often cost more and may require additional surfactant packages to stabilize latex particles, overall formulation economics tighten. Regional rule deviations further limit economies of scale, fragmenting inventories and adding logistics complexity that restrains the coalescing agents market.
Volatility in Glycol-Ether Feedstock Pricing
Dow’s January 2025 notice of USD 0.05/lb hikes on several glycol-ether grades highlights a trend of supply tightness triggered by propylene outages and robust demand from hair-care surfactants. Price swings compress margins for additive blenders that lack backward integration. Contract indexation offers partial relief, yet frequent negotiations disrupt customer relations. Smaller producers, particularly in Latin America, struggle to hedge and may withdraw from tender bids, tempering growth within the coalescing agents market.
*Our forecasts treat driver/restraint impacts as directional, not additive. The impact forecasts reflect baseline growth, mix effects, and variable interactions.
Coalescing Agents Market Segment Analysis
By Type:
Hydrophobic Dominance Faces Hydrophilic InnovationThe hydrophobic category retained 60.10% of the coalescing agents market share in 2025, benefiting from proven adhesion and water-resistance properties in heavy-duty coatings. Construction equipment, offshore platforms, and marine topcoats all specify hydrophobic blends due to prolonged exposure to moisture and solvents. Yet formulators increasingly complement these agents with ancillary wetting aids to manage gloss uniformity at higher solid contents. Margins remain attractive because large-volume paint makers favor long-term contracts that guarantee steady off-take.
Hydrophilic grades, while smaller today, log a 5.51% CAGR through 2031 on the back of stringent indoor-air-quality targets. Their molecular affinity to water packages allows use levels 10–15% lower than hydrophobic counterparts, trimming total VOC grams per liter. Cosmetic emulsion producers leverage these agents to stabilize oil-in-water formulations, improving sensory attributes without synthetic surfactants. As R&D refines film-formation profiles, uptake will accelerate in interior latex paints and next-generation adhesives, further diversifying the coalescing agents market.

By Chemistry:
Alcohols Hold Leadership while Esters AccelerateAlcohol-based products captured 40.88% of 2025 global demand thanks to cost-effective synthesis routes and balanced evaporation rates ideal for architectural latexes. Their supply chain is tightly linked to propylene oxide and acetaldehyde derivatives, which benefits integrated majors. Nonetheless, odor and toxicity considerations limit maximum inclusion levels in confined-space applications.
Ester chemistries post the fastest 5.34% CAGR through 2031. They offer lower odor thresholds, improved block resistance, and compatibility with bio-resins. Producers capitalize on glycerol and fatty-acid feedstocks, aligning with brand net-zero roadmaps. For example, reactive glycerol formal esters provide dual coalescing and cross-linking functionality, cutting additive count in high-performance floor finishes. With regulatory momentum squarely favoring low-VOC profiles, esters will expand their share of the coalescing agents market size for premium interior finishes and high-end packaging.
By Application:
Paints and Coatings Anchor Demand while Personal Care SurgesArchitectural, industrial, and OEM paints together consumed 45.90% of 2025 volume. Urbanization across Asia drives new construction, while North American renovation cycles sustain aftermarket demand. Water-borne epoxy primers and polyurethane finishes rely on carefully tailored coalescing packages to meet mechanical and corrosion-resistance targets, reinforcing the centrality of this segment within the coalescing agents market.
Personal care registers a 5.72% CAGR through 2031, the highest among all applications. Natural emulsifiers, such as saponins, require auxiliary coalescence aids to optimize viscosity, texture, and active-ingredient delivery. Clean-beauty brands highlight low-VOC claims to differentiate products on retail shelves, granting additive suppliers pricing latitude. Growth is also visible in functional skin transfer films used in long-wear color cosmetics. As indie brands scale globally, their procurement footprints enlarge, channeling incremental revenue into the coalescing agents market.
Geography Analysis
APAC Coalescing Agents Market
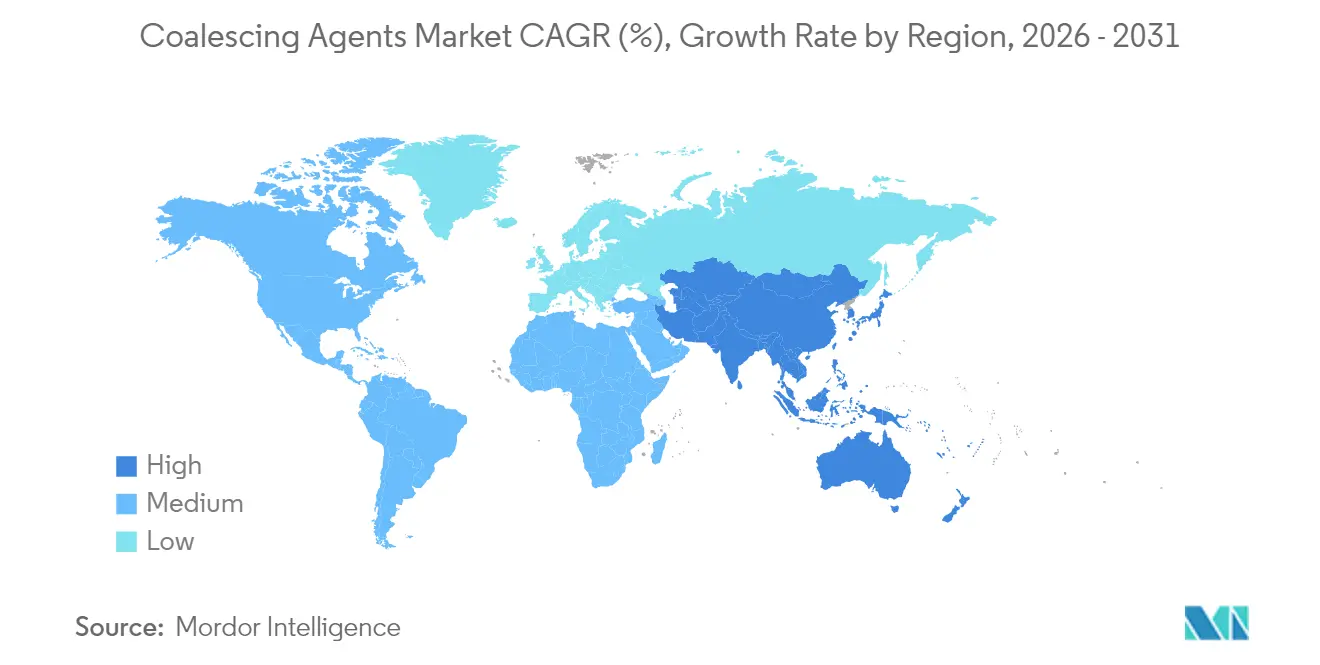
Asia-Pacific commanded 38.40% of coalescing agents market size in 2025. New ethylene and acrylic ester capacity clusters in China’s coastal provinces and in Vietnam’s Long Son complex assure raw-material supply and reduce freight expense. Regional governments continue to harmonize VOC measures with OECD benchmarks, propelling water-borne coating adoption. This policy push, combined with consumer upgrading and e-commerce packaging growth, yields a 5.29% CAGR through 2031, the fastest worldwide.
North America Coalescing Agents Market
North America accounts for roughly one-quarter of demand, underpinned by mature but innovation-rich coatings and personal-care sectors. The EPA’s aerosol-coating deadline extension to January 2027 offers breathing room for formulation trials, stabilizing near-term offtake. Meanwhile, the shift to electric vehicle assembly lines raises consumption of low-temperature coalescing blends in refinish and plastic interior parts. Feedstock pricing volatility remains the primary regional headwind, prompting downstream users to negotiate shorter contracts.
Europe Coalescing Agents Market
Europe mirrors North American technology adoption yet grapples with elevated natural-gas costs that feed into acrylic-acid and glycol-ether production. Producers offset cost inflation by emphasizing zero-VOC innovations and bio-feedstock chain-of-custody certifications. Regulatory clarity on post-consumer plastic recycling targets stimulates R&D partnerships that position European firms at the vanguard of circular chemistry, maintaining steady contributions to the coalescing agents market.
LATAM and MEA Coalescing Agents Market
Latin America, the Middle East, and Africa together represent a high-growth frontier. Petrochemical build-outs in Saudi Arabia and Abu Dhabi underpin resin-grade solvent availability, inviting downstream additive ventures. In Brazil and Mexico, housing rebound and export-oriented appliance manufacturing add diverse consumption points. Multinationals deploy technical service teams in these regions to tailor products to tropical climate performance norms, thereby expanding the addressable coalescing agents market over the long term.
Value Chain Analysis
The coalescing agents value chain starts with upstream petrochemical feedstocks (for example, propylene oxide and n-butanol) that are converted into intermediates such as glycol ethers and ester alcohols, then formulated into specialty coalescents for water-borne systems. Production is often clustered near integrated petrochemical hubs in the US Gulf Coast, Western Europe (for example, the Rhine-Ruhr belt), and China (Yangtze River Delta), which helps ensure consistent access to key intermediates and utilities.
Downstream, additive producers sell through a mix of direct supply to large coatings and personal care formulators and distribution channels using bulk and ISO tank logistics for regional and intercontinental movement. A recurring bottleneck is high-purity separation and distillation capability needed for ultra-low-VOC or low-odor grades, since many standard plants lack the fractionation depth to consistently meet tighter indoor-air-quality targets. This extends qualification times and increases reliance on suppliers with advanced purification assets. Industry coordination and regulatory dialogue (for example, via the American Coatings Association) also shape specifications, testing norms, and reformulation timelines across the chain.
Competitive Landscape
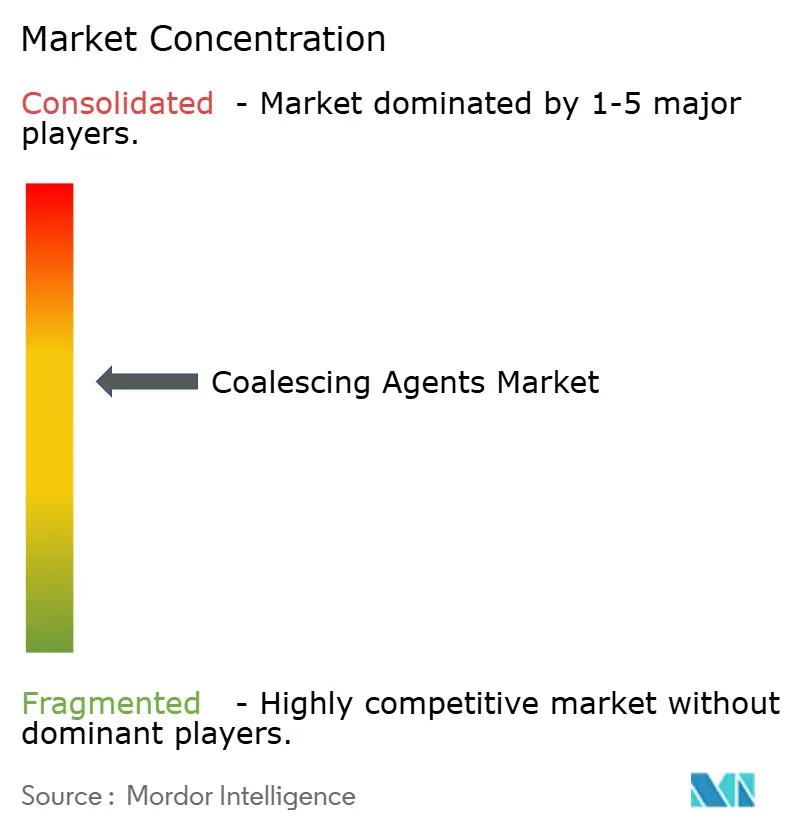
The coalescing agents market is moderately consolidated. Leading diversified chemical majors—BASF, Dow, Eastman, and Arkema—draw on integrated feedstocks and broad additive lines to serve global paint giants under multi-year supply accords. BASF’s 90% localized production footprint in Europe and North America insulates customers from cross-border freight disruptions. Dow leverages its propylene-oxide and epoxy chains to bundle solvents with related rheology modifiers, driving wallet share.
Strategic M&A remains lively. Milliken’s 2025 purchase of Borchers Group deepens know-how in cobalt-free driers and low-VOC dispersants, strengthening the combined entity’s hand in sustainability-focused coatings[2]. Regional specialists in Japan and South Korea compete on niche performance, emphasizing electrolyte-stable esters for battery-pack coatings and anti-fog films.
Disruption risk stems from emergent self-coalescing binders that reduce additive loading. To hedge, incumbents co-develop binder-plus-additive packages with resin suppliers, embedding performance synergies difficult for stand-alone challengers to replicate. Digital formulation platforms, where predictive algorithms recommend optimal coalescent blends, further differentiate suppliers able to invest in data science.
Regulatory mastery evolves into a core competency. Companies conducting life-cycle analysis and providing third-party verified product carbon footprints enjoy accelerated vendor-of-choice status as paint makers align with corporate net-zero pledges. The converging trends of sustainability, digitalization, and specialty differentiation will shape competitive ranking inside the coalescing agents market during the next decade.
Coalescing Agents Industry Leaders
-
Eastman Chemical Company
-
Dow
-
BASF SE
-
Arkema
-
Evonik Industries AG
- *Disclaimer: Major Players sorted in no particular order
Coalescing Agents Market Companies Covered in this Report
- Arkema
- BASF
- Cargill, Incorporated.
- Cristol
- Dow
- Eastman Chemical Company
- Elementis PLC
- Evonik Industries AG
- Indorama Ventures
- Perstorp
- Runtai Chemical Co., Ltd.
- Shell Plc
- Stepan Company
- Synthomer plc
Market Opportunities and Future Outlook
An opportunity is emerging around formulations that reduce reliance on conventional evaporative coalescents while still meeting film-formation requirements in water-borne architectural and industrial coatings. BASF introduced near-zero SVOC dispersion technology for interior coatings in January 2026, which highlights a shift toward binder-plus-additive solutions that meet indoor-air-quality demands through lower-SVOC architectures rather than incremental upgrades to legacy coalescent packages.
Regulatory timing is also driving near-term reformulation and qualification programs that favor suppliers with compliant portfolios and local technical support. China released GB 30981.1-2025 and GB 30981.2-2025 for hazardous substances in architectural and industrial coatings with enforcement starting June 2026, while the United States moved to VOC reactivity-based compliance metrics in updated standards implemented in January 2025. These changes increase demand for non-VOC and permanent coalescence approaches, including reactive coalescing agents that integrate into the polymer matrix and bio-based alternatives such as citrate esters. They also create room for distributors and service-led suppliers that can support region-specific test methods, documentation, and substitution lists across Asia-Pacific, North America, and Europe.
Recent Industry Developments in Coalescing Agents Market
- May 2026: Univar Solutions announced an expanded strategic partnership with Dow to distribute Dow silicone additives across EMEA. The broader distribution footprint and aligned technical support improve access to performance additives used alongside coalescing and film-formation packages, helping formulators standardize supply and accelerate reformulation work across multiple end-use segments.
- January 2026: BASF expanded deployment of near-zero SVOC dispersion technology for interior coatings to multiple regional test markets. The move minimizes the need for conventional SVOC generating coalescents and signals broader adoption of binder-plus-additive solutions to address indoor-air-quality positioning.
- May 2024: Dow introduced a coalescing agent within its EcoDry product line for water-based paints and coatings, positioned to reduce VOC emissions while maintaining coating performance. This expands options for water-borne formulators balancing compliance and application latitude, reinforcing product differentiation around low-odor and low-VOC coalescence.
Coalescing Agents Market Report Scope and Research Methodology
Market Definition and Coverage
This market covers the value of coalescing agents sold for use in formulated products where they help film formation, mainly in waterborne systems, and it is measured as manufacturer revenue in USD across major regions.
Scope exclusions: We do not count downstream paint or adhesive sales value, and we exclude solvent value in the formulation unless it is sold as a coalescing agent product.
Segments Covered in This Report
- By Type
- Hydrophilic
- Hydrophobic
- By Chemistry
- Esters
- Ketones
- Alcohols
- Diols and Glycol-ethers
- Other Chemistries (Lactates, Citrates, Siloxanes)
- By Application
- Paints and Coatings
- Adhesives and Sealants
- Inks
- Personal Care
- Other Applications (Plastics and Polymers, Oil-and-Gas Separators, etc.)
- By Geography
- Asia-Pacific
- China
- Japan
- India
- South Korea
- ASEAN Countries
- Rest of Asia-Pacific
- North America
- United States
- Canada
- Mexico
- Europe
- Germany
- United Kingdom
- France
- Italy
- Spain
- Russia
- NORDIC Countries
- Rest of Europe
- South America
- Brazil
- Argentina
- Rest of South America
- Middle East and Africa
- Saudi Arabia
- South Africa
- Rest of Middle East and Africa
- Asia-Pacific
Data Sources, Market Sizing, and Validation
Desk Research
Desk research was used to build the starting structure of demand and to anchor key industry signals that are observable year to year. We relied on public sources such as US EPA VOC guidance, the European Chemicals Agency (ECHA) substance information, Eurostat industrial production series, UN Comtrade trade flows for relevant chemical categories, and publications from coatings and chemicals associations that discuss waterborne adoption.
To translate those signals into a usable market model, we also reviewed company annual reports, investor presentations, and product technical datasheets to understand typical use rates and performance claims across application areas. Where available, paid subscription data for company financials and intelligence was used to standardize revenue disclosures and track capacity or portfolio shifts, and an import-export shipment level database was selectively checked to validate cross-border movements. The desk sources listed here are illustrative only, and many other public references were used for data collection, validation, and clarification.
Primary Interviews and Surveys
Primary work focused on validating how coalescing agents are specified, purchased, and substituted across paints and coatings, adhesives and sealants, inks, and personal care formulations. We spoke with a mix of manufacturers, distributors, and formulators across APAC, EMEA, and the Americas, so assumptions on use rates, pricing movement, and the pace of low-VOC transitions could be checked against real buying and substitution behavior before finalizing outputs.
Distribution of primary research fieldwork respondents
| Company type | Respondent position | Region |
|---|---|---|
| Top tier: 34% | CXOs: 17% | APAC: 47% |
| Mid tier: 49% | Functional/Unit leaders: 33% | EMEA: 29% |
| Smaller Players: 17% | Managers: 50% | Americas: 24% |
Market-Sizing & Forecasting
Sizing starts with a top-down build where coatings and related formulation demand is reconstructed using waterborne share indicators, regulatory direction on VOC content, and observable production and trade signals. That demand is then converted into coalescing agent demand using typical dosage ranges and the application mix.
To keep the totals realistic, the outputs are corroborated with selective bottom-up approximations, including supplier revenue splits, sampled price per kilogram by chemistry family, and channel checks on inventory and lead times.
Key inputs used in the model include the share shift toward waterborne architectural paints, construction and renovation activity as a proxy for coatings volumes, regional industrial production trends, average selling price progression by chemistry (for example, glycol-ether based versus ester based), and substitution pressure from low-VOC and low-odor formulations. When data is thin in smaller countries, gaps are handled by using regional intensity factors tied to coatings output, then rebalanced to match what interview feedback suggests about local sourcing.
Forecasts are built using scenario analysis supported by a light multivariate regression on the most stable drivers, construction activity, industrial production, and waterborne adoption, and the result is then adjusted where experts indicate step changes, such as regulation timing or rapid reformulation cycles.
Data Validation & Update Cycle
Model results are checked against independent signals such as import-export direction, public capacity announcements, and whether implied consumption per ton of coatings stays within practical formulation ranges. Any sharp jumps in pricing, demand, or regional mix are flagged, reviewed by another analyst, and then traced back to a specific input change before sign-off.
The study is refreshed annually, and interim updates are triggered when material events occur, such as major regulatory actions or notable capacity additions. Before delivery, a final review pass is completed so clients receive an up-to-date view with the latest assumptions and conversions applied consistently.
Mordor Intelligence's Coalescing Agent Market Estimate Compared With Other Published Estimates
Published market sizes for coalescing agents can look different even when the topic sounds identical, because the underlying scope and the timing of the base year are not always aligned. Differences also come from how pricing is averaged, how waterborne adoption is treated by region, and whether validation is done with real formulation and channel feedback.
The largest gaps usually come from what gets counted as a coalescing agent versus adjacent solvents, and whether the model ties demand to coatings output signals or relies more on broad chemical additives spending. When currency conversions are taken at a single point in time and price inflation is applied uniformly, results can overshoot in fast-changing feedstock cycles, especially in APAC where local pricing behavior differs.
Benchmark comparison
| Source | Market Size | Gaps in Research Methodology |
|---|---|---|
| Mordor Intelligence | USD 1.24 B (2026) | |
| Global Consultancy A | USD 1.45 B (2024) | Uses a 2024 base and appears to emphasize broader high performance coatings demand, which can pull in adjacent additives and apply a faster price growth path across regions. |
| Industry Research Desk B | USD 1.27 B (2024) | Keeps the scope broad by type and application, but limited visibility is provided on how regional waterborne penetration and chemistry level price differences are validated year to year. |
The table shows that part of the spread is driven by the base year chosen, and part is driven by what is treated as in-scope product value. By tying the 2026 number to coatings output signals, typical dosage ranges, and chemistry-specific pricing checks rather than a single blended additive spend curve, the variance is reduced in the approach used by Mordor Intelligence.
Key Questions Answered in the Report
What is the current size of the coalescing agents market?
The coalescing agents market size stands at USD 1.24 billion in 2026.
How fast is the coalescing agents market expected to grow?
The market is forecast to expand at a 4.86% CAGR, reaching USD 1.57 billion by 2031.
Which region holds the largest share of the coalescing agents market?
Asia-Pacific leads with 38.40% of global revenue and is also the fastest-growing region.
Which product type dominates the coalescing agents market?
Hydrophobic coalescing agents command 60.10% market share, while hydrophilic grades show the highest growth momentum.
What is driving demand for coalescing agents in personal care applications?
Innovations in sustainable cosmetic emulsions and texture-enhancing formulations are propelling personal care demand at a 5.72% CAGR.