
Coal Trading Market Size and Share
Market Overview
| Study Period | 2021 - 2031 |
|---|---|
| Market Size (2026) | USD 13.37 Billion |
| Market Size (2031) | USD 16.64 Billion |
| Growth Rate (2026 - 2031) | 4.47 % |
| Fastest Growing Market | Asia Pacific |
| Largest Market | Asia Pacific |
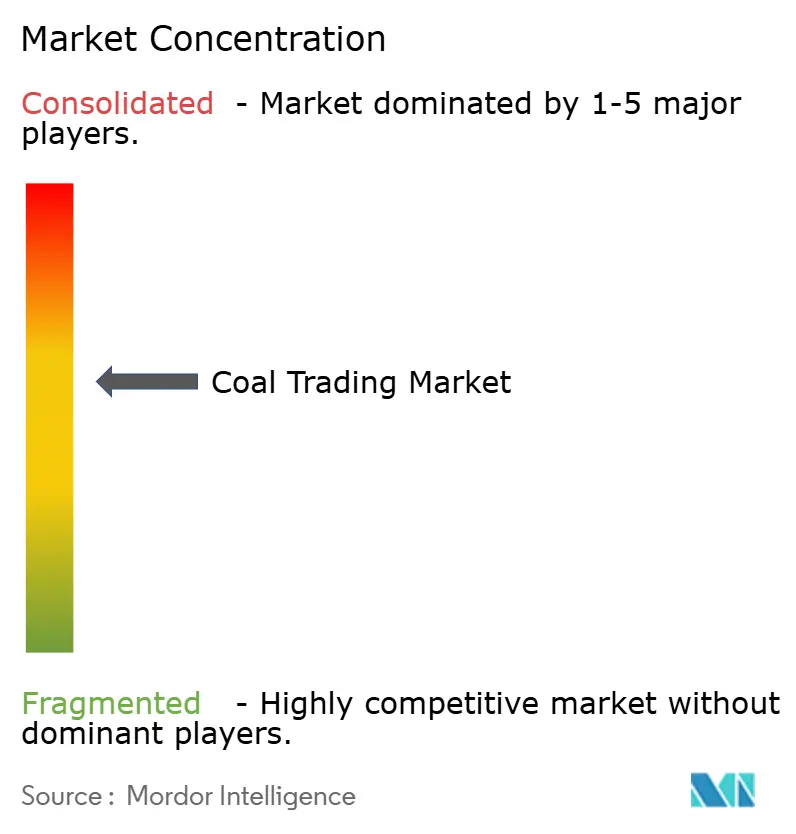
| Market Concentration | Medium |
Major Players *Disclaimer: Major Players sorted in no particular order Image © Mordor Intelligence. Reuse requires attribution under CC BY 4.0. | |
Coal Trading Market Analysis by Mordor Intelligence
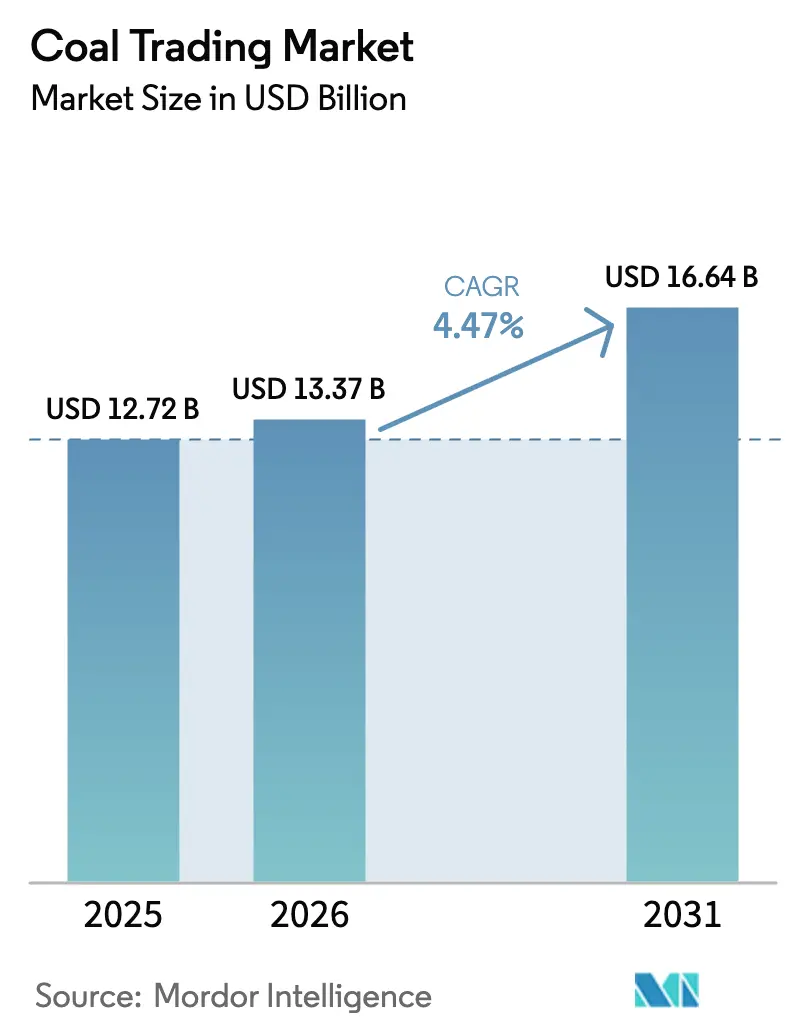
The Coal Trading Market size is projected to expand from USD 12.72 billion in 2025 and USD 13.37 billion in 2026 to USD 16.64 billion by 2031, registering a CAGR of 4.47% between 2026 to 2031.
Strong Asian utility procurement, European hedging against natural-gas volatility, and widening metallurgical-coal premiums over thermal grades sustain this measured expansion.[1]Reuters, “China Coal Imports Hit Record 548 Million Tonnes in 2024,” REUTERS.COM Long-term freight costs linked to IMO 2030 carbon-intensity rules have restored the appeal of fixed-price supply contracts, while port-capacity upgrades at Richards Bay and Qinhuangdao ease demurrage pressures and release stranded tonnage. Digital bill-of-lading platforms now settle 12% of seaborne trades, lowering working-capital needs for counterparties that can verify cargo quality in real time. Although renewable build-out in OECD economies crimps steam-coal demand, high-grade coking coal remains irreplaceable for blast-furnace steelmaking, giving the global coal trading market durable multi-segment demand diversity.[2]World Steel Association, “Global Steel Production and Coking Coal Demand 2024,” WORLDSTEEL.ORG
Key Report Takeaways
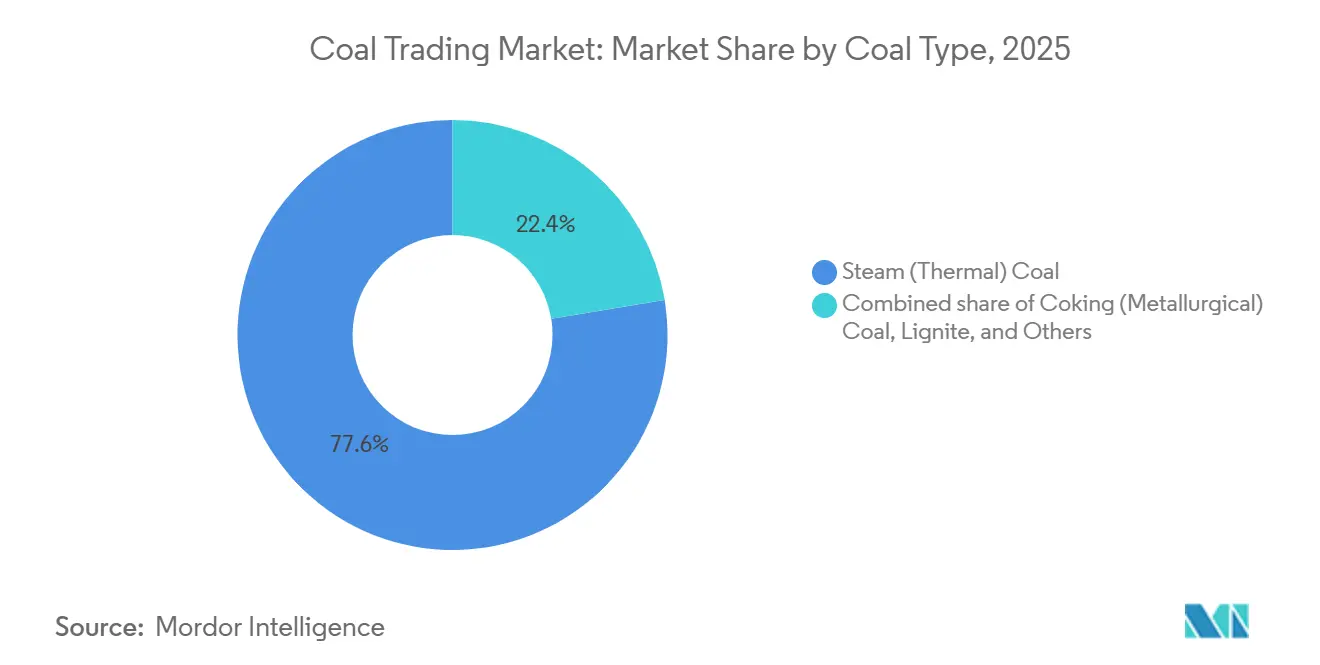
- By coal type, steam coal led with a 77.6% share of the global coal trading market in 2025, while coking coal is forecast to post the fastest 5.1% CAGR to 2031.
- By trader mechanism, long-term contracts held 60.5% of the global coal trading market in 2025, and this segment is projected to expand at a 6.7% CAGR through 2031.
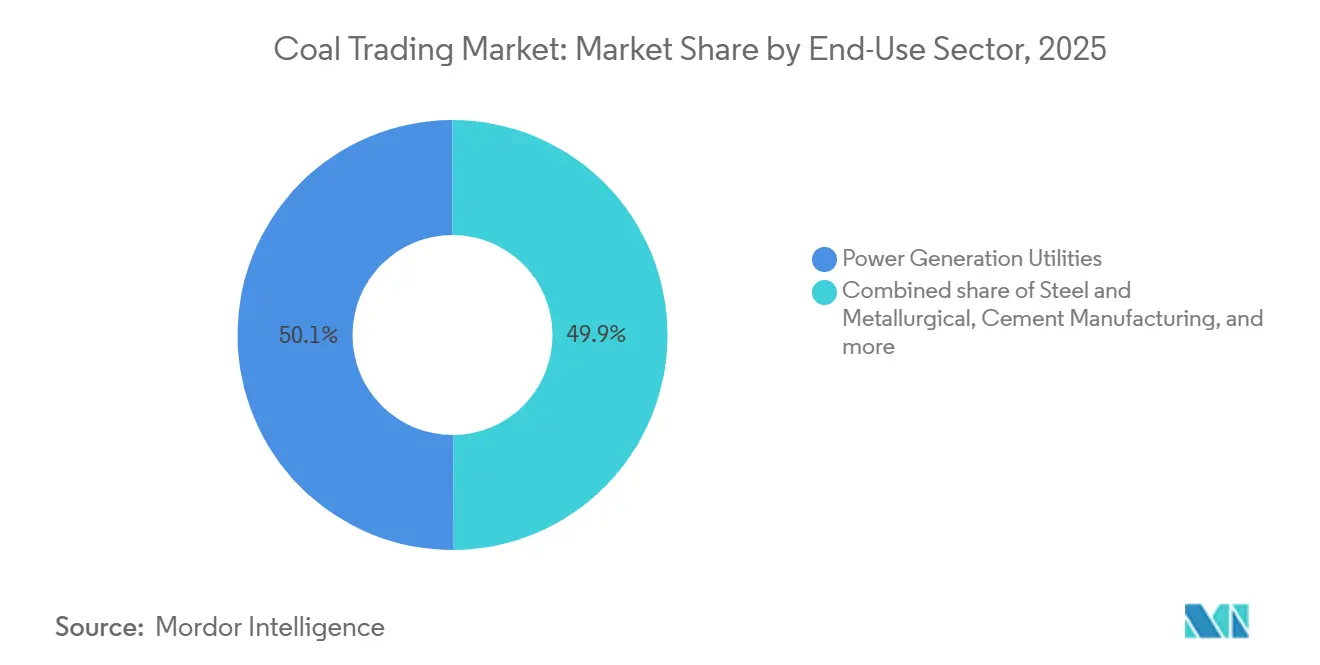
- By end-use sector, power generation commanded 50.1% of value in 2025; the steel segment is advancing at the highest 5.4% CAGR between 2026 and 2031.
- By geography, Asia-Pacific captured 66.9% revenue in 2025 and is expected to record a 4.9% CAGR over the forecast horizon.
Note: Market size and forecast figures in this report are generated using Mordor Intelligence’s proprietary estimation framework, updated with the latest available data and insights as of January 2026.
Global Coal Trading Market Trends and Insights
Drivers Impact Analysis*
| Driver | (~) % Impact on CAGR Forecast | Geographic Relevance | Impact Timeline |
|---|---|---|---|
| Surging Asian demand for sub-bituminous coal imports | +1.2% | Asia-Pacific core, spillover to Oceania exporters | Medium term (2-4 years) |
| Expansion of merchant coal-fired plants in emerging SE Asia | +0.8% | ASEAN | Long term (≥ 4 years) |
| Infrastructure bottleneck relief at Richards Bay & Qinhuangdao ports | +0.6% | South Africa and China export corridors | Short term (≤ 2 years) |
| Digitization of physical coal trading platforms & blockchain B/Ls | +0.4% | Global, early adoption in Singapore and Rotterdam hubs | Medium term (2-4 years) |
| India’s coastal shipping incentives for bulk cargo | +0.5% | India, secondary effects on Indonesian and Australian exporters | Short term (≤ 2 years) |
| Resurgence of European coal burn amid gas-price volatility | +0.7% | Europe | Short term (≤ 2 years) |
| Source: Mordor Intelligence | |||
Surging Asian Demand for Sub-Bituminous Coal Imports
Chinese and Indian utilities purchased 793 million t of imported coal in 2024, up 13% year-on-year, favoring low-sulfur Indonesian grades that avoid flue-gas desulfurization retrofits.[3]International Energy Agency, “Coal 2024: Analysis and Forecast to 2030,” IEA.ORG Sub-bituminous cargoes captured 65% of India’s thermal-coal imports because lower ash content reduces boiler maintenance intervals, extending turbine life and cutting outage risk. ASEAN power producers added 18 GW of coal capacity between 2020 and 2024, underpinning steady demand for 4,200–5,000 kcal/kg material that balances lower calorific value against sub-0.8% sulfur specifications. Indonesian dominance in this niche concentrates supply risk; Jakarta’s 25% domestic-market obligation has already withheld 18 million t from export channels during 2024 demand spikes, forcing Chinese buyers to diversify toward Russian Far-East coal.[4]Reuters, “China Coal Imports Hit Record 548 Million Tonnes in 2024,” REUTERS.COM
Expansion of Merchant Coal-Fired Plants in Emerging SE Asia
Independent power producers commissioned 12 GW of merchant coal plants across Vietnam, the Philippines, and Indonesia in 2024, sourcing fuel via quarterly tenders rather than decade-long utility contracts. These generators arbitrage between Indonesian 4,200 kcal/kg coal and Australian 5,500 kcal/kg grades, increasing spot-market turnover and stimulating regional coal brokerage desks. Merchant operators, lacking captive mines, procure all requirements on the open market, creating incremental demand for flexible blending and inventory-financing services that large traders can monetize. Vietnam’s Vinh Tan 4 extension and the Philippines’ Atimonan One Energy facilities illustrate this model, collectively importing 2.4 million t per quarter in 2025 contract tenders.
Infrastructure Bottleneck Relief at Richards Bay & Qinhuangdao Ports
Richards Bay Coal Terminal lifted throughput to 52.08 million t in 2024 after a ZAR 2.5 billion conveyor upgrade raised nameplate capacity to 77 million t. Qinhuangdao processed 208.83 million t the same year, aided by automated stacking systems that cut vessel waits by eight hours. Reduced congestion trims demurrage costs, historically USD 5–8/t during peak seasons, and frees traders to cycle vessels faster, effectively expanding fleet productivity. South Africa’s new 375 km rail bypass ensures coal trains avoid general freight bottlenecks, pointing export volumes toward 60 million t by 2026.
Digitization of Physical Coal Trading Platforms & Blockchain B/Ls
A 2024 Trafigura-ING blockchain pilot cut bill-of-lading processing from seven days to 24 hours and lowered financing margins by 15 basis points. Mercuria’s AI-enabled quality-monitoring network predicts ash and calorific value before berth, letting buyers reject off-spec cargo at load port, which curtails costly arbitration cycles. Blockchain consortia such as Komgo and Contour now clear 12% of coal trades by value, drawing smaller counterparties unable to post traditional collateral. Faster settlement unlocks working capital, enabling traders to scale volumes without balance-sheet strain, and collectively bolsters the global coal trading market.
Restraints Impact Analysis*
| Restraint | (~) % Impact on CAGR Forecast | Geographic Relevance | Impact Timeline |
|---|---|---|---|
| Accelerating renewable build-out under REPowerEU & IRA | –1.1% | North America & EU, spillover to APAC supply chains | Long term (≥ 4 years) |
| Stricter coal financing restrictions by OECD ECAs | –0.6% | Global, acute in Africa and Latin America | Medium term (2-4 years) |
| IMO 2030 carbon-intensity rules raising dry-bulk freight costs | –0.8% | Global, highest on Australia–Europe routes | Short term (≤ 2 years) |
| Mandatory domestic-market-obligation caps in Indonesia | –0.7% | Asia-Pacific importers dependent on Indonesian supply | Short term (≤ 2 years) |
| Source: Mordor Intelligence | |||
Accelerating Renewable Build-Out Under REPowerEU & IRA
REPowerEU targets 750 GW of renewables by 2030, displacing 120 million t of coal demand each year once wind and solar exceed 50% of generation in Germany, Spain, and Denmark. The U.S. Inflation Reduction Act funnels USD 369 billion into clean-energy credits, adding 40 GW of wind and solar annually and accelerating coal-to-gas switching across 15 GW of remaining coal capacity. China’s 217 GW solar build in 2024 alone signals that coal’s domestic generation share will slip to 45% by 2030. When wind and solar undercut coal’s levelized costs in eight months of the year, utilities curtail baseload coal units, trimming global seaborne steam-coal demand.
IMO 2030 Carbon-Intensity Rules Raising Dry-Bulk Freight Costs
The IMO’s Carbon Intensity Indicator, tightening annually to 2030, punishes high-emission Capesize vessels with lower charter ratings, forcing speed cuts or retrofits that translate into USD 3–5/t higher freight costs. Australia-to-Europe rates rose 22% in 2024 as owners passed through compliance expenses, wiping out traditional price advantages of distant suppliers. Delivered costs to Rotterdam increased USD 8/t during 2024 solely from freight surcharges, squeezing arbitrage margins for traders. Older vessels risk premature scrapping; fleet retirements will tighten capacity and keep freight elevated.
*Our forecasts treat driver/restraint impacts as directional, not additive. The impact forecasts reflect baseline growth, mix effects, and variable interactions.
Segment Analysis
By Coal Type: Metallurgical Grades Gain Momentum
Coking coal’s 5.1% forecast CAGR outpaces steam coal’s 4.2% as Indian and ASEAN blast-furnace expansions add 225 million t of crude-steel capacity by 2031. Although steam coal controlled 77.6% of the global coal trading market share in 2025, its growth moderates as renewables displace baseload coal in OECD regions. Lignite contributed just 3.8% of trade value and remains limited to intra-regional flows due to high moisture content.
Tight metallurgical supply widened premiums to USD 180/t over thermal coal in 2024 after Australian floods curtailed output, prompting Indian mills to import record volumes. The global coal trading market size tied to metallurgical grades is poised to expand further as steelmakers lock in multi-year contracts that secure consistent 65% fixed-carbon material. Steam-coal stability hinges on the successful deployment of carbon-capture retrofits across 20 GW of U.S. and EU capacity; absent these installations, steam-coal volumes will see a gradual decline after 2028.


By Trader Mechanism: Contracting Regains Primacy
Long-term agreements covered 60.5% of 2025 volume and are growing at 6.7% as buyers hedge IMO-linked freight volatility. Spot trading, while still liquid, expands at a slower 4.1% because rapid freight swings erode short-term arbitrage gains. Japanese utilities signed 5-year deals indexed to Newcastle plus USD 5/t that transfer freight risk to sellers.
Steel mills favor multi-year coking-coal contracts; power utilities now mix contract and spot cargoes to optimize monthly burn profiles. Contract sales settle within 15 days of discharge, freeing cash compared with 45-day spot cycles, and this efficiency is attracting capital-constrained traders. Consequently, the portion of the global coal trading market size tied to long-term contracts should exceed two-thirds by 2031.
By End-Use Sector: Steel Outpaces Power
Power generation still accounted for 50.1% of the value in 2025, yet a 3.9% CAGR trails the steel segment’s projected 5.4% growth. Integrated mills in India alone will import 28 million t of coking coal annually by 2031, sustaining metallurgical demand even as electric-arc furnace adoption remains nascent. Cement and chemicals grow at intermediate rates, anchored by Southeast Asian infrastructure programs and China’s coal-to-chemicals builds.
Power-sector coal demand is increasingly price elastic; India’s NTPC cut coal burn by 8 million t in 2024 by dispatching solar during daylight and cycling coal to evenings. Conversely, blast-furnace operations cannot tolerate quality variability, locking the steel supply chain into high-grade coal. These contrasts reinforce the global coal trading market’s dual-track outlook: steady if slower volumes in power and faster growth in metallurgical niches.
Geography Analysis
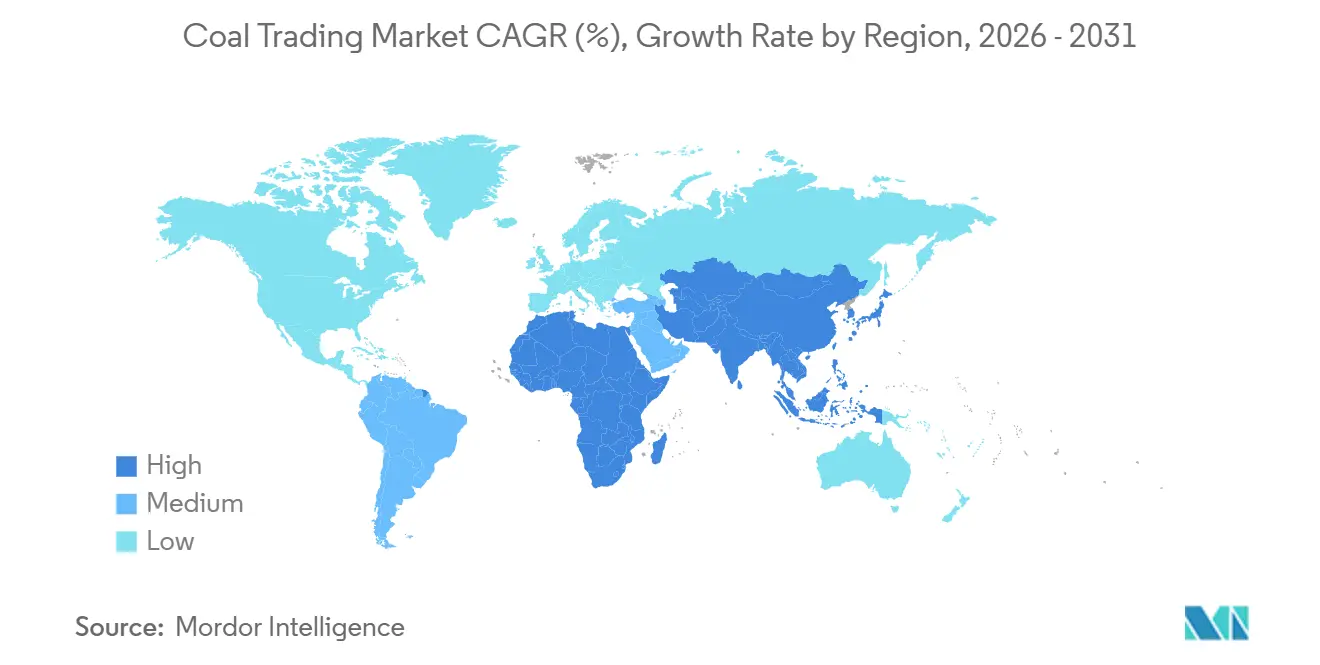
Asia-Pacific dominated the global coal trading market with a 66.9% share in 2025 and will grow at 4.9% through 2031. Within the region, China’s imports plateau near 550 million t by 2028 as domestic mines scale productivity, whereas India targets a reduction from 245 million t in 2024 to 180 million t by 2031 on rising local output. ASEAN demand climbs 6.2% yearly, underpinned by Vietnam’s 18 GW coal pipeline and the Philippines’ 55% coal share in Luzon grid generation.
Europe held 12.4% in 2025, experiencing a temporary 2.8% annual uptick until 2027 as gas prices remain volatile; thereafter, coal demand contracts 4.5% annually once REPowerEU renewable targets suppress dispatch economics. Germany’s imports reached 32 million t in 2024 but will trend to zero by 2038 under the legislated phase-out.
North America’s 8.7% share is export-oriented; the U.S. shipped 65 million t of mostly metallurgical coal in 2024, while importing only niche volumes for Appalachian steel mills. South America’s 6.2% portion revolves around Colombian exports that face community-driven output caps, shrinking 2.1% annually. Middle East & Africa captured 5.8%; Richards Bay’s capacity upgrades may lift South African exports to 60 million t by 2026, yet Transnet rail limits further growth.

Regulatory Landscape
Coal trading is being reshaped by tighter cross-border compliance and export governance in key supply corridors. The European Union continues to enforce a full import ban on Russian coal under its sanctions regime, which keeps compliance screening and origin traceability central to contracting for European deliveries and redirects seaborne flows toward alternative origins.
On the supply side, Indonesia enacted Government Regulation No. 24 of 2026 to centralize coal exports through state-owned export entities. The transition window from 1 June to 31 December 2026 requires private miners to submit export documents and contracts to PT Danantara Sumberdaya Indonesia (PT DSI). In the United States, an April 2025 Federal Register action amended Executive Order 14241 to remove selected regulatory barriers to domestic coal production, shaping upstream availability for export-linked grades and trader sourcing options.
Competitive Landscape
The global coal trading market is moderately concentrated; Glencore, Vitol, Trafigura, Mercuria, and China Shenhua handled about 40% of seaborne volumes in 2025 but exercise limited sway over price indices set by independent assessors. Vitol’s USD 208.9 million purchase of Noble Resources added 15 million t of origination and Indonesian storage, while Trafigura’s acquisition of Puma Energy’s desk secured African utility off-takes, illustrating consolidation among mid-tier platforms.
Glencore divested its 33.3% Cerrejón stake for USD 588 million, signaling a pivot from mining toward pure trading to redeploy capital into LNG and transition metals. Chinese SOEs such as China Shenhua and China Coal produced 304.3 million t and 120 million t respectively in 2024 and now extend into export channels, leveraging state-owned port access to challenge incumbent Western traders.
Blockchain adoption remains uneven; Singapore and Rotterdam clear 12% of coal trades digitally, yet Latin American and African cargoes still rely on paper documents that add a week to settlement. Rising freight costs and OECD finance curbs will likely winnow the active number of global coal desks from 25 in 2024 to fewer than 15 by 2031, further concentrating the competitive field.
Coal Trading Industry Leaders
Trafigura Group Pte. Ltd.
Glencore Plc.
Mercuria Energy Group
Vitol Holding B.V
China Shenhua Energy Co Ltd
- *Disclaimer: Major Players sorted in no particular order

Market Opportunities and Future Outlook
Traders face a narrow execution gap where policy-driven rerouting of supply overlaps with the need for faster, lower-risk processing. Indonesia's Government Regulation No. 24 of 2026, which transitions coal exports toward centralized handling via PT DSI through end-2026, raises the value of firms that can adjust contracting, documentation, and financing workflows to a more state-mediated export channel, while still meeting buyer scheduling and quality requirements.
Opportunity also concentrates in corridors and markets where physical expansion and procurement remain active despite slower global trade. Vietnam stands out among major importers with imports referenced around 64 million tonnes in 2026, supporting demand for procurement, blending, and inventory-financing services in Southeast Asia. On the export logistics side, Port Alliance Group's Osterra coal terminal project in Khabarovsk Krai advanced in April 2026 with delivery of Phase 2 equipment for the KIP-40 program, targeting 40 million tonnes per year of throughput and enabling additional cargo origination and structured offtake. In the United States, the April 2026 Executive Order to Reinvigorate America's Beautiful Clean Coal Industry, alongside EIA-noted variability in coal plant retirements versus schedules, highlights how policy actions can extend short-term trading windows tied to utility burn and stock management, sustaining hedging and term-contract activity where local rules allow it.
Recent Industry Developments
- June 2026: Glencore Plc, Trafigura Group Pte. Ltd., and Mercuria Energy Group were identified as key investors linked to the planned Hong Kong listing of Merdeka. The development ties major commodity trading houses more directly to upstream and regional mining finance, tightening the link between capital markets access and physical offtake positioning.
- February 2025: Vitol Holding B.V. downsized its China thermal coal trading operations, including staff reductions in its Beijing office, according to Reuters. The pullback indicates a recalibration of risk and opportunity in a key demand center, with potential knock-on effects for liquidity and counterparty availability across other hubs and routes.
- August 2024: Vitol closed its USD 208.9 million acquisition of Noble Resources, lifting its coal trading platform scale with added origination and Indonesian storage. The integration strengthened Vitol's logistics-backed supply programs and supported efforts to compete more aggressively for term contracts in Asia-linked trade flows.


Research Methodology Framework and Report Scope
Market Definition and Coverage
For this study, the coal trading market is defined as the value of services that enable coal to be bought and sold (spot deals and contract-based trading), including trader margins, brokerage, and related commercial handling linked to moving coal from origin to buyer.
Scope exclusions: This sizing does not count the full value of coal as a mined commodity, inland mining operations, or end-user power generation and steel production revenue.
Segmentation Overview
- By Coal Type
- Steam (Thermal) Coal
- Coking (Metallurgical) Coal
- Lignite
- Others
- By Trader Mechanism
- Spot Trading
- Long-term Contracts
- By End-use Sector
- Power Generation Utilities
- Steel and Metallurgical
- Cement Manufacturing
- Chemical/Industrial Heating
- Others (Residential, Commercial, Transport)
- By Geography
- North America
- United States
- Canada
- Mexico
- Europe
- United Kingdom
- Germany
- France
- Spain
- NORDIC Countries
- Russia
- Rest of Europe
- Asia-Pacific
- China
- India
- Japan
- South Korea
- ASEAN Countries
- Rest of Asia-Pacific
- South America
- Brazil
- Argentina
- Colombia
- Rest of South America
- Middle East and Africa
- United Arab Emirates
- Saudi Arabia
- South Africa
- Rest of Middle East and Africa
- North America
Data Sources, Market Sizing, and Validation
Desk Research
Desk research was used to establish the factual base for trade flows, demand signals, and price markers that influence trading activity. We relied on public sources such as UN Comtrade trade statistics, International Energy Agency coal demand balances, U.S. Energy Information Administration datasets, World Bank commodity price series, and selected customs and port authority releases where available.
To keep assumptions realistic, the desk work was cross-checked against annual reports and investor presentations of listed participants, industry association publications, and reported seaborne benchmark price commentary from reputable press. In a few places, paid subscriptions for company financials and news intelligence, plus shipment-level import and export databases, were used to confirm volumes, routes, and timing. These examples are not exhaustive, and additional public and commercial sources were also used for collection, validation, and clarification.
Primary Interviews and Surveys
Primary work focused on interviews and structured surveys with coal traders, logistics and shipping-linked teams, port and terminal operators, and procurement roles at major consuming industries, so the revenue logic reflected how deals are typically contracted in the market. Global coverage was maintained by speaking across APAC, EMEA, and the Americas, and then using the feedback to validate desk assumptions on margins, contract mixes, and typical pricing adjustments.
Distribution of primary research fieldwork respondents
| Company type | Respondent position | Region |
|---|---|---|
| Top tier: 29% | CXOs: 16% | APAC: 41% |
| Mid tier: 49% | Functional/Unit leaders: 38% | EMEA: 37% |
| Smaller Players: 22% | Managers: 46% | Americas: 22% |
Market-Sizing & Forecasting
The market was first reconstructed using a top-down approach where trade and consumption signals were translated into a realistic traded coal pool, then connected to typical trading take-rates. We also ran bottom-up approximations as a cross-check, for example sampled margin per ton ranges from interviews, channel checks on contract versus spot mix, and simple volume times implied service yield calculations. Where the two views diverged, we adjusted the model and reconciled back to observed trade and pricing patterns.
Inputs used in the model included seaborne and domestic coal trade volumes, benchmark coal price movements that influence value capture, the share of spot trading versus long-term contracts, freight and port handling constraints that shape routing choices, and demand shifts from power generation, steel, cement, and industrial heating. For forecasting, scenario analysis was applied around demand and price paths, with scenarios anchored to expert views on contract renewal cycles and expected margin normalization. When country-level information was thin, we used regional proxies and trade partner mirroring from customs data, and then re-tested those assumptions during primary follow-ups.
Data Validation & Update Cycle
Outputs were validated through triangulation across independent signals, including checking whether implied traded tonnage and pricing progression remained consistent with widely observed coal balance trends and published trade series. Large variances were flagged, re-worked, and reviewed in steps, first by the analyst building the model and then by a separate reviewer before sign-off.
We also run anomaly checks for sudden jumps driven by currency moves, price spikes, or one-off trade disruptions, and we re-contact sources when those breaks do not align with on-the-ground explanations from market participants. The report is refreshed annually, and interim updates are made when material events affect trade routes, pricing benchmarks, or policy constraints. Before delivery, the dataset and calculations are rechecked so clients receive an updated view based on the latest available information.
Mordor Intelligence's Coal Trading Market Size Compared Against Other Published Estimates
Published market sizes for coal trading often spread widely because the counted revenue pool can shift based on whether the full coal commodity value is included, or only the trading service value is counted. Differences also come from how pricing is averaged across the year, how currency conversion is timed, and whether a model is refreshed after major coal price and freight swings.
A common gap driver is ASP logic, where some studies use annual average coal prices and multiply them by traded volumes. This pushes the result closer to the value of coal itself rather than the value of intermediation activity. Another driver is the update cycle, since using older benchmark price points or fixing FX at a single month can drift from realized trading economics. That drift is usually visible when outputs are checked against trade flow shifts and contract mix changes, which is why Mordor Intelligence applies refresh-led validation as part of the review approach.
Benchmark comparison
| Source | Market Size | Gaps in Research Methodology |
|---|---|---|
| Mordor Intelligence | USD 13.37 B (2026) | |
| Global Publisher A | USD 89.10 B (2024) | This figure appears to scale market value mainly from coal volumes and broad coal value pools, which can unintentionally include more of the underlying coal commodity value rather than focusing on trading service yield and margins. |
| Global Publisher B | USD 227.74 B (2024) | The scope description includes coal forms, transport modes, and wide end-use coverage, which typically aligns with a commodity-value style build that is highly sensitive to coal price levels and can overstate trading revenue when prices spike. |
The comparison shows that the main spread is driven by what is being monetized, either the traded coal itself or the service layer that enables the deal. By keeping the scope tied to trading-linked value capture and by rechecking pricing and FX timing against trade and contract signals, the resulting number stays more traceable to repeatable inputs and clearer market boundaries.


Key Questions Answered in the Report
What is the current value of the global coal trading market?
The global coal trading market size stood at USD 13.37 billion in 2026 and is projected to reach USD 16.64 billion by 2031.
Which coal type is growing fastest in international trade?
Coking coal is forecast to register the highest 5.1% CAGR between 2026 and 2031, driven by new blast-furnace capacity in India and ASEAN.
Why are long-term contracts gaining share in coal trading?
Rising freight volatility linked to IMO 2030 rules makes fixed-price supply agreements attractive, pushing long-term contracts to 60.5% of 2025 volume and a 6.7% growth trajectory.
How will renewable energy targets affect coal demand in Europe?
REPowerEU's 750 GW renewable goal is expected to cut European coal burn after 2027, causing regional demand to decline 4.5% annually from 2028 onward.
Which region dominates global coal trade?
Asia-Pacific accounted for 66.9% of 2025 value and is projected to grow at a 4.9% CAGR through 2031.
What is the level of market concentration among coal traders?
The top five traders handle roughly 40% of seaborne volumes, indicating moderate concentration.
Page last updated on:


 Your data is secure and never sold or shared.


