
Market Overview
| Study Period | 2020 - 2031 |
|---|---|
| Market Size (2026) | USD 7.71 Billion |
| Market Size (2031) | USD 10.70 Billion |
| Growth Rate (2026 - 2031) | 6.78 % |
| Fastest Growing Market | Africa |
| Largest Market | Asia-Pacific |
| Market Concentration | Low |
Major Players
*Disclaimer: Major Players sorted in no particular order Image © Mordor Intelligence. Reuse requires attribution under CC BY 4.0. |
|
CNG and LPG Vehicle Market Analysis by Mordor Intelligence
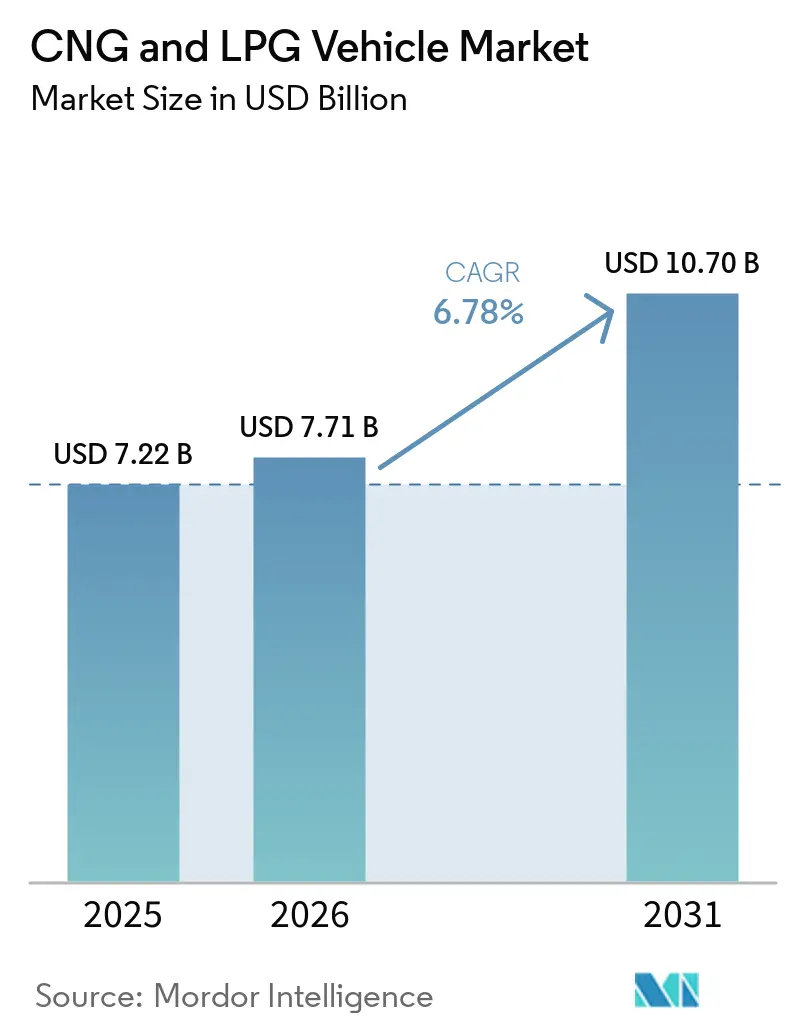
The global CNG and LPG vehicle market size in 2026 is estimated at USD 7.71 billion, growing from 2025 value of USD 7.22 billion with 2031 projections showing USD 10.7 billion, growing at 6.78% CAGR over 2026-2031. Rising government incentives, expanding refueling infrastructure, and technology that removes legacy usability barriers have moved the CNG and LPG vehicle market from a niche alternative into a mainstream option. Fleet operators now view gaseous fuels as long-term bridge solutions that deliver lower operating costs and assured regulatory compliance. Rapid station rollout, particularly in Asia-Pacific and Africa, improves range confidence, while twin-cylinder packaging and automated transmissions bring feature parity with petrol versions. Renewable natural gas (RNG) and bio-CNG unlock fresh decarbonization levers and hedge fossil-gas price swings, drawing commercial fleets that prioritize Scope 3 emission cuts. Competitive intensity is rising as established automakers broaden factory-fitted line-ups and new entrants court logistics, transit, and ride-hailing segments with turnkey bio-CNG services.
Key Report Takeaways
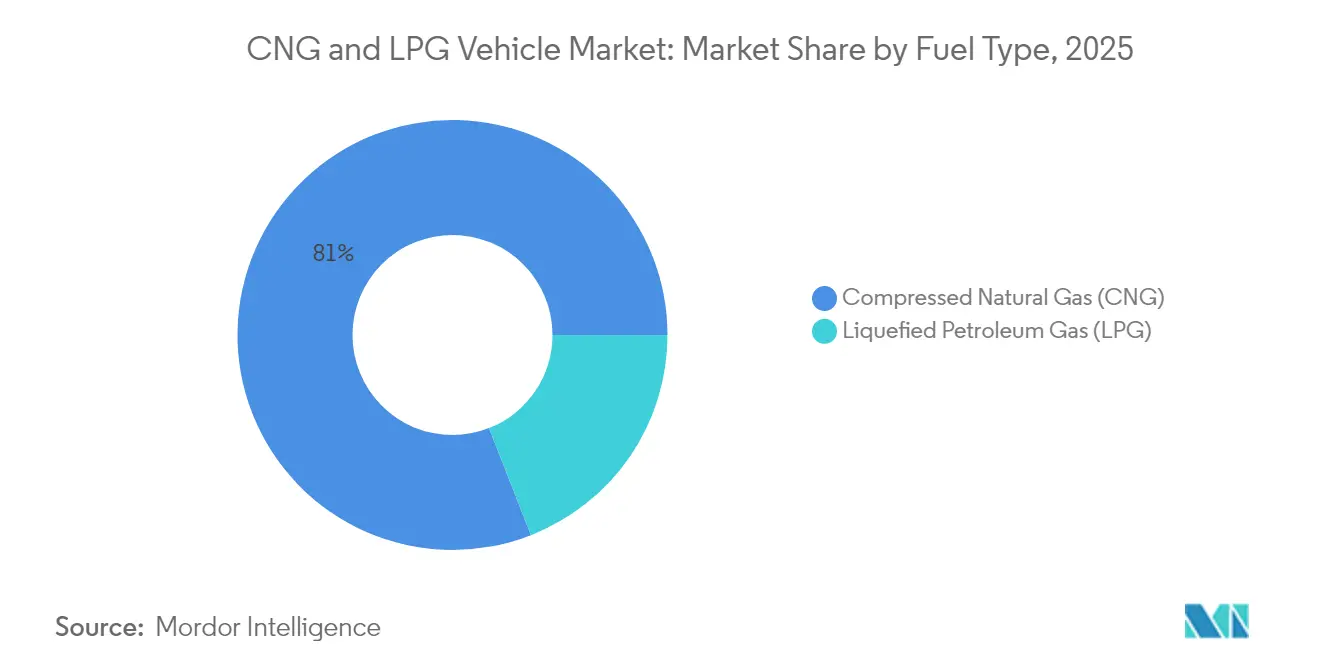
- By fuel type, Compressed Natural Gas held 80.95% of the CNG and LPG vehicle market share in 2025, whereas Compressed Bio-Gas is projected to advance at a 12.42% CAGR to 2031.
- By vehicle type, passenger cars led with 62.10% revenue share in 2025; two- and three-wheelers are forecast to expand at a 10.55% CAGR through 2031.
- By sales channel, OEM-fitted models accounted for 70.35% of the CNG and LPG vehicle market size in 2025, while retrofits recorded the highest projected CAGR at 10.49% to 2031.
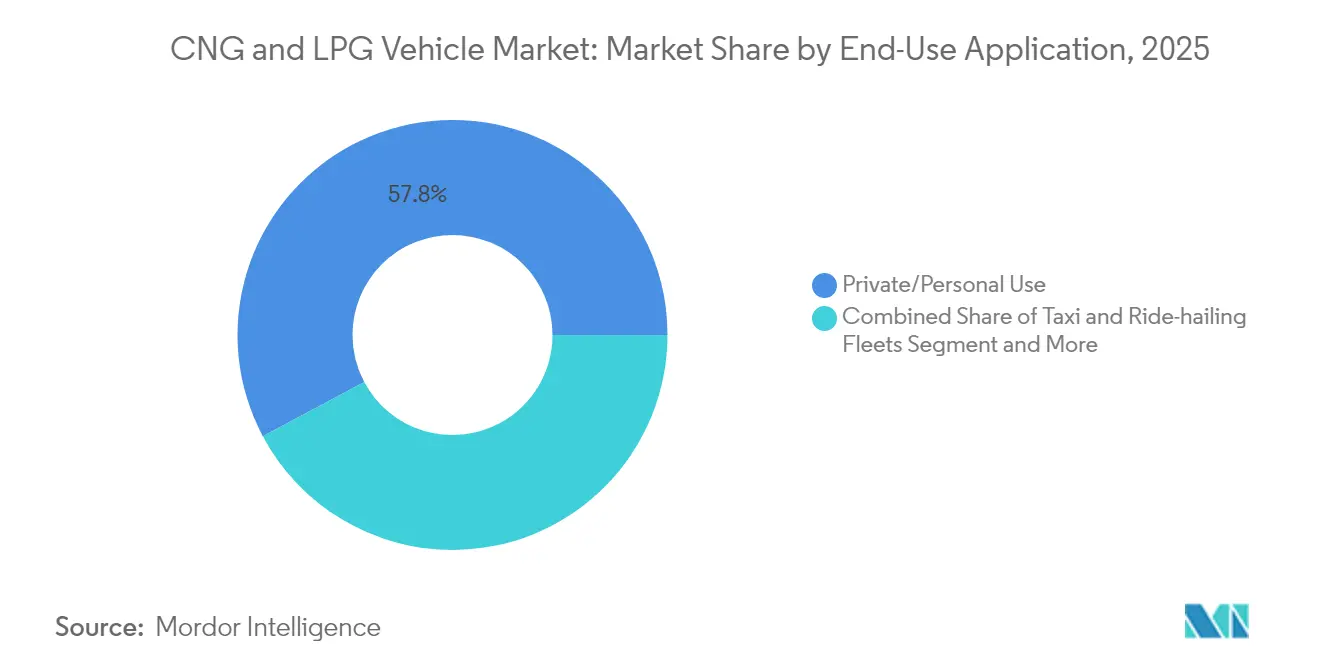
- By end-use application, private use comprised 57.80% of 2025 revenues; taxi and ride-hailing fleets are poised for an 8.62% CAGR to 2031.
- By cylinder type, Type I all-metal cylinders captured 64.60% of 2025 demand, yet Type IV polymer-liner composites will register a 15.96% CAGR through 2031.
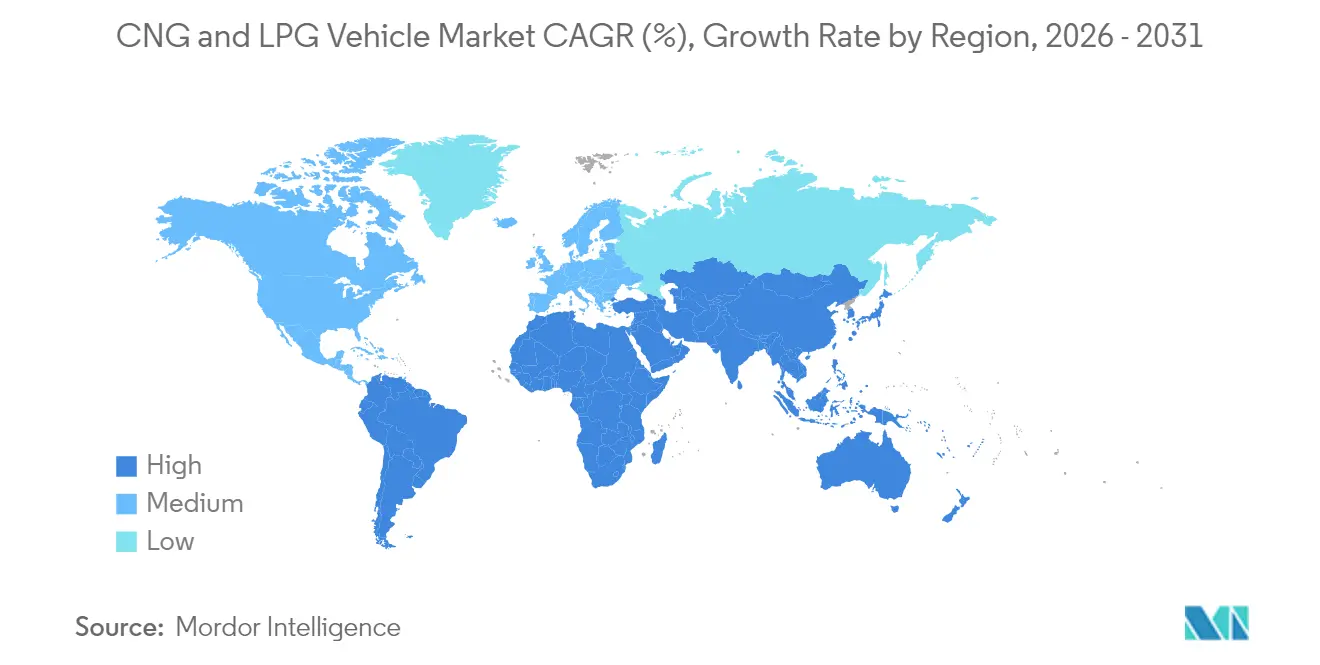
- Asia-Pacific dominated with 45.60% market share in 2025; Africa is the fastest-growing region at a 12.97% CAGR to 2031.
Note: Market size and forecast figures in this report are generated using Mordor Intelligence’s proprietary estimation framework, updated with the latest available data and insights as of 2026.
Global CNG and LPG Vehicle Market Trends and Insights
Drivers Impact Analysis*
| Driver | (~) % Impact on CAGR Forecast | Geographic Relevance | Impact Timeline |
|---|---|---|---|
| Government Incentives And Fuel-Price Parity | +2.1% | Global (India, Nigeria, Brazil) | Medium term (2-4 years) |
| Refueling Infrastructure Expansion | +1.8% | Asia-Pacific, MEA, South America | Long term (≥ 4 years) |
| OEM Shift To Factory-Fitted Variants | +1.4% | India, Europe, South America | Medium term (2-4 years) |
| Stricter Urban CO₂/NOx Norms | +1.2% | Europe, North America, Asia | Short term (≤ 2 years) |
| Twin-Cylinder Packaging Innovations | +0.8% | India, Southeast Asia | Short term (≤ 2 years) |
| Commercial Demand For Bio-CNG | +0.6% | North America, Europe, Asia | Long term (≥ 4 years) |
| Source: Mordor Intelligence | |||
Government Incentives and Fuel-Price Parity Initiatives
Multi-layered incentive programs are rewriting fleet economics. Nigeria’s USD 450 million Presidential CNG Initiative couples station rollout with conversion vouchers, completing more than 10,000 vehicle upgrades and training 4,000 technicians. California’s Drive Clean! rebates of up to USD 3,000 per light-duty vehicle plus an RNG tax credit proposal further sweeten payback periods[1]"Natural Gas Laws and Incentives in California," Alternative Fuels Data Center, afdc.energy.gov. The UAE’s Natural Gas for Vehicles program has installed dispensers able to serve 10,000 cars daily, guaranteeing supply for early adopters. Together, these actions reposition the CNG and LPG vehicle market as a strategic bridge to net-zero rather than a stop-gap[2]UAE Government, "Efforts to Achieve Green Economy," The Official Portal of the UAE Government, u.ae.
Rapid Expansion of CNG/LPG Refueling Infrastructure
Station growth has shifted from public grants to commercial capital, signaling cash-flow viability. Clean Energy Fuels is constructing Houston’s first private bus-depot CNG station sized for 2 million gallons per year. TotalEnergies operates more than 1,200 public pumps across three continents, strategically co-located on freight corridors to secure utilization. India targets 10,000 stations by 2030, underpinning Maruti Suzuki’s plan to sell 600,000 factory-fitted CNG units in FY2025[3]Ketan Thakkar, "Maruti Suzuki aims to sell 6 lakh CNG cars, SUVs in FY2025," Autocar India, autocarindia.com. A denser network alleviates range anxiety and unlocks intercity freight opportunities, driving sustained demand across the CNG and LPG vehicle market.
OEM Portfolio Shift Toward Factory-Fitted CNG Variants
Automakers are embedding CNG technology into core platforms. Tata Motors’ twin-cylinder Punch and Altroz preserve luggage volume while delivering 77 hp, removing practicality hurdles. Maruti Suzuki already offers 14 CNG trims and reports the fuel option in 36% of India’s passenger-vehicle sales. Nissan is adding CNG compatibility as part of its 2026 electrification roadmap, treating gaseous fuel as complementary to hybrids. Factory integration lowers warranty risk, tightens emissions certification, and compresses price premiums, lifting overall penetration of the CNG and LPG vehicle market.
Stricter Tail-Pipe CO₂ and NOx Norms in Urban Clusters
Regulators favor CNG for immediate emission relief. Paris’s diesel ban effective 2025 pushes commercial fleets toward low-NOx alternatives, while India’s 2027 Corporate Average Fuel Efficiency targets are steering OEMs to expand gaseous-fuel trims. Trials show CNG engines cut carbon monoxide 90–97% versus petrol and deliver 30% fuel-efficiency gains, allowing operators to enter low-emission zones at lower cost than electric. These compliance advantages translate to purchasing decisions that reinforce growth momentum in the CNG and LPG vehicle market.
Restraints Impact Analysis*
| Restraint | (~) % Impact on CAGR Forecast | Geographic Relevance | Impact Timeline |
|---|---|---|---|
| Limited Crash-Test Protocols | -1.2% | Global | Medium term (2-4 years) |
| LNG Feedstock Price Volatility | -1.0% | Asia-Pacific, Europe | Short term (≤ 2 years) |
| EV-Capex Subsidies in Metros | -0.8% | North America, Europe, Asia | Long term (≥ 4 years) |
| Safety Perception Gaps | -0.6% | Developed markets | Medium term (2-4 years) |
| Source: Mordor Intelligence | |||
Limited Crash-Test Protocols for Gaseous-Fuel Vehicles
The February 2024 Wilmington truck explosion unveiled gaps in global standards. While Federal Standard 304 addresses tank integrity, holistic vehicle-level tests remain scarce, raising liability for fleets and insurers. ISO 11439 sets cylinder criteria but lacks crash simulations, slowing OEM roll-outs in risk-averse regions. Until authorities harmonize dynamic tests, these safety uncertainties will trim some upside from the CNG and LPG vehicle market.
Price-Volatility in LNG Feedstock for City-Gas Operators
Spot LNG averaged above USD 13/MMBtu through 2024, breaching affordability thresholds in India and parts of Europe. Supply risks tied to geopolitical tension and pipeline contract expirations stoke uncertainty, forcing city-gas distributors to pass costs to retail pumps. CNG pump prices in 37 U.S. states climbed through 2023, narrowing the parity gap with diesel and dampening new fleet conversions. Although new liquefaction projects may ease tightness after 2026, short-term volatility is likely to temper aggressive expansion plans in the CNG and LPG vehicle market.
*Our forecasts treat driver/restraint impacts as directional, not additive. The impact forecasts reflect baseline growth, mix effects, and variable interactions.
Segment Analysis
By Fuel Type: Bio-CNG Emerges as Growth Leader
Compressed Bio-Gas is forecast to clock a 12.42% CAGR to 2031, while Compressed Natural Gas maintains an 80.95% 2025 CNG and LPG vehicle market share. India’s planned 40-fold jump in bio-CNG demand by FY2030, enabled by agriculture-waste digesters, highlights the pivot to renewables. Early launches such as the Maruti Brezza CBG posting 25.51 km/kg underline commercial viability. Concurrently, LPG maintains pockets of strength where legacy infrastructure exists, supported by Qatar and the UAE’s LNG projects that swell LPG supply. Regional fuel choices, therefore, mirror local feedstock abundance and policy pushes rather than pure technology merit.
The CNG and LPG vehicle market size for bio-CNG passenger cars is projected to expand at 14.6% yearly as dairy, distillery, and municipal-waste producers sign offtake deals that lock in input costs. Conversely, fossil-gas variants are growing in single digits as operators hedge against carbon taxes. The divergent trajectories show that while the overarching CNG and LPG vehicle market continues to widen, the internal mix is tilting toward renewable gas formulations.


By Vehicle Type: Two-Wheelers Drive Innovation
Passenger cars controlled 62.10% of spending in 2025, yet two- and three-wheelers will deliver the sharpest 10.55% CAGR, supported by the growing adoption of CNG vehicles in emerging markets. Bajaj Auto’s success in pushing CNG three-wheeler penetration from 26% to 57% between 2020 and 2023 builds technical confidence for its first CNG motorcycle in 2025. Light commercial vehicles and buses also feature prominently as duty cycles justify on-site station investments, amplifying the total CNG and LPG vehicle market size for commercial segments over the forecast window.
Increasing urban freight restrictions on diesel accelerate mini-truck adoption, while transit authorities opt for 12-year bus tenders that secure RNG supply contracts upfront. Together, these dynamics cement a diverse demand profile in the CNG and LPG vehicle market, anchored by cost-conscious two-wheelers and volume-driven commercial fleets.
By Sales Channel: Retrofit Market Gains Momentum
OEM-fitted units captured 70.35% revenue in 2025, yet retrofits are set for a 10.49% CAGR as expanding infrastructure shortens payback cycles. Nigeria’s conversion vouchers exemplify policy-led aftermarket surges. Average retrofit costs of EUR 3,000–5,000 offer a two-year breakeven for high-mileage taxis, enlarging the CNG and LPG vehicle market size within the existing vehicle parc rather than relying solely on new sales.
Factory-fitted models still dominate fleet tenders thanks to integrated safety validation and full warranty coverage. Tata Motors’ twin-cylinder SUV line-up and Maruti Suzuki’s automatic-transmission CNG trims demonstrate OEM commitment to mainstreaming gaseous fuel. These dual pathways—retrofit for legacy assets and factory installs for new purchases—provide parallel engines of growth inside the CNG and LPG vehicle market.
By End-Use Application: Fleet Segments Lead Adoption
Private motorists represented 57.80% of 2025 volumes, but taxi and ride-hailing operators will log an 8.62% CAGR as companies pursue cheaper fuel and municipal emission targets. UPS’s 15-liter CNG truck order showcases logistics sector momentum. Waste management fleets, already deep adopters, add stability to the CNG and LPG vehicle market by guaranteeing multi-shift utilization of depot stations.
Public transit systems reinforce demand with long-term bus procurement. Houston METRO’s 120-unit RNG bus deployment backstops Clean Energy Fuels’ new station economics, demonstrating how public contracts catalyze private capital. Industrial utility fleets also expand due to predictable routing that maximizes station throughput, ensuring diversified end-use growth across the CNG and LPG vehicle market.
By Cylinder Type: Composite Technology Advances
Type I steel cylinders accounted for 64.60% of units in 2025, reflecting cost advantages and mature supply chains. However, the CNG and LPG vehicle market share for Type IV composites is rising rapidly, propelled by a 15.96% CAGR forecast. Carbon-fiber demand for pressure vessels is projected to jump 42% annually through 2025 as weight-saving mandates tighten. Hexagon Purus and Forvia Faurecia are scaling production capacity, trimming per-unit costs.
Intermediate Type II and Type III formats cater to fleets balancing price and payload. Federal safety rules that favor tested composite solutions will further nudge OEMs toward lighter tanks, especially in two-wheeler and passenger-car segments where space is scarce. Cylinder choice is therefore becoming a strategic differentiator within the broader CNG and LPG vehicle market.
Geography Analysis
Asia-Pacific commanded 45.60% of 2025 revenue. India’s milestone—CNG car sales overtaking diesel in early 2025—illustrates consumer acceptance; 6,959 stations underpin convenient access while twin-cylinder packaging addresses boot-space objections. China relies on CNG for heavy-duty freight routes where battery mass remains uneconomic, reinforcing the region’s anchor role in the CNG and LPG vehicle market.
Africa is the fastest-advancing territory, posting a 12.97% CAGR to 2031. Nigeria’s USD 450 million infrastructure program, with a 1 million-conversion target, anchors supply certainty, while South Africa’s gas-to-power ambitions create additional pull. Abundant domestic gas and limited legacy automotive investment lower switching friction, accelerating the CNG and LPG vehicle market’s penetration. South America delivers an 7.98% CAGR, underpinned by Brazil’s biofuel culture and Argentina’s gas reserves. Brazil’s ethanol flex-fuel heritage eases consumer education, and RNG pilot volumes seek transport buyers, feeding the CNG and LPG vehicle market. Hyundai’s USD 1.1 billion green-mobility plan suggests OEMs perceive the continent as strategic for alternative fuels. Europe maintains a 5.12% pace, with Germany expanding biomethane output that feeds into station networks and broadens adoption.

Regulatory Landscape
Regulation is tightening around both emissions and gaseous-fuel system safety, while some governments are streamlining permitting to accelerate station rollout. In the European Union, Euro 7 (Regulation (EU) 2024/1257) sets updated emission requirements covering light- and heavy-duty vehicles, including CNG and LNG powertrains, with key provisions applying to new M1 and N1 vehicle types from 29 November 2026; this shifts OEM certification and aftertreatment calibration timelines into the 2025-2026 window.
On safety and integrity, UNECE Regulation No. 110 continues to anchor type-approval requirements for vehicles using CNG and components, while the United States has tightened attention on CNG system integrity through Federal Motor Vehicle Safety Standards (FMVSS) No. 303 actions published in the Federal Register in June 2026. In India, policy is simultaneously supporting infrastructure and renewable gas uptake: PNGRB introduced a Compressed Bio-Gas blending obligation for CNG (transport) and PNG (domestic) segments at 1% (FY 2025-26), 3% (FY 2026-27), and 4% (FY 2027-28), and the Ministry of Road Transport and Highways issued an accelerated approval framework for City Gas Distribution infrastructure that shortens RoW approvals to 15 days and access permissions for CNG/LCNG stations to 30 days (as a time-bound measure linked to LPG supply constraints).
Value Chain Analysis
The value chain begins upstream with natural gas and LPG production and processing, and increasingly with biomethane/bio-CNG from agricultural, municipal, and industrial waste streams that require digesters, upgrading, and compression before dispensing. Midstream and downstream participants include city gas distributors and station developers (public retail networks and private depot stations), followed by OEMs offering factory-fitted CNG/LPG variants and certified retrofitters serving the in-use parc. A critical enabling layer spans cylinders (Type I through Type IV), valves, regulators, fuel rails, ECUs and injectors, along with homologation, inspection, and service networks; quality and traceability norms such as IATF 16949 and safety processes aligned to ISO 26262 shape supplier qualification.
Key bottlenecks remain concentrated in (i) certification and homologation lead times that slow new platform availability, (ii) uneven aftermarket conversion quality and shortages of technicians capable of correct ECU calibration and gas-injection tuning, and (iii) availability constraints for Type IV composite cylinders as OEMs and fleets pursue weight and packaging benefits. Infrastructure deployment can also lag headline investment announcements, with rollouts often concentrated along pilot freight corridors; in North America, the network stands at roughly 1,400 NGV fueling stations as of early 2026, which affects route planning and fleet tender eligibility. These constraints elevate the role of integrated offerings where fuel supply (including RNG), depot stations, and OEM-grade hardware validation are bundled for fleets.
Competitive Landscape
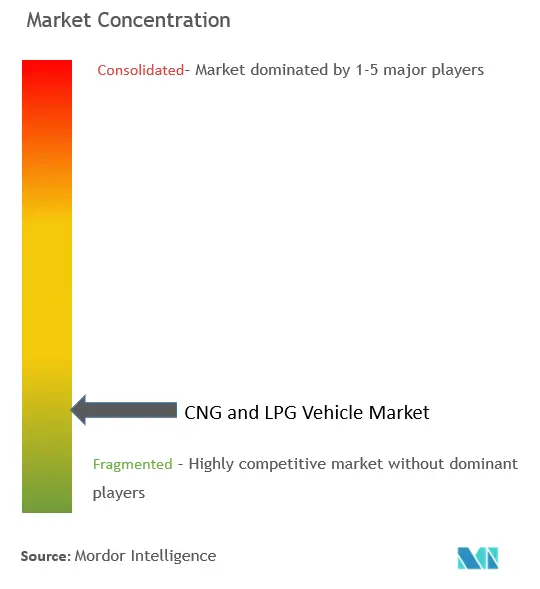
The CNG and LPG vehicle market is characterized by moderate fragmentation, indicating a competitive environment where no single player dominates entirely. Several factors influence the competitive dynamics within this market. These include vertical integration, technological advancements, and access to retail financing options. Sheer scale, while important, isn't the sole determinant of success. Maruti Suzuki is a prominent player in the CNG and LPG vehicle market. The company's success can be attributed to its strong distribution network, brand recognition, and focus on offering CNG variants across its popular models. Hyundai Motor also holds a significant position in the CNG and LPG vehicle market. Hyundai's competitive advantage lies in its technological innovations, efficient manufacturing processes, and a diverse product portfolio that caters to various consumer segments. Tata Motors is another key competitor in the CNG and LPG vehicle market. Tata Motors leverages its strong presence in the commercial vehicle segment and its focus on offering affordable and fuel-efficient vehicles.
Strategically, incumbents focus on factory-fitted offerings. Tata’s twin-cylinder SUVs and Maruti’s automatic CNG transmissions target usability gaps, while Nissan experiments with multi-fuel architectures to meet 2027 CAFE norms. Composite-cylinder suppliers form tight partnerships with automakers to secure long-term off-take, creating an ecosystem advantage difficult for late entrants to replicate.
Regional specialists exploit localized economics. In Africa, conversion workshops bundling financing gain share; in North America, RNG supply contracts act as loyalty anchors for logistics fleets. Across markets, tightening safety rules favor brands with validated engineering and test infrastructure, reinforcing consolidation pressure in the CNG and LPG vehicle market.
CNG and LPG Vehicle Industry Leaders
-
Maruti Suzuki India Ltd
-
Hyundai Motor Company
-
Tata Motors Limited
-
SAIC Motor Corporation
-
Honda Motor Co., Ltd.
- *Disclaimer: Major Players sorted in no particular order

Market Opportunities and Future Outlook
Opportunity is expanding where policy actions reduce end-user economics frictions and where station access moves from corridor pilots to dense urban coverage. India is a visible proof point: in FY2026, CNG-powered passenger vehicles accounted for about 10.34 lakh units (around 22% of total passenger vehicle sales), overtaking diesel share (18.08%), which points to adoption when OEM-fitted portfolios and refueling coverage align. Parallel regulatory moves, such as PNGRB implementing a unified transportation tariff of Rs. 54.00/MMBTU for CNG and domestic PNG consumers (January 2026), also create a clearer pricing framework for city gas distributors and fleet buyers weighing multi-city operations.
White-space is evident in three areas. First, renewable gas integration into transport is growing alongside blending obligations and corporate decarbonization needs, which supports bundled offerings that connect biomethane production, CNG dispensing, and fleet offtake contracts. Second, factory-fitted model breadth in high-volume segments, from hatchbacks to compact SUVs and light commercial duty cycles, remains a lever as OEMs standardize components and address packaging concerns through twin-cylinder layouts. Third, the service and retrofit ecosystem stays a gating factor in many regions; scaling technician training, standardizing calibration procedures, and strengthening inspection protocols can unlock safer conversions and improve insurer and fleet acceptance, especially in fast-growing emerging markets where infrastructure and workshop quality develop unevenly.
Recent Industry Developments
- June 2026: Tata Motors detailed a multi-year passenger vehicle strategy that includes scaling capacity to about 1.3 million units annually over the next 2-3 years using flexible manufacturing that can shift between powertrains, including CNG. The plan supports higher availability of factory-fitted gaseous-fuel variants and reduces supply constraints during demand spikes, especially in cost-sensitive segments where CNG is chosen for total cost of ownership.
- December 2024: Clean Energy Fuels signed renewable natural gas supply deals with DHL (100,000 gallons annually), Food Express (3 million gallons over 10 years), and LA Metro (14 million gallons). These multi-year fleet commitments strengthen RNG-linked demand visibility for natural-gas vehicles and reinforce depot and corridor station utilization economics.
- June 2024: Tata Motors confirmed the FY2025 launch plan for the Nexon CNG, positioned as a turbo-CNG SUV using a 1.2-liter engine and twin-cylinder packaging. Adding a high-volume SUV nameplate to factory-fitted CNG expands addressable demand beyond entry hatchbacks by reducing the traditional boot-space trade-off and bringing feature parity into mainstream segments.


Research Methodology Framework and Report Scope
Market Definition and Coverage
For this study, the market covers the value of vehicles that run on compressed natural gas (CNG) or liquefied petroleum gas (LPG), including factory-fit and conversion fitments. Values are counted at the point of vehicle sale or conversion transaction.
Scope exclusions: pure battery-electric vehicles, hydrogen fuel-cell vehicles, and conventional gasoline or diesel vehicles without CNG or LPG capability are not counted.
Segmentation Overview
-
By Fuel Type
- Compressed Natural Gas (CNG)
- Liquefied Petroleum Gas (LPG)
- Compressed Bio-Gas (CBG)
-
By Vehicle Type
- Passenger Cars
- Light Commercial Vehicles
- Buses and Coaches
- Trucks (Medium and Heavy-Duty)
- Two and Three-Wheelers
-
By Sales Channel
- OEM-fitted
- Retrofitted / After-market
-
By End-use Application
- Private / Personal Use
- Taxi and Ride-hailing Fleets
- Public Transit Authorities
- Industrial and Utility Fleets
-
By Cylinder Type
- Type I (All-metal)
- Type II (Metal hoop-wrapped)
- Type III (Full composite)
- Type IV (Polymer-liner composite)
-
By Geography
-
North America
- United States
- Canada
- Rest of North America
-
South America
- Brazil
- Argentina
- Colombia
- Rest of South America
-
Europe
- Germany
- United Kingdom
- France
- Italy
- Spain
- Russia
- Rest of Europe
-
Asia-Pacific
- China
- India
- Japan
- South Korea
- Indonesia
- Thailand
- Rest of Asia-Pacific
-
Middle East and Africa
- Turkey
- Saudi Arabia
- United Arab Emirates
- Qatar
- South Africa
- Nigeria
- Egypt
- Kenya
- Rest of Middle East and Africa
-
North America
Data Sources, Market Sizing, and Validation
Desk Research
Desk research was used to build the starting structure for the model and to keep geography-level assumptions realistic. We relied on public data series that can signal gas-vehicle adoption and feasibility, such as vehicle registrations, natural gas supply and pricing indicators, and transport emissions rules. Sources used for this included, for example, IEA fuel and energy statistics, World Bank macro indicators, UNECE vehicle regulation references, and national transport and road ministry publications in key markets.
To translate activity into market value, we also reviewed OEM and conversion ecosystem signals from sources such as company annual reports, investor presentations, and customs and trade statistics for cylinders and conversion kits where relevant. We also used reputable press coverage of fueling network rollouts to cross-check expansion timelines. Select paid subscriptions for company financials and news were used mainly to cross-check revenue exposure and expansion announcements. The sources listed here are illustrative only, and many other public and internal references were used for data collection, validation, and clarification.
Primary Interviews and Surveys
Primary interviews and short surveys helped confirm what portion of demand comes from OEM-fit versus retrofit, and how pricing typically changes by vehicle class and country. Respondents covered vehicle distribution, fleet operators, conversion and cylinder ecosystem participants, and policy or standards-linked experts, so assumptions could be checked market by market before totals were finalized.
Distribution of primary research fieldwork respondents
| Company type | Respondent position | Region |
|---|---|---|
| Top tier: 36% | CXOs: 17% | APAC: 39% |
| Mid tier: 47% | Functional/Unit leaders: 30% | EMEA: 36% |
| Smaller Players: 17% | Managers: 53% | Americas: 25% |
Market-Sizing & Forecasting
Sizing starts from a top-down build where the vehicle parc and annual additions are reconstructed by region, then filtered by the penetration of CNG and LPG powertrains (including conversions) that are feasible under local fuel availability and regulation. After setting the demand pool, value is derived using average transaction values that reflect a mix of OEM-fit price premiums and retrofit conversion pricing, then rolled up to the global total.
To keep totals grounded, we corroborated the results with selective bottom-up approximations, such as sampling conversion pricing by country, checking cylinder and kit shipment signals where visible, and doing reasonableness checks using fleet economics for high-mileage use cases. Inputs that mattered most in this market included annual vehicle sales and registrations, fueling station rollout pace, relative pump-price spreads versus gasoline and diesel, retrofit payback expectations, and the mix shift between passenger cars and commercial fleets. Where a country had limited visibility on conversions, gaps were handled by using adoption proxies from similar regulatory and fuel-price contexts, followed by expert review to avoid overfitting.
For forecasting, scenario analysis was used so the model could reflect different policy and infrastructure paths without forcing one aggressive curve. The scenarios were driven by variables like planned refueling corridor additions, expected gas price trends, tightening emissions rules, and OEM model availability, and then aligned with what interviewees described as realistic adoption timelines.
Data Validation & Update Cycle
Validation is done in layers so unusual outputs get caught early. We compare modeled values against independent signals like reported alternative-fuel vehicle penetration, conversion activity commentary, and regional fueling build-out announcements, then investigate large variances before sign-off. If a key input changes sharply, such as a fuel-price shock or a policy shift, assumptions are re-checked and impacted geographies are revisited through follow-up calls.
Each report is refreshed on an annual cycle, and material events can trigger interim updates to pricing, adoption, and currency assumptions. Before delivery, a final analyst pass is completed so clients receive a view that reflects the latest available public data and field feedback.
Mordor Intelligence's Cng Lpg Vehicle Market Size Versus Other Published Estimates
Published market sizes for CNG and LPG vehicles can look far apart because each publisher chooses its own year timing, pricing basis, and what exactly counts as a vehicle transaction. Differences also come from how retrofit activity is treated, how mixed fuel (dual-fuel) vehicles are classified, and whether values are expressed using spot FX or a period-average conversion.
When the model is refreshed, exchange rates are aligned to the same pricing period and average selling price logic is rechecked against current OEM premiums and typical conversion ticket sizes. This is why Mordor Intelligence lands at a different level than estimates that keep older ASPs or use a different currency timing for the same year.
Benchmark comparison
| Source | Market Size | Gaps in Research Methodology |
|---|---|---|
| Mordor Intelligence | USD 7.71 B (2026) | |
| Industry Publisher A | USD 14.09 B (2025) | Uses a different base year and tends to emphasize factory-fit vehicle value, which can raise the average selling price when retrofit-heavy markets are not weighted the same way. |
| Industry Publisher B | USD 6.23 B (2026) | Applies a narrower value capture and slower pricing progression, which can understate the combined effect of OEM premiums plus conversion pricing in markets with active retrofit demand. |
The spread across the table is largely explained by timing and what is priced into the vehicle value, especially around retrofit inclusion and ASP assumptions. By keeping inputs tied to observable adoption signals and rechecking price and FX alignment during updates, we provide a number that can be traced back to clear steps and repeated for future refreshes.


Key Questions Answered in the Report
What is the current size of the CNG vehicle market?
The CNG vehicle market stands at USD 7.71 billion in 2026 and is projected to reach USD 10.7 billion by 2031.
Which region leads the global CNG vehicle market?
Asia-Pacific leads with a 45.60% share in 2025, propelled by India and China’s policy support and infrastructure growth.
Which vehicle segment is growing fastest?
Two- and three-wheelers post the quickest expansion at a 10.55% CAGR to 2031, buoyed by emerging-market demand and OEM launches.
How will bio-CNG influence market growth?
Bio-CNG is set to grow at 12.42% annually, outpacing fossil-gas variants as governments reward renewable fuels and fleets chase lower carbon intensity.
Why are composite cylinders gaining traction?
Type IV composite tanks cut weight and save space, supporting fuel efficiency and payload; they are forecast to grow at 15.96% CAGR through 2031.
What restrains faster adoption of CNG vehicles?
Key hurdles include limited crash-test protocols, LNG price volatility, and competition from EV subsidies in urban areas.
Page last updated on:


 Your data is secure and never sold or shared.


