
Cloud Workload Protection Market Size and Share
Market Overview
| Study Period | 2020 - 2031 |
|---|---|
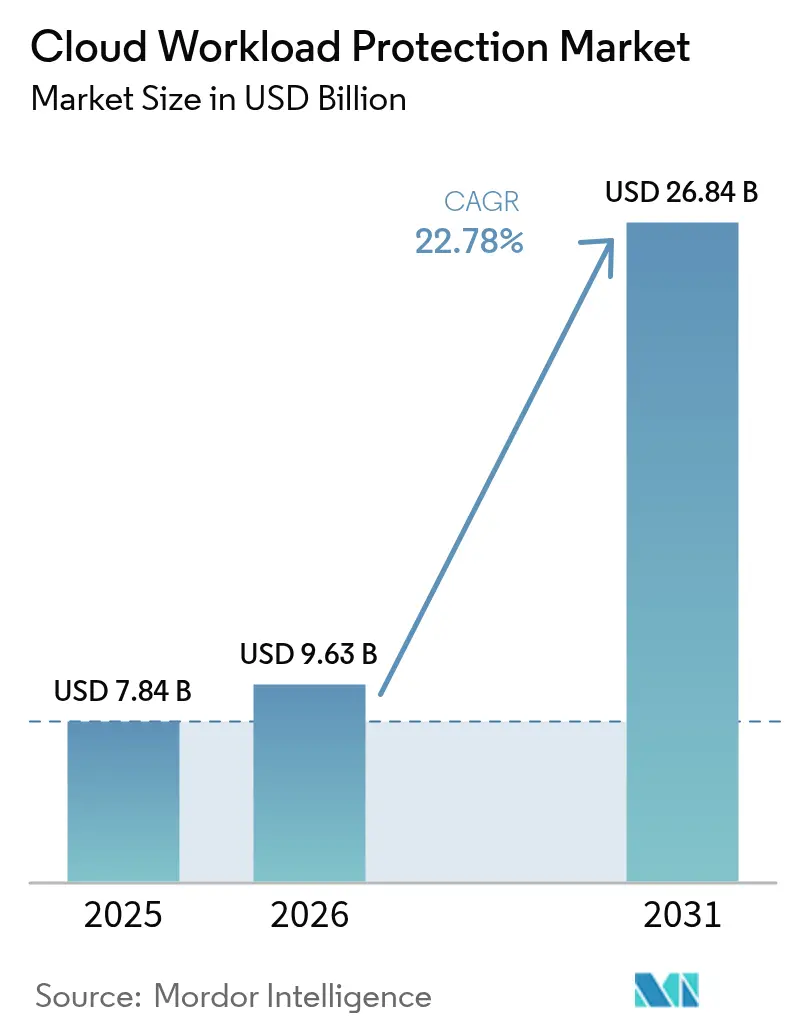
| Market Size (2026) | USD 9.63 Billion |
| Market Size (2031) | USD 26.84 Billion |
| Growth Rate (2026 - 2031) | 22.78 % |
| Fastest Growing Market | Asia Pacific |
| Largest Market | North America |
| Market Concentration | Medium |
Major Players *Disclaimer: Major Players sorted in no particular order Image © Mordor Intelligence. Reuse requires attribution under CC BY 4.0. | |
Cloud Workload Protection Market Analysis by Mordor Intelligence
The Cloud Workload Protection market size is expected to grow from USD 7.84 billion in 2025 to USD 9.63 billion in 2026 and is forecast to reach USD 26.84 billion by 2031 at 22.78% CAGR over 2026-2031. Demand accelerates as enterprises replace perimeter-centric defenses with runtime controls that secure highly distributed workloads. Real-time telemetry from extended Berkeley Packet Filter (eBPF) technology, the rapid roll-out of cloud-native application protection platforms (CNAPP), and convergence with DevSecOps pipelines reshape competitive playbooks. Multi-cloud adoption, hybrid deployment flexibility, and compliance-driven purchasing in regulated verticals sustain double-digit expansion while kernel-level observability raises performance expectations. The cloud workload protection market now favors unified platforms that reduce tool sprawl, simplify agent management, and extend protection to containers, serverless functions, and AI workloads.
Key Report Takeaways
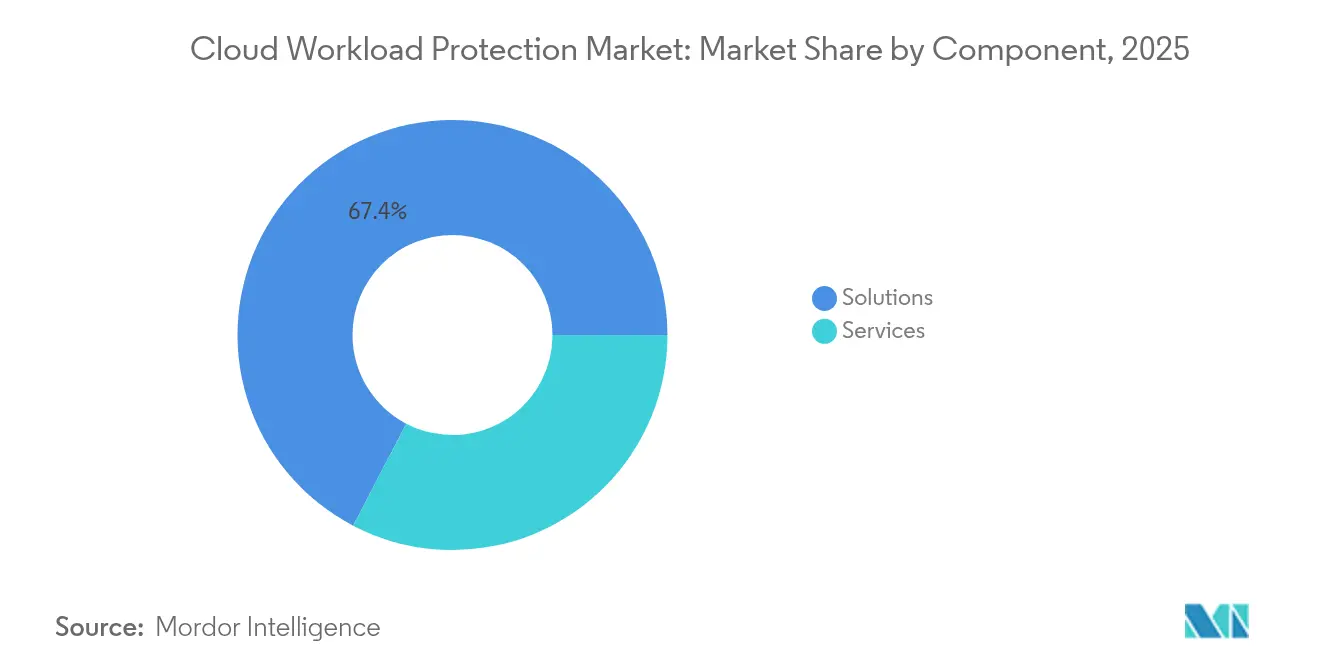
- By component, solutions held 67.35% of the cloud workload protection market share in 2025; threat detection and incident response is forecast to grow at 27.29% CAGR through 2031.
- By security architecture, agent-based deployments captured 63.25% of the cloud workload protection market share in 2025, while agentless models are expanding at 31.15% CAGR to 2031.
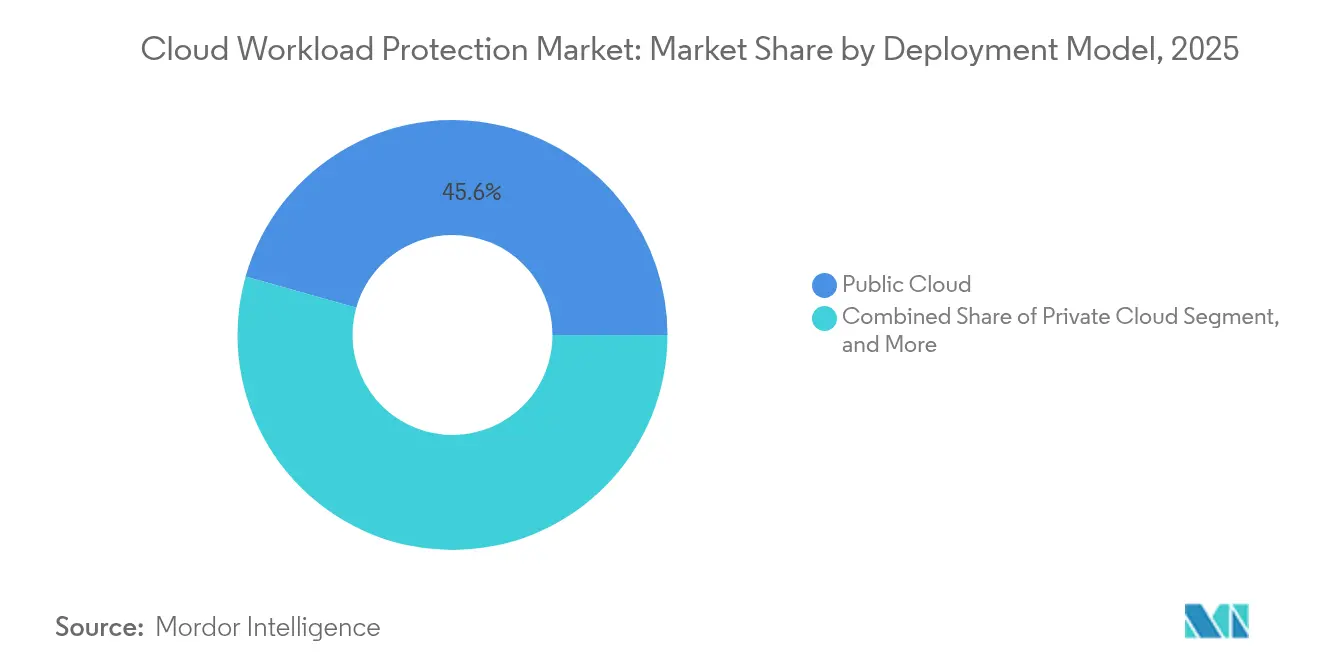
- By deployment model, public cloud commanded 45.62% of the cloud workload protection market share in 2025; hybrid cloud is projected to expand at 29.2% CAGR between 2026-2031.
- By workload type, virtual machines retained 40.55% of the cloud workload protection market share in 2025, whereas serverless functions are advancing at 33.2% CAGR through 2031.
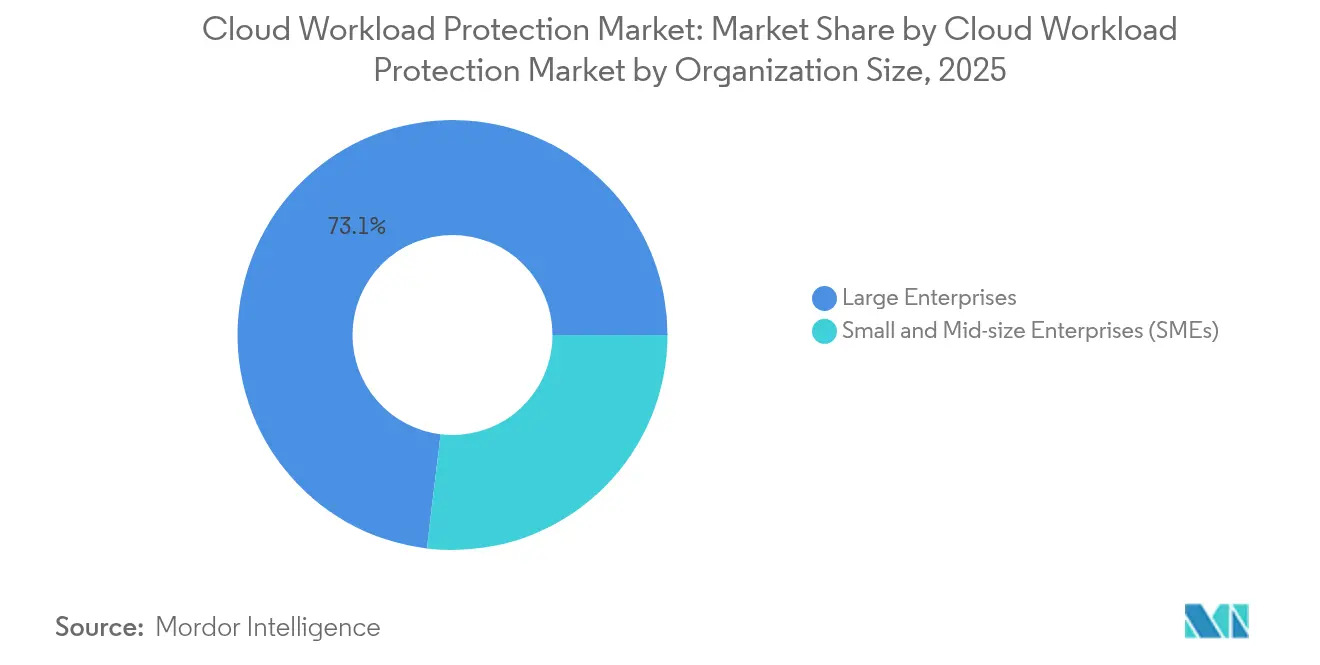
- By organization size, large enterprises led with 73.10% of the cloud workload protection market share in 2025; small and medium enterprises are growing at 25.9% CAGR.
- By end-user vertical, banking, financial services, and insurance (BFSI) accounted for 22.60% of the cloud workload protection market share in 2025, while healthcare and life sciences are poised to rise at 27.1% CAGR.
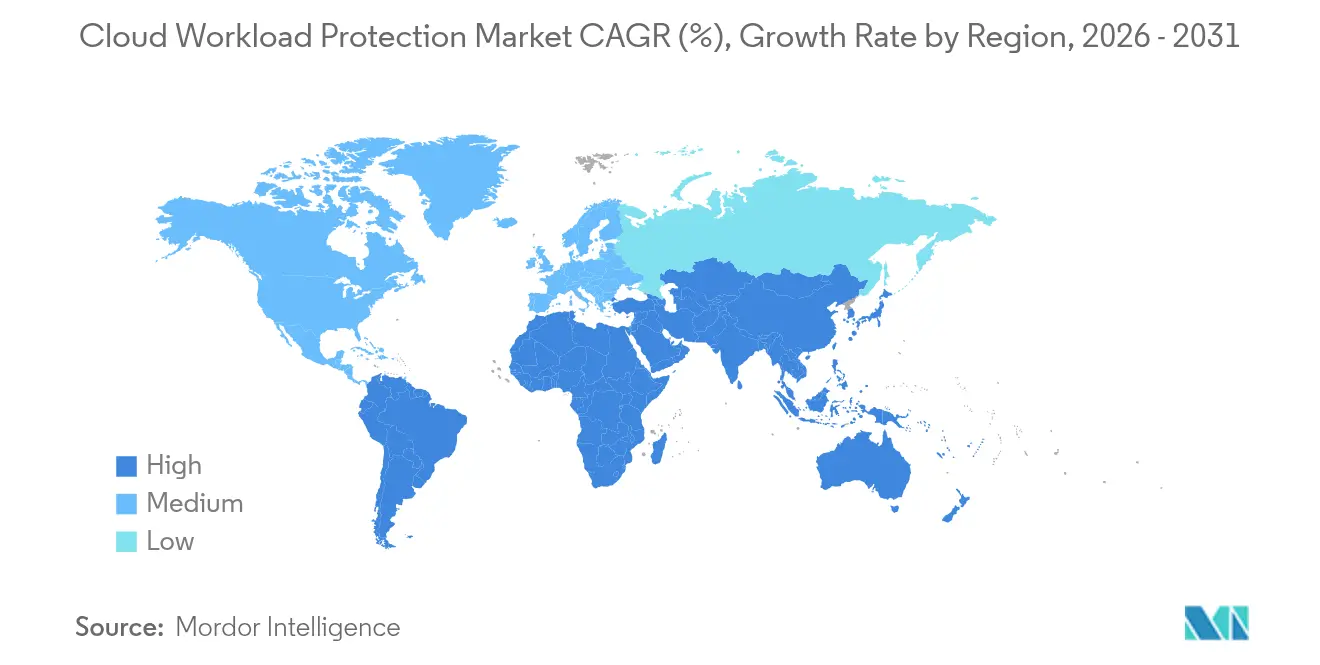
- By geography, North America held 37.70% of the cloud workload protection market share in 2025; Asia-Pacific is the fastest-growing region at 28.9% CAGR.
Note: Market size and forecast figures in this report are generated using Mordor Intelligence’s proprietary estimation framework, updated with the latest available data and insights as of 2026.
Market Trends and Insights
Drivers Impact Analysis of Cloud Workload Protection Market*
| Driver | (~) % Impact on CAGR Forecast | Geographic Relevance | Impact Timeline |
|---|---|---|---|
| Mainstream multi-cloud adoption surge | +2.6% | Global, strongest in North America and Western Europe | Medium term (2-4 years) |
| Mainstream DevSecOps shift accelerating CNAPP roll-outs | +2.2% | Global DevSecOps hubs; US, UK, Israel, India | Short term (≤2 years) |
| Rising cloud-native ransomware & compliance fines | +2.0% | Global regulated industries (BFSI, healthcare, govt.) | Long term (≥4 years) |
| Operational-cost advantage vs. on-prem tooling | +1.4% | Global, especially SMB-heavy markets in APAC & LATAM | Medium term (2-4 years) |
| eBPF-powered deep telemetry unlocks runtime trust | +0.8% | North America and EU innovation clusters | Short term (≤2 years) |
| Cloud insurance underwriters mandating CWPP proof | +1.1% | North America, EU, Australia | Medium term (2-4 years) |
| Source: Mordor Intelligence | |||
Multi-cloud Adoption Surge
Enterprise strategies that distribute workloads across several hyperscalers reshape security architectures and elevate demand for agentless visibility. The Department of Defense Cloud Security Playbook advocates a unified security posture across heterogeneous environments, reinforcing platform-centric buying preferences.[1] Financial institutions value multi-cloud for compliance across jurisdictions, ensuring operational resilience while avoiding vendor lock-in. CNAPP suites gain traction because they consolidate posture management, runtime protection, and incident response inside a single control plane. Vendor roadmaps increasingly emphasize API-based discovery that eliminates the administrative burden of deploying and updating agents across thousands of ephemeral assets.
DevSecOps Shift Accelerating CNAPP Roll-outs
Embedding security controls within continuous integration and deployment pipelines accelerates detection of vulnerabilities before workloads reach production. Microsoft’s guidance on cloud-native application protection illustrates how automated checks inside build processes shorten remediation cycles and align developers with security objectives.[2] The approach boosts release velocity while sustaining governance requirements. Container orchestration platforms such as Kubernetes bring runtime complexity that traditional endpoint agents cannot easily monitor, spurring adoption of integrated scan-to-protect workflows. As DevSecOps culture matures, procurement pivots toward solutions that expose developer-friendly APIs, policy-as-code templates, and actionable feedback loops inside integrated development environments.
Rising Cloud-Native Ransomware and Compliance Fines
Threat actors exploit misconfigurations in containers and serverless functions, elevating operational risk for regulated industries. The European Data Protection Board notes mounting enforcement actions for cloud data mishandling, signaling that fines now outweigh the cost of preventive controls.[3] Runtime defenses capable of detecting lateral movement inside Kubernetes clusters become mandatory for financial and healthcare organizations. Zero-trust principles gain urgency because network perimeters do not protect workloads communicating across multiple clouds and regions. Vendors respond by integrating behavioral analytics, network micro-segmentation, and data-aware encryption into a single policy framework.
eBPF-Powered Deep-Telemetry Unlocks Runtime Trust
Extended Berkeley Packet Filter instrumentation offers kernel-level visibility without the performance overhead of legacy drivers. AccuKnox demonstrates how eBPF converts user-defined policies into bytecode that enforces process, file, and network controls in real time. The technique delivers granular telemetry for containers and virtual machines, supports policy-as-code workflows, and scales across multi-OS fleets. Adoption accelerates in Asia-Pacific where Linux dominance and open-source communities drive innovation, with subsequent uptake in North America and Europe as organizations seek deterministic runtime integrity and reduced agent footprint.
Restraints Impact Analysis of Cloud Workload Protection Market*
| Restraint | (~) % Impact on CAGR Forecast | Geographic Relevance | Impact Timeline |
|---|---|---|---|
| Complex multi-regime data-residency mandates | -1.6% | EU, Middle East, APAC (India, Singapore), LATAM | Long term (≥4 years) |
| Tool sprawl & agent fatigue among SecOps teams | -1.3% | Global cloud-first enterprises | Short term (≤2 years) |
| Shortage of cloud-security skillsets | -1.5% | Global, especially emerging markets | Medium term (2-4 years) |
| Rising ARM-based server adoption breaking legacy agents | -0.9% | APAC hyperscalers, EU cloud sovereign initiatives | Medium term (2-4 years) |
| Source: Mordor Intelligence | |||
Complex Multi-regime Data-Residency Mandates
Divergent data-sovereignty rules force enterprises to maintain region-specific cloud instances and limit telemetry transfer, complicating unified threat detection. Impossible Cloud highlights how localization laws prompt fragmented security architectures and inflate operating costs. Financial firms must comply with GDPR, Basel III, and national banking statutes, requiring providers to offer in-country log processing, encryption key ownership, and locally certified data centers. Vendors allocate significant R&D resources to achieve compliance accreditations, which can slow feature innovation and increase barriers to entry for emerging players.
Tool Sprawl and Agent Fatigue Among SecOps Teams
Security operations centers deploy multiple point products that exhaust analysts with redundant alerts and overlapping dashboards. Academic research identifies alert fatigue as a root cause of burnout and missed incidents. Hybrid and multi-cloud estates compound the problem because distinct agents often lack parity on ARM-based servers or serverless runtimes. Enterprises therefore consolidate around platforms that merge posture management, runtime controls, and incident response, trimming license spend and administrative overhead. Vendor differentiation increasingly hinges on unified policy engines, normalized telemetry, and AI-assisted triage that shortens mean-time-to-detect.
*Our forecasts treat driver/restraint impacts as directional, not additive. The impact forecasts reflect baseline growth, mix effects, and variable interactions.
Cloud Workload Protection Market Segment Analysis
By Component:
Solutions Dominate Through IntegrationSolutions generated a 67.35% revenue contribution in 2025, reflecting the market’s preference for converged platforms that stretch from posture management to incident response. The cloud workload protection market size for solution offerings is poised to climb alongside a 27.29% CAGR in threat detection and response tooling as runtime analytics become table stakes. Comprehensive suites bundle vulnerability assessment, compliance reporting, and encryption, which drives platform stickiness and reduces total cost of ownership.
Services delivered the remaining 32.65% revenue, led by managed detection capabilities that offset talent shortages. Professional services support architectural design and migration, while managed offerings appeal to small and medium enterprises seeking operational expertise without hiring full-time staff. Tight integration between technology and services ensures faster time-to-value and creates up-sell pathways for advisory engagements, sustaining recurring revenue growth across the cloud workload protection market.

By Security Architecture:
Agent-based Leads Despite Agentless SurgeAgent-based deployments accounted for 63.25% of the cloud workload protection market share in 2025 because kernel-resident modules provide deep packet visibility and process control. They remain indispensable for high-frequency trading and other latency-sensitive workloads that demand deterministic monitoring. However, the agentless cohort is scaling at 31.15% CAGR as hyperscaler APIs mature and customers gravitate toward lighter operational footprints.
The cloud workload protection market size attached to agentless models benefits from ARM server adoption and serverless expansion, both of which challenge legacy agents. Hybrid strategies that combine in-guest sensors for mission-critical assets with API telemetry for ephemeral workloads bridge capability gaps. Microsoft’s transition to Azure Monitor Agent exemplifies the industry’s pivot to consolidated collectors that minimize CPU overhead while expanding data granularity
By Deployment Model:
Public Cloud Foundation Enables Hybrid GrowthPublic cloud accounted for 45.62% of revenue in 2025, underpinned by built-in controls from hyperscalers and an expansive ecosystem of third-party integrations. Hybrid architectures, forecast to grow at 29.2% CAGR, resonate with organizations balancing regulatory control with elasticity. Private cloud persists at 30.7% share for industries requiring sovereign hosting or proximity to on-premises assets.
Unified platforms that abstract policy enforcement from physical location underpin the cloud workload protection market, ensuring consistent guardrails across Kubernetes clusters in data centers and serverless functions at the edge. The Department of Defense zero-trust overlays underscore the strategic value of deployment agnosticism, steering procurement criteria toward vendors that operate across cloud footprints without security blind spots
By Cloud Workload Type:
Serverless Disrupts Virtual Machine DominanceVirtual machines retained 40.55% revenue share in 2025, yet the serverless segment is advancing at 33.2% CAGR as event-driven architectures compress infrastructure overhead. Containers are expanding at 30.35% and represent the connective tissue between legacy monoliths and microservices. The cloud workload protection market size linked to serverless highlights the urgency for runtime controls that trigger in milliseconds and respect provider-defined sandboxes.
Aqua Security’s AI-workload protection underscores the importance of visibility inside GPUs and specialized accelerators powering machine-learning inference. eBPF instrumentation further levels the playing field by collecting granular telemetry across container-optimized operating systems without intrusive code changes.
By Organization Size:
Enterprise Leadership Drives SME AdoptionLarge companies generated 73.10% of 2025 revenue because of sheer workload volume and regulatory obligations. Integrated suites that dovetail with security information and event management (SIEM) pipelines reinforce renewal rates. Small and medium enterprises are expanding at 25.9% CAGR as SaaS-delivered protection lowers entry thresholds.
Agentless discovery, simplified dashboards, and consumption-based pricing allow SMEs to adopt controls that once required specialist teams, expanding the total addressable cloud workload protection market. SentinelOne’s FedRAMP authorization illustrates how single-tenant SaaS models can simultaneously serve sovereign agencies and mid-market firms through role-based access controls and modular feature tiers
By End-User Vertical:
Healthcare Accelerates Beyond BFSI LeadershipBFSI maintained a 22.60% share in 2025 thanks to stringent audit mandates and high breach costs. Healthcare and life sciences will outpace other verticals with a 27.1% CAGR as ransomware targets patient data and connected medical devices. Telecommunications, energy, and government workloads also scale rapidly as 5G rollouts, smart-grid projects, and public-sector modernization push sensitive data into the cloud.
Vendors bundle compliance artefacts—such as HIPAA mappings and PCI DSS dashboards—directly into policy engines, shortening certification cycles. The cloud workload protection market size in regulated sectors grows alongside embedded frameworks, automated evidence collection, and AI-based anomaly detection that flags credential abuse inside critical systems.
Geography Analysis
North America Cloud Workload Protection Market
North America held 37.70% share in 2025, anchored by mature cloud penetration, strong venture funding, and regulatory drivers such as FedRAMP. High-profile authorizations fuel adoption across civilian agencies and defense programs, reinforcing vendor legitimacy. Canada and Mexico mirror these trends, adapting U.S. frameworks to local privacy statutes and extending market reach.
APAC Cloud Workload Protection Market
Asia-Pacific is advancing at 28.9% CAGR, powered by digital-first banking in India, manufacturing digitization in China, and public-sector cloud mandates in Australia and Japan. Akamai recorded a 73% rise in web attacks across the region, with financial services absorbing more than 27 billion malicious requests in 2024. This threat landscape fosters rapid uptake of runtime protection, particularly in Singapore and South Korea, where regulators expect zero-trust adherence.
Europe Cloud Workload Protection Market
Europe maintained 27.95% revenue share in 2025, and GDPR remains the principal compliance engine. The European Data Protection Board stresses cross-border data controls, compelling multinationals to deploy region-specific telemetry pipelines. Vendors compete on localized data centers, encryption key ownership, and adherence to emerging AI Acts that govern model explainability and data retention. Eastern European and Nordic markets contribute incremental growth as cloud adoption extends into manufacturing and energy sectors.
Regulatory Landscape
Regulated buyers increasingly tie cloud workload protection requirements to formal guidance from standards bodies and government assurance programs. In the United States, FedRAMP remains a central authorization pathway for cloud services used by federal agencies, while DoD cloud deployments align to DISA guidance, including the DoD Cloud Service Provider Security Requirements Guide (SRG) and related DFARS cloud requirements, which pushes vendors toward continuous monitoring, hardened configurations, and audit-ready telemetry across hybrid and multi-cloud estates.
During 2026, NIST publications tightened control expectations for cloud-native attack surfaces that directly touch CWPP and CNAPP capabilities. NIST updated guidance for API protection in cloud-native systems (March 2026) and published additional overlays and internal reports covering specialized environments, including high-performance and emerging workload patterns, reinforcing demand for runtime visibility, policy enforcement, and traceable configuration baselines that can be demonstrated during assessments. In Europe, NIS2 implementation guidance and technical risk-management measures, alongside cloud security best practices from ENISA, add pressure for standardized risk measures and evidence collection, shaping procurement criteria for posture-to-runtime coverage and localized processing where data-residency applies.
Value Chain Analysis
The cloud workload protection value chain begins with foundational cloud infrastructure and platforms, including hyperscalers and specialized compute providers, and extends to CWPP and CNAPP software vendors that deliver posture management, vulnerability assessment, and runtime detection and response across virtual machines, containers, and serverless workloads. Key upstream inputs include cloud control-plane APIs, identity and logging services, runtime telemetry (including eBPF-based signals on Linux-heavy fleets), threat intelligence, and increasingly SBOM and supply-chain metadata that connect build-time context to runtime risk decisions.
Distribution and deployment generally pass through cloud marketplaces, channel partners, and global system integrators that bundle implementation, migration, and managed detection services for security teams facing talent constraints. Partnerships between security vendors and infrastructure providers increasingly function as a value-chain mechanism for embedding protections closer to where workloads run, including AI cloud infrastructure. Compliance bodies and standards organizations, including NIST and European frameworks referenced in EU cybersecurity requirements, also influence product checklists, assessment artifacts, and region-specific hosting needs. Differentiation points often center on agent management at scale, parity across heterogeneous runtimes, including ARM and serverless, and the ability to keep telemetry and response workflows aligned with multi-regime data-residency and audit constraints.
Competitive Landscape
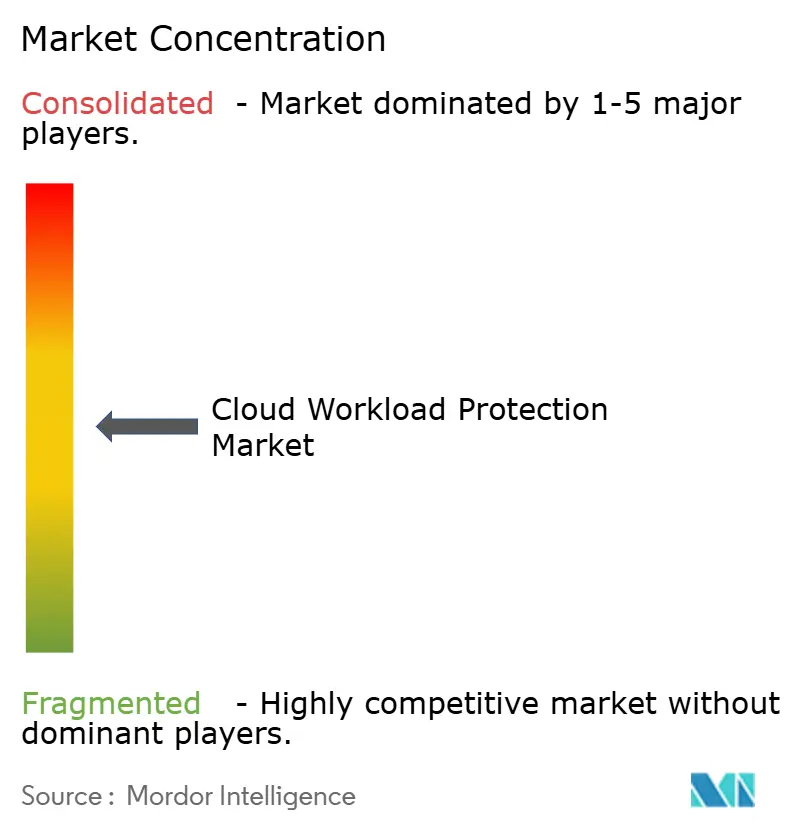
Market consolidation is moderate as established endpoint and network security vendors expand into workload protection through acquisitions and organic R&D. Cisco, Palo Alto Networks, and CrowdStrike integrate cloud security posture management, container runtime defenses, and threat intelligence feeds to offer full-stack visibility. Differentiation hinges on unified policy engines, eBPF-powered observability, and AI-assisted response.
Technology roadmaps emphasize agentless discovery for ease of deployment, supplemented by in-kernel guards where deterministic control is paramount. SEC filings from SentinelOne demonstrate growing cross-sell rates between XDR and CNAPP modules, validating the platform thesis. White-space opportunities remain in serverless, AI, and edge-computing workloads, prompting niche players to specialize in accelerated runtime inspection and data-aware micro-segmentation.
Partnerships also shape competition. Rubrik aligns with hyperscalers to integrate isolated recovery, while Accenture collaborates with CrowdStrike to modernize SIEM deployments. Such alliances strengthen solution stickiness, expand channel reach, and accelerate integration roadmaps, elevating switching costs for end-customers. Pricing models progressively favor consumption-based tiers that align spend with workload telemetry volume rather than static host counts.
Cloud Workload Protection Industry Leaders
-
Microsoft
-
Palo Alto Networks
-
CrowdStrike
-
Wiz
-
Trend Micro
- *Disclaimer: Major Players sorted in no particular order
Cloud Workload Protection Market Companies Covered in this Report
- Orca Security
- CrowdStrike (Falcon Cloud Security)
- Palo Alto Networks (Prisma Cloud)
- Microsoft (Defender for Cloud)
- Wiz, Inc.
- Trend Micro Inc.
- Check Point Software Tech.
- McAfee LLC
- Broadcom Inc. (Symantec)
- Sophos Group plc
- Upwind
- SentinelOne
- Cisco (Protect Cloud Workload)
- Guardicore (Rapid7)
- Wiz
- Aqua Security
- Tenable (Cloud Security)
- Qualys, Inc.
- Tripwire Inc.
- LogRhythm Inc.
- Snyk Ltd.
Market Opportunities and Future Outlook
AI and cloud-native modernization are creating an expansion lane for workload protection into model-facing and agentic application paths that sit outside traditional host-centric controls. In July 2026, AWS added Security Hub capabilities aimed at discovering and cataloging AI workloads and expanded cross-cloud monitoring coverage, while Palo Alto Networks brought Prisma AIRS AI Gateway to general availability to enforce security and data policies for AI interactions. Together, these moves support opportunities for CWPP vendors to extend runtime controls into AI inventory, inline policy enforcement, and incident response tied to AI-to-service traffic and model access patterns.
Compliance programs are also generating operational whitespace for audit-ready, continuously assessed runtime controls and regionalized telemetry pipelines. Tightening expectations around NIST API security guidance in 2026 and evolving European requirements linked to NIS2 and cloud risk-management measures increase demand for evidence collection, standardized configuration baselines, and cross-cloud incident workflows. Vendor activity in 2026, including new cloud workload protection modules from endpoint security players and cloud-risk prioritization innovations from established CNAPP providers, reflects a shift toward consolidated platforms designed to support both developer-led workflows, such as policy-as-code and CI/CD integration, and assessor-led needs, such as mapped controls, continuous monitoring, and exportable compliance artifacts.
Recent Industry Developments in Cloud Workload Protection Market
- June 2026: CrowdStrike announced expanded AI and cloud security operations on AWS, adding new integrations such as connectors for Amazon CloudWatch and Amazon S3. The update improves native telemetry ingestion and response workflows for cloud workloads, aligning CWPP use cases with cloud operations data sources used by SecOps teams.
- May 2026: Palo Alto Networks completed its acquisition of Portkey to strengthen AI Gateway capabilities within the Prisma AIRS portfolio. The deal supports convergence between workload protection, AI interaction controls, and policy enforcement that sits inline with cloud-native application traffic.
- February 2026: Microsoft and CrowdStrike announced that the Falcon platform became available on the Microsoft commercial marketplace. Marketplace availability supports procurement through cloud consumption commitments and simplifies deployment for organizations standardizing security controls across Azure-hosted workloads.
Cloud Workload Protection Market Report Scope and Research Methodology
Market Definition and Coverage
The cloud workload protection market in this methodology covers revenues earned from software platforms that protect cloud workloads such as virtual machines, containers, and serverless functions, across public, private, and hybrid cloud environments. We count platform revenues linked to security functions that operate at build and runtime.
Scope exclusions: We exclude hardware firewalls, secure web gateways, and stand-alone endpoint tools that do not monitor cloud workload runtime telemetry.
Segments Covered in This Report
- By Component
- Solutions
- Monitoring and Logging
- Policy and Compliance Management
- Vulnerability Assessment
- Threat Detection and Incident Response
- Encryption, Tokenisation and Key Management
- Services
- Managed Services
- Professional Services
- Solutions
- By Security Architecture
- Agent-based
- Agentless
- Hybrid
- By Deployment Model
- Public Cloud
- Private Cloud
- Hybrid Cloud
- By Cloud Workload Type
- Virtual Machines (VMs)
- Containers
- Serverless / FaaS
- By Organization Size
- Large Enterprises
- Small and Mid-size Enterprises (SMEs)
- By End-User Vertical
- BFSI
- Healthcare and Life Sciences
- IT and Telecommunications
- Retail and Consumer Goods
- Media and Entertainment
- Energy and Utilities
- Government and Defense
- Other End-User Vertical
- By Geography
- North America
- United States
- Canada
- Mexico
- South America
- Brazil
- Argentina
- Rest of South America
- Europe
- United Kingdom
- Germany
- France
- Russia
- Rest of Europe
- Asia-Pacific
- China
- Japan
- India
- Australia and New Zealand
- South Korea
- Rest of Asia-Pacific
- Middle East and Africa
- Middle East
- GCC (Saudi Arabia, UAE, Qatar, Kuwait, Bahrain, Oman)
- Turkey
- Rest of Middle East
- Africa
- South Africa
- Nigeria
- Kenya
- Rest of Africa
- Middle East
- North America
Data Sources, Market Sizing, and Validation
Desk Research
Desk research was used to set the market boundaries and to anchor the demand pool to observable cloud activity and security buying patterns. We referred to public sources such as NIST publications on cloud security concepts, CISA advisories and guidance, and ISO standards that influence control requirements and procurement language. For workload and cloud adoption signals, we also used sources such as the US Bureau of Economic Analysis for IT and software spend context, the World Bank for macro indicators that affect enterprise IT budgets, and peer-reviewed security journals to confirm common attack paths tied to container and runtime exposure.
To translate signals into dollars, we reviewed sources such as company filings, earnings call transcripts, investor presentations, and reputable press coverage that describe cloud security mix, product packaging, and pricing direction. Paid subscriptions for company financials and intelligence, patent databases, and news and financials were used selectively to cross-check revenue splits and product evolution, especially when platforms were marketed under broader cloud security suites. The desk research sources listed here are illustrative only, and additional public references were used for data collection, validation, and clarification during the study.
Primary Interviews and Surveys
Primary work focused on validating what buyers actually classify as workload protection versus adjacent cloud security tools, and on confirming typical pricing constructs across workload types. We spoke with a mix of security leaders, cloud platform owners, and delivery partners across major regions so assumptions on adoption timing, packaging, and renewal behavior could be checked and, where needed, adjusted before finalizing the model.
Distribution of primary research fieldwork respondents
| Company type | Respondent position | Region |
|---|---|---|
| Top tier: 34% | CXOs: 14% | APAC: 41% |
| Mid tier: 52% | Functional/Unit leaders: 33% | EMEA: 37% |
| Smaller Players: 14% | Managers: 53% | Americas: 22% |
Market-Sizing & Forecasting
Our sizing starts with a top-down build where the cloud security spend pool is reconstructed, then narrowed using workload protection adoption rates across VMs, containers, and serverless, followed by region-level cloud maturity adjustments. That total is corroborated with selective bottom-up checks, such as sampling typical annual subscription pricing by workload type and pairing it with an estimated protected workload count, which helps correct for overstatements in early-stage adoption markets.
Inputs used in the model include the share of applications running in containers, the pace of serverless usage in production, the frequency of compliance-led purchases (for example, controls tied to logging and vulnerability management), the typical platform pricing metric (per workload, per node, or per vCPU), and the degree of tool consolidation into unified platforms. Where direct volume indicators are missing, we handle gaps by using a range derived from interviews and by cross-checking with publicly discussed customer counts and product revenue commentary in filings, then keeping only values that remain consistent across regions and workload mixes.
For forecasting, we used scenario analysis because security spending and cloud migration timing can change quickly due to incidents, regulation, and budgeting cycles. The scenarios were built around variables like multi-cloud adoption, the mix shift from VM to container workloads, and expected price progression for bundled platform features, and then the final outlook was set after expert consensus checks.
Data Validation & Update Cycle
Validation is done through multiple passes, starting with sanity checks such as year-over-year growth consistency and region shares that align with cloud adoption signals. Outputs are compared against independent indicators, including disclosed cloud security revenue commentary, hiring trends for cloud security roles, and the cadence of major compliance changes that influence buying. When a variance falls outside an expected range, we recheck assumptions, revisit the desk references, and re-contact selected interviewees to confirm what changed.
Before publication, the model and write-up go through analyst review steps that look for double counting across adjacent categories and for unrealistic pricing or adoption jumps. Reports are refreshed annually, and interim updates are made when material events occur that can shift demand or pricing. Right before delivery, an analyst performs a final pass so the client receives the latest updated view.
Mordor Intelligence's Cloud Workload Protection Market Sizing Compared With Other Published Estimates
Published market sizes for cloud workload protection can look far apart because each publisher draws the line around a slightly different product set, then applies different assumptions on pricing and adoption speed. We also see gaps when one study uses a different starting year for its forecast, or when currency timing and regional coverage are treated differently.
Some external estimates fold in adjacent cloud security categories, and a few also add services like consulting, training, and managed security into the same total. In Mordor Intelligence, the count is limited to software platform revenues tied to protecting cloud workloads like VMs, containers, and serverless, and it excludes categories such as hardware firewalls and secure web gateways, plus tools that do not observe cloud workload runtime telemetry.
Benchmark comparison
| Source | Market Size | Gaps in Research Methodology |
|---|---|---|
| Mordor Intelligence | USD 7.84 B (2025) | |
| Trade Journal A | USD 9.00 B (2025) | Often groups workload protection with broader cloud security narratives and may include services such as consulting, integration, and managed offerings, which lifts the spend base beyond pure platform revenue. |
| Industry Report Publisher B | USD 6.80 B (2025) | Uses a narrower capture of capability areas and a longer-dated pricing curve, which can undercount newer runtime and container-focused modules that are increasingly bundled into modern platforms. |
The spread in the table mainly comes from what is counted as part of workload protection and how pricing and bundling are treated across workload types. By keeping inclusions tied to observable workload security platform revenues and then checking assumptions through interviews and consistency tests, the final estimate stays traceable to clear inputs that can be re-run as the market changes.
Key Questions Answered in the Report
What is the current size of the cloud workload protection market?
The market is valued at USD 9.63 billion in 2026.
How fast is the cloud workload protection market expected to grow?
It is projected to advance at a 22.78% CAGR, reaching USD 26.84 billion by 2031.
Which security architecture is gaining the most momentum?
Agentless cloud workload protection is expanding at a 31.15% CAGR as organizations seek lighter deployment footprints.
Which workload type is growing the fastest?
Serverless functions are rising at a 33.2% CAGR as enterprises adopt event-driven computing models.
Why is Asia-Pacific the fastest-growing region?
Digital-first transformation initiatives and stricter data-protection rules propel a 28.9% CAGR across APAC markets.