
Cloud Supply Chain Management Market Size and Share
Market Overview
| Study Period | 2020 - 2031 |
|---|---|
| Market Size (2026) | USD 13.98 Billion |
| Market Size (2031) | USD 30.56 Billion |
| Growth Rate (2026 - 2031) | 16.95 % |
| Fastest Growing Market | Asia Pacific |
| Largest Market | North America |
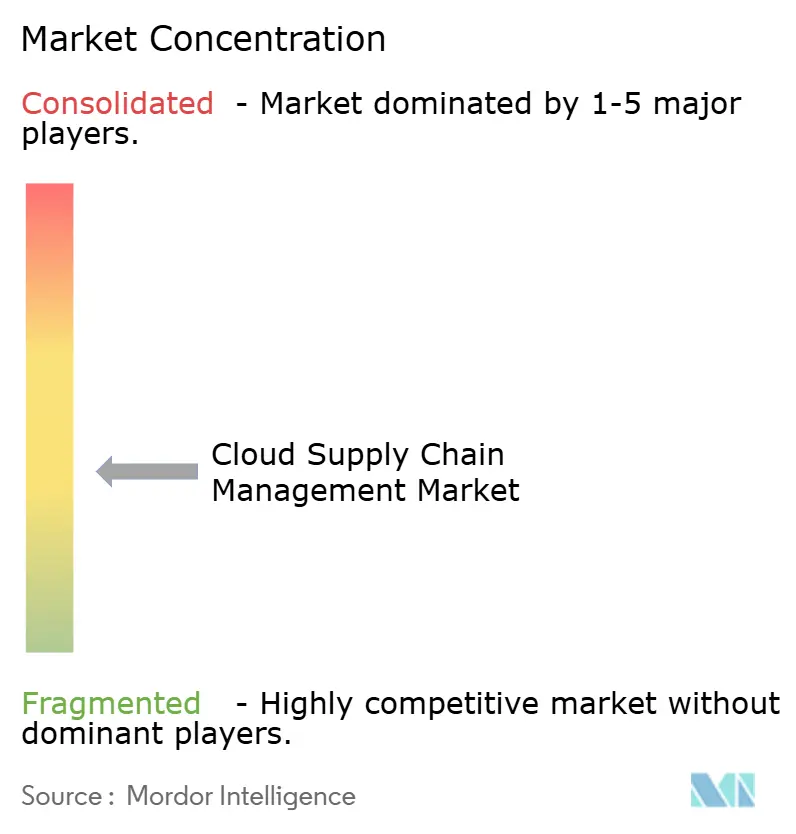
| Market Concentration | Medium |
Major Players *Disclaimer: Major Players sorted in no particular order Image © Mordor Intelligence. Reuse requires attribution under CC BY 4.0. | |
Cloud Supply Chain Management Market Analysis by Mordor Intelligence
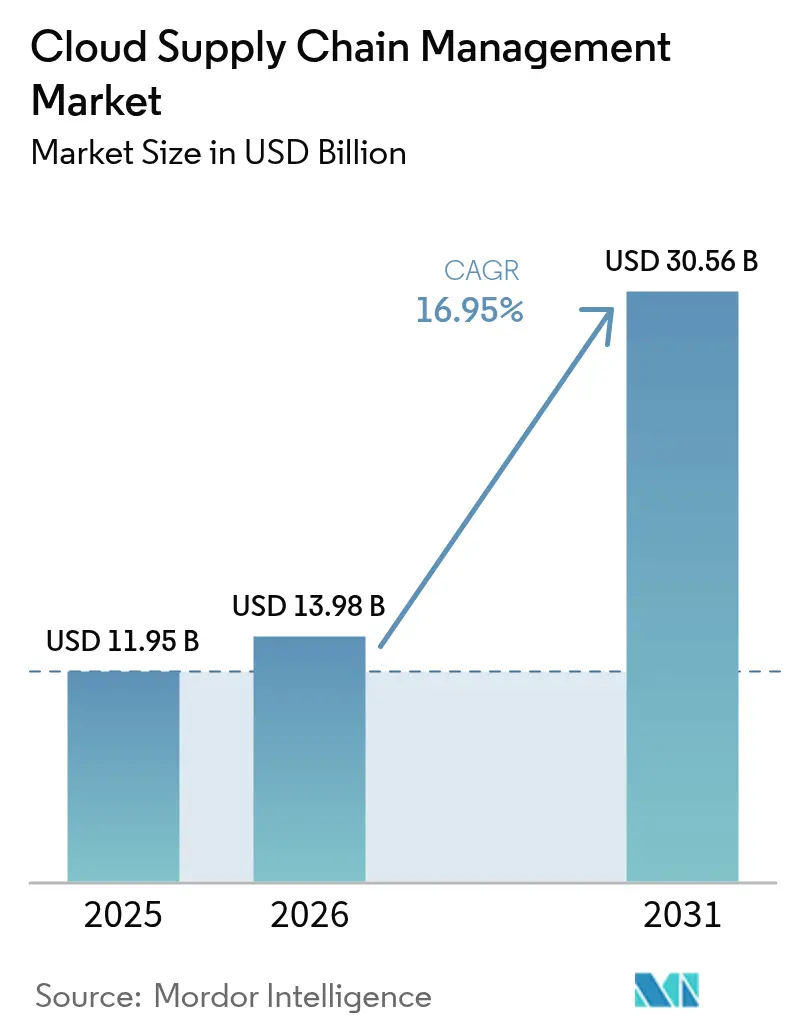
The cloud supply chain management market size is expected to grow from USD 11.95 billion in 2025 to USD 13.98 billion in 2026 and is forecast to reach USD 30.56 billion by 2031 at 16.95% CAGR over 2026-2031. Rapid migration from capital-intensive on-premise suites to consumption-based SaaS platforms, coupled with the demand for real-time visibility, is the primary catalyst. Large enterprises continue to drive core spending, yet small and medium enterprises are accelerating adoption as subscription pricing removes upfront license barriers. Transportation and logistics users prioritize end-to-end freight tracking, while digital twin planning and carbon-accounting modules are unlocking new use cases. Competitive intensity remains moderate, as no single vendor holds more than a 15% market share in cloud supply chain management, creating opportunities for niche specialists.
Key Report Takeaways
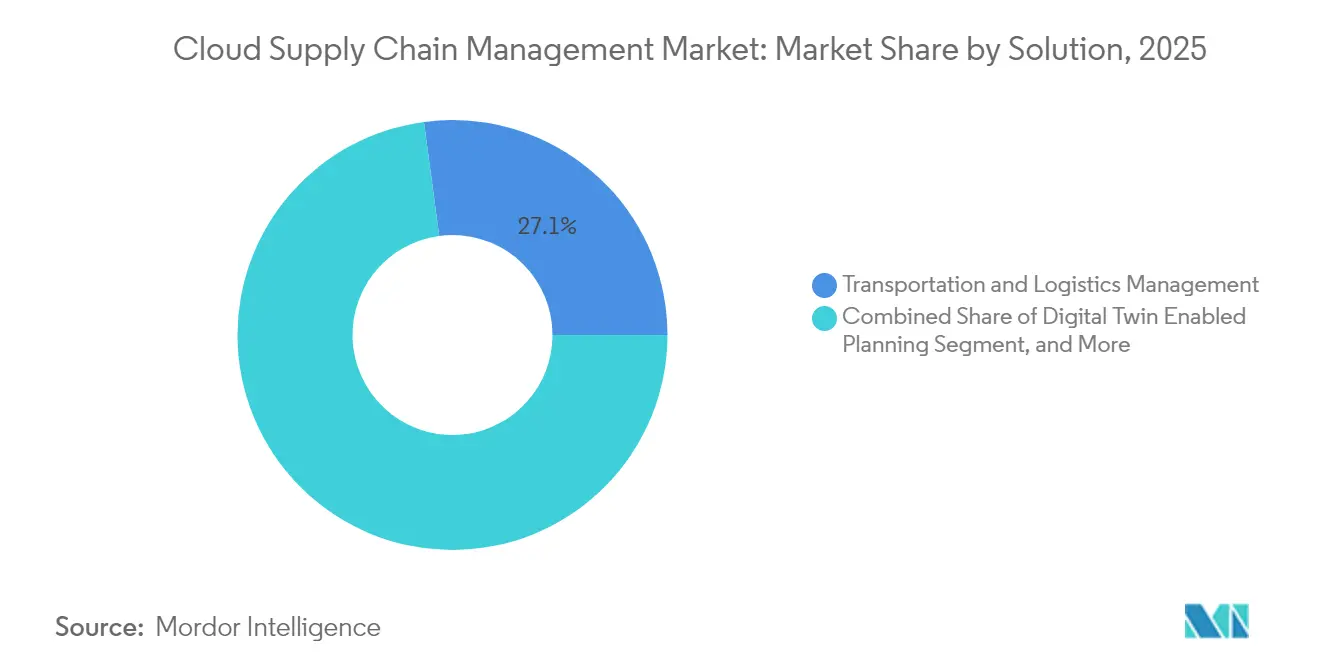
- By solution, Transportation and Logistics Management led with a 27.12% cloud supply chain management market share in 2025, while Digital Twin Enabled Planning is forecast to grow at 21.25% CAGR to 2031.
- By deployment type, Public Cloud captured 60.58% of the revenue in 2025; Hybrid Cloud is expected to expand at a 19.05% CAGR through 2031.
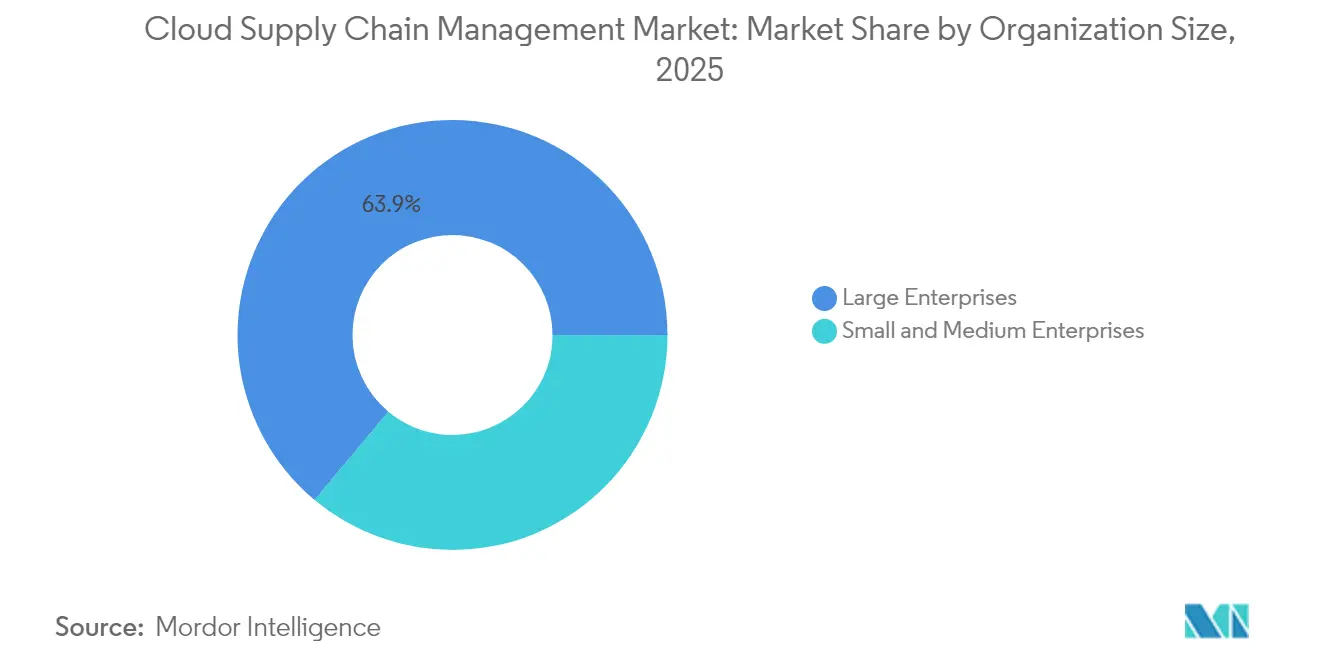
- By organization size, large enterprises held a 63.92% share in 2025, whereas Small and Medium Enterprises are advancing at a 19.60% CAGR to 2031.
- By end-user industry, the Retail Sector led with a 22.98% revenue share in 2025; the healthcare sector is projected to post a 21.60% CAGR from 2025 to 2031.
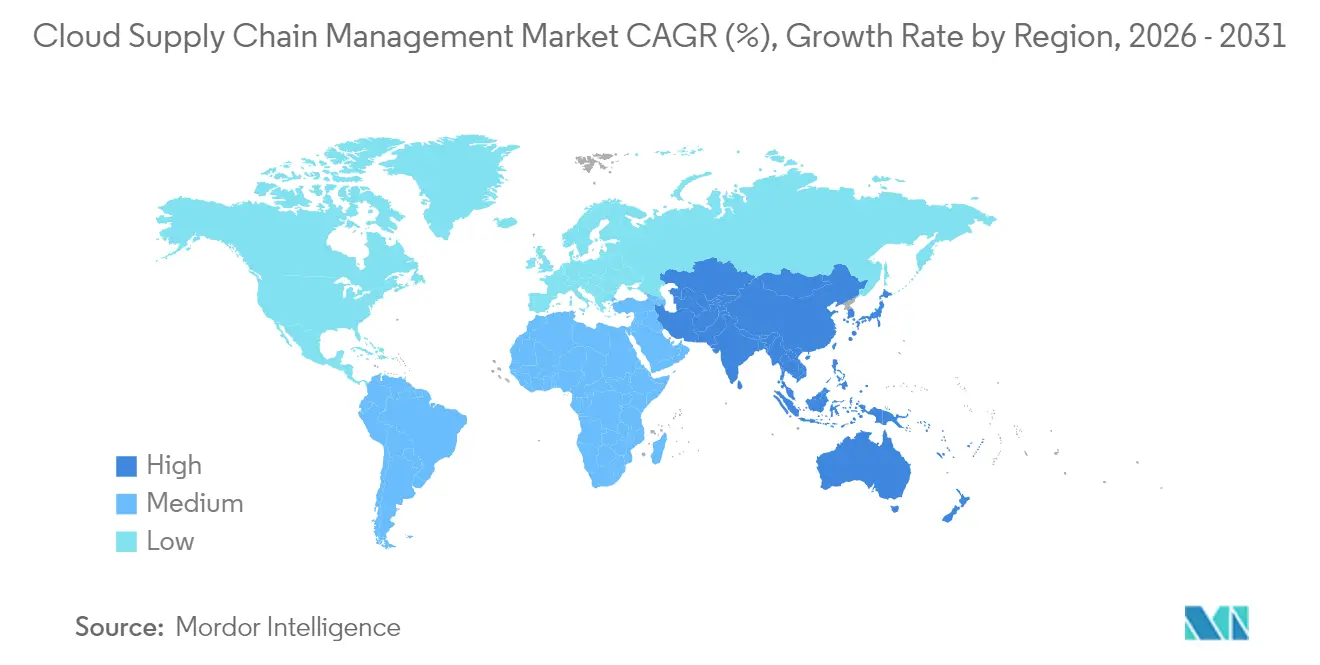
- By geography, North America accounted for 34.41% of 2025 revenue, and the Asia Pacific is anticipated to record an 18.05% CAGR through 2031.
Note: Market size and forecast figures in this report are generated using Mordor Intelligence’s proprietary estimation framework, updated with the latest available data and insights as of 2026.
Global Cloud Supply Chain Management Market Trends and Insights
Drivers Impact Analysis*
| Driver | (~) % Impact on CAGR Forecast | Geographic Relevance | Impact Timeline |
|---|---|---|---|
| Rapid Adoption of Cloud-Based Solutions for Demand Planning | +3.2% | Global, with a concentration in North America and Europe | Medium term (2-4 years) |
| Expansion of E Commerce Requiring Agile Supply Networks | +2.8% | Global, led by Asia Pacific and North America | Short term (≤ 2 years) |
| Cost Efficiency and Scalability Driving Migration from On-Premise SCM | +3.5% | Global, particularly strong in Small and Medium Enterprises across all regions | Medium term (2-4 years) |
| Integration of Digital Twins for Real-Time Supply Chain Simulation | +2.4% | North America and Europe core, expanding to the Asia Pacific manufacturing hubs | Long term (≥ 4 years) |
| Rising Carbon Accounting Mandates Promoting Cloud Visibility Platforms | +1.9% | Europe is primary, North America is secondary, and the Asia Pacific is emerging. | Medium term (2-4 years) |
| Vendor Transition to Composable Microservices: Accelerating Upgrades | +2.1% | Global, with early adoption in the technology and retail sectors | Long term (≥ 4 years) |
| Source: Mordor Intelligence | |||
Rapid Adoption of Cloud-Based Solutions for Demand Planning
Organizations replacing spreadsheets with cloud-native forecasting gain hourly demand-signal refreshes, fed by point-of-sale feeds, weather APIs, and social media sentiment. Generative AI now lets planners interrogate forecasts in natural language and simulate promotional lifts. Even minor accuracy gains cut safety stock by double-digit percentages, releasing working capital. Retail and consumer-goods leaders paved the way, but adoption is broadening as cloud data lakes support a secure, tenant-isolated model for machine learning and training.[1]
Expansion of E Commerce Requiring Agile Supply Networks
With e-commerce penetration expected to reach 21% of retail sales by 2024, brands must orchestrate distributed inventory to meet same-day commitments. Cloud supply chain management market platforms route orders to the closest node, minimizing split shipments. Pre-built connectors link fulfillment centers, parcel carriers, and customs brokers, automating landed-cost calculations and returns processing across dozens of jurisdictions. The capability is critical for cross-border sellers managing baskets under USD 50.
Cost Efficiency and Scalability Driving Migration from On-Premise SCM
On-premise suites command license fees that can exceed USD 5 million plus annual maintenance. Subscription pricing converts capex to opex at USD 100-500 per user per month, while seasonal compute bursts are handled elastically. Blue Yonder reported 78% of 2024 bookings were subscription-based, up from 52% in 2020.[2] SMEs, in particular, leverage shared-tenant economics to tap into functions once reserved for Fortune 500 companies.
Integration of Digital Twins for Real-Time Supply Chain Simulation
Digital twins mirror multi-echelon networks, ingesting live IoT sensor data, port congestion indices, and supplier transactions. Siemens modeled 12,000 suppliers and 300 distribution centers to stress-test semiconductor shortages in 2024.[3] The practice reduces expedited freight, maintains service levels, and prevents line stoppages in aerospace and automotive production. Cloud infrastructure supplies the compute cycles needed for hourly Monte Carlo runs that on-premise servers cannot match.
Restraints Impact Analysis*
| Restraint | (~) % Impact on CAGR Forecast | Geographic Relevance | Impact Timeline |
|---|---|---|---|
| Heightened Security and Data Privacy Concerns | -1.8% | Global, with acute sensitivity in Europe and the Asia Pacific | Short term (≤ 2 years) |
| Complex Legacy Systems Hindering Cloud Migration | -2.3% | North America and Europe, particularly in the manufacturing and oil and gas sectors | Medium term (2-4 years) |
| Shortage of Cloud Native Supply Chain Talent | -1.5% | Global, most severe in North America and Europe | Long term (≥ 4 years) |
| Increasing Sovereign Cloud Requirements: Fragmenting Deployments | -1.2% | Europe, China, the Middle East, with emerging requirements in India and Brazil | Medium term (2-4 years) |
| Source: Mordor Intelligence | |||
Heightened Security and Data Privacy Concerns
Multi-tenant architectures concentrate sensitive pricing, forecast, and shipment data. A 2024 breach at a logistics software provider exposed manifests for 40,000 customers, elevating scrutiny on encryption, access controls, and data-residency compliance. The European Union's GDPR and China’s Personal Information Protection Law complicate cross-border transfers, prompting some firms to opt for private regions or customer-managed keys. Added controls increase vendor costs and can slow the deployment of cloud supply chain management.[4]
Complex Legacy Systems Hindering Cloud Migration
Enterprises often run 8-12 bespoke supply chain applications lacking modern APIs. Cleansing master data, re-engineering workflows, and validating regulated processes extend project timelines and inflate budgets. A Deloitte survey found that 64% of migrations were missed by six months or more. Life-science and aerospace firms face additional validation requirements from regulators such as the U.S. FDA, which can double or triple total migration costs relative to annual subscription outlays.
*Our forecasts treat driver/restraint impacts as directional, not additive. The impact forecasts reflect baseline growth, mix effects, and variable interactions.
Segment Analysis
By Solution: Transportation Visibility Sustains Leadership
Transportation and Logistics Management contributed the largest slice of the cloud supply chain management market, holding 27.12% of the revenue in 2025. Shippers rely on real-time estimated arrival times, dynamic route optimization, and carrier performance dashboards to optimize their operations. Electronic logging device mandates in North America and tachograph rules in Europe feed telematics data that elevates predictive ETAs. Digital freight marketplaces interface through open APIs, letting planners benchmark rates across modes without manual tenders. Demand Planning and forecasting are on the rise as retailers integrate external variables, such as weather and social sentiment, to minimize excess stock. Inventory and Warehouse Management now embeds computer vision for cycle counting, reducing labor in high-velocity DCs. Product Lifecycle Management (PLM) modules have expanded into process industries, linking recipe revisions to compliance records. Sales and Operations Planning integrates finance links, allowing volume and revenue forecasts to be reconciled in a single cockpit. Procurement modules inject supplier risk scores that mix financial health, ESG ratings, and geopolitical exposure. Order Management engines orchestrate multichannel fulfillment using fill-rate, margin, and delivery-promise logic. Product Master Data Management increasingly leverages blockchain to build immutable provenance chains.
Digital Twin Enabled Planning, advancing at a 21.25% CAGR, is the fastest-growing solution subsegment. Pharmaceutical, semiconductor, and heavy-industrial firms construct network graphs that simulate disruptions across multi-tier bills of material. Planners can test alternate sourcing or buffer stock moves virtually before committing inventory. Graph databases spotlight single-point-of-failure suppliers, while cloud compute executes thousands of Monte Carlo scenarios hourly. The capability gained prominence after 2024 component shortages halted assembly lines worldwide, prompting firms to adopt scenario-driven operating models.

By Deployment Type: Public Cloud Dominates, Hybrid Accelerates
Public Cloud held 60.58% of the cloud supply chain management market in 2025. Organizations prize the vendor-managed infrastructure and speed of activation, avoiding 6-12 month on-premise projects. Regional data centers spread across more than 30 countries ensure data residency and sub-10 ms latency for operational workflows. Private Cloud persists among defense and energy firms, protecting classified diagrams or seismic data. These environments utilize hypervisor or OpenStack layers to simulate elastic scaling within corporate firewalls.
Hybrid Cloud, projected to grow 19.05% CAGR, balances governance and agility. Pharmaceutical companies store clinical trial protocols and patient data on private nodes validated under Good Clinical Practice, while offloading analytics workloads to public tenants during quarterly S&OP cycles. Offerings such as AWS Outposts and Azure Stack extend managed services on-premise, enabling consistent tooling. The model depends on event-stream integration to synchronize master data without stale reads. Certified controls under ISO 27001 and SOC 2 underpin audit readiness and influence deployment choices.
By Organization Size: SMEs Close the Gap
Large Enterprises represented 63.92% of the 2025 value as they harmonize global networks spanning thousands of suppliers. Automotive OEMs deploy multi-tier control towers, feeding component availability into production scheduling weeks ahead of freeze dates. Enterprise-grade SLAs with 99.9% uptime and outage compensation remain mandatory. Functional depth, such as hazardous-material routing or serialization for biologics, often dictates vendor shortlists.
Small and Medium Enterprises are forecast to expand at a rate of 19.60% annually, narrowing the functionality gap. Entry packages bundle best-practice workflows and pre-built ERP connectors, cutting consulting spend. API marketplaces let Shopify or WooCommerce merchants plug in route optimization and inventory sync without coding. Democratization means regional distributors can provide shipment visibility that matches that of large rivals. Community forums and self-service documentation address the scarcity of dedicated IT staff. For many SMEs, cloud supply chain management market adoption now coincides with the introduction of the first professional inventory system, rather than a replacement of legacy tools.
By End-User Industry: Retail Holds Lead, Healthcare Surges
Retail commanded a 22.98% share in 2025. Omnichannel fulfillment requires SKU-level visibility across stores, DCs, and supplier hubs to present accurate promise dates at checkout. Fashion players leverage allocation algorithms to minimize markdowns by throttling replenishment on slow-moving variants. Grocery chains utilize machine-learning-driven fresh food replenishment, tailored to spoilage curves, thereby curbing waste.
Healthcare is the fastest climber with a 21.60% CAGR to 2031. Serialization mandates under the U.S. Drug Supply Chain Security Act demand unit-level traceability, and cloud platforms scan barcodes at every hand-off. Temperature-controlled biologics rely on IoT sensors that feed cloud dashboards, triggering alerts for excursions. Hospital group purchasing organizations adopt cloud procurement to aggregate volume, reduce maverick buys, and enforce formulary compliance. Cold-chain trends intensify technology requirements, prompting pharmaceutical and vaccine manufacturers to adopt real-time lane monitoring.
Geography Analysis
North America delivered 34.41% of 2025 revenue. U.S. Customs and Border Protection’s Automated Commercial Environment APIs automate customs entry creation, lowering brokerage costs for importers. Early hyperscaler buildouts ensure low-latency access for time-sensitive control towers and freight visibility dashboards. Canada’s Safe Food for Canadians Regulations push agri-food exporters to establish farm-to-fork traceability, spurring cloud investments. Mexico’s near-shoring trend has electronics and auto assemblers digitizing supplier collaboration to bypass Pacific shipping risks.
The Asia Pacific is poised for the fastest regional growth, with an 18.05% CAGR. Contract manufacturers in China, India, and Vietnam digitize tier-2 and tier-3 partners to meet just-in-time milestones set by global brands. China’s Belt and Road rail corridors heighten the need for multi-modal route optimization. India’s fully digital Goods and Services Tax e-invoicing feeds cloud systems that reconcile tax liabilities in real time. Japan’s aging driver population fuels the adoption of AI-powered route consolidation, while Australia’s commodity exporters automate export documentation to speed vessel bookings.
Europe maintains a significant uptake, owing to the GDPR and the Corporate Sustainability Reporting Directive, which embeds compliance functionality into vendor RFPs. Germany’s automotive sector employs constraint-based planning to manage multi-tier capacity. The United Kingdom’s post-Brexit rules accelerate the adoption of automated tariff classification. France’s luxury segment relies on short seasonal calendars and uses demand sensing to slash markdowns. Russia’s data-localization law remains a barrier, steering companies to domestic cloud alternatives that add latency for global partners.
Regulatory Landscape
Regulation shaping cloud supply chain management spans cybersecurity, software assurance, and cross-border data governance, which is pushing vendors toward more auditable controls and clearer third-party risk documentation. In the European Union, the Cyber Resilience Act (CRA) entered into force on 10 December 2024, with certain vulnerability reporting obligations becoming applicable from September 2026 for manufacturers. This reinforces the need to manage exploited vulnerabilities across the software lifecycles used in supply chain workflows.
In the United States, public-sector buying rules and guidance increasingly tie cloud adoption to supply chain risk management practices. U.S. GSA guidance for cloud and cloud-related services has been updated to emphasize supply chain risk considerations, including SBOM-style transparency in RFQs. NIST published SP 1326 in July 2026 (Cybersecurity Supply Chain Management: Due Diligence Assessment Quick-Start Guide), offering a structured approach to C-SCRM due diligence that can be mapped into vendor security questionnaires, SOC 2 controls, and customer audit requirements. Separately, U.S. Department of Commerce BIS issued a final rule in January 2025 restricting certain connected-vehicle ICTS transactions tied to foreign adversaries, adding further scrutiny of software and component provenance across digitally enabled supply chains.
Value Chain Analysis
The value chain for cloud supply chain management begins with hyperscale and sovereign-cloud infrastructure, data platforms, and security tooling that support SaaS delivery, then moves to application vendors (ERP suites and SCM specialists) that package planning, logistics, procurement, and control-tower capabilities. Implementation partners and systems integrators configure connectors to ERPs, TMS/WMS, and trade systems, while data providers (carrier networks, IoT/telematics, ports, and customs interfaces) feed real-time events. Downstream, shippers, manufacturers, retailers, and logistics providers operationalize workflows through marketplaces and APIs that connect carriers, brokers, warehouses, and suppliers.
Recent moves show how compute, logistics infrastructure, and digital platforms are converging to enable cloud SCM outcomes. In June 2026, BNSF Railway reported city approval for the USD 4 billion Barstow International Gateway intermodal project in California, which supports higher-throughput domestic routing and increases demand for digital scheduling, visibility, and yard-to-warehouse orchestration. In July 2026, Maersk announced a USD 100 million fulfillment hub investment in Hopedale, Massachusetts (617,000 sq. ft.), reflecting continued expansion of multi-node fulfillment operations that depend on cloud-native WMS/TMS integration. On the technology supply side, scaling AI-ready cloud capacity and connectivity is also shaping the upstream chain, including Meta committing additional investment to expand its Richland Parish, Louisiana data center project (reported July 2026). Supplier-led connectivity programs, such as Prysmian and Molex signing a long-term optical cable agreement for AI data centers (July 2026), further reinforce the infrastructure base needed for compute-intensive digital twin planning and real-time analytics.
Competitive Landscape
The cloud supply chain management industry remains moderately fragmented, with no provider holding a significant share. Incumbent ERP vendors, SAP, Oracle, and Infor, cross-sell cloud modules into their established customer bases, bundling contracts to defend their market share. Pure-play specialists, including Blue Yonder, Manhattan Associates, and Kinaxis, compete through algorithmic depth in demand sensing, warehouse slotting, and concurrent planning. Emerging players, such as o9 Solutions and Verusen, embed machine learning for automatic forecast tuning and material risk scoring, differentiating themselves with faster time to value.
Platform ecosystems are a defining trend. Vendors curate marketplaces for ocean booking, trade compliance, or carbon calculators, letting buyers assemble best-of-breed stacks without custom code. Blue Yonder’s 2024 partnership with Microsoft Azure delivered retail and manufacturing data models pre-mapped to Azure data services. Kinaxis patented concurrent scenario editing, which allows multiple planners to adjust plans in real-time, thereby solving versioning pain points.
Regional expansion strategies intensify competition. Pure-plays chase Southeast Asia and Latin America by adding language packs, local tax logic, and regionally hosted nodes to meet data-sovereignty laws. Defensive moves include SAP extending its hyperscaler footprint in Saudi Arabia and Brazil, and Oracle acquiring Cleo for faster EDI onboarding of mid-market manufacturers. Mergers continue as larger suites buy logistics specialists to fill gaps quickly, exemplified by E2open’s 2025 purchase of Blume Global.
Cloud Supply Chain Management Industry Leaders
-
SAP SE
-
Oracle Corporation
-
Infor Inc
-
Descartes Systems Group Inc
-
IBM Corporation
- *Disclaimer: Major Players sorted in no particular order
Market Opportunities and Future Outlook
Agentic automation and digital twins are widening cloud SCM functionality from visibility and planning into exception handling and day-to-day execution. In June 2026, Oracle announced new Fusion Agentic Applications for Oracle Fusion Cloud SCM, and in July 2026, DeepFabric released an AI agent platform positioned around specialized agents for supply chain execution. Together, these announcements illustrate the shift from analytics add-ons to workflow-level automation across procurement, inventory, and manufacturing tasks. Large enterprises are also operationalizing digital twin programs at scale, as reflected by Unilever partnering with Accenture in June 2026 to scale AI-enabled digital twins across its global manufacturing network, aligning with buyer demand for scenario-based planning that can be refreshed with near-real-time signals.
A second opportunity sits in standardized, multi-site deployment models that reduce rollout friction for complex warehouse and contract logistics networks, where configuration reuse and unified data models matter. Kuehne+Nagel began rolling out a cloud-native version of its KN SwiftLOG warehouse management system (built on Blue Yonder) across over 1,000 sites globally starting April 2026. This points to continued demand for platform approaches that can be replicated across locations while keeping central governance. Government-led digital trade and supply chain intelligence initiatives also expand whitespace for vendors that can package compliance-ready data capture, electronic documentation, and resilience dashboards into cloud modules. Examples include the UK Global Supply Chains Intelligence Programme announced in April 2026 and the UK Department for Business and Trade establishing a Supply Chain Centre with a 14-point action plan (June 2026). These initiatives reinforce the need for interoperable data exchange, audit trails, and secure integration with customs and trade documentation systems in cloud SCM deployments.
Recent Industry Developments
- June 2026: Oracle introduced four new Fusion Agentic Applications within Oracle Fusion Cloud Supply Chain and Manufacturing (SCM) focused on inventory visibility and manufacturing efficiency improvements. The release reinforces the shift toward embedded, task-specific AI capabilities inside core cloud SCM workflows, raising the competitive bar for automation in planning and execution.
- May 2026: SAP announced progress toward Autonomous Supply Chain Management at SAP Sapphire, highlighting Joule Assistants and Industry AI scenarios with general availability phased through 2026. The roadmap signals deeper native AI assistance across SCM modules, influencing vendor selection criteria around copilots, workflow automation, and governed decisioning.
- December 2024: SAP expanded Joule availability into SAP S/4HANA Cloud and Supply Chain scenarios, integrating the assistant more directly into operational user journeys. This strengthened SAP's AI-led UX strategy for SCM teams by embedding guided actions and insights into day-to-day planning and execution screens.
Research Methodology Framework and Report Scope
Market Definition and Coverage
This market covers revenue earned from cloud delivered supply chain management software and related implementation and support services used to plan, execute, and monitor supply chain activities across industries and regions.
Scope exclusions: We exclude on-premises only SCM deployments and non-SCM enterprise apps that do not directly support supply chain planning or execution.
Segmentation Overview
- By Solution
- Demand Planning and Forecasting
- Inventory and Warehouse Management
- Product Lifecycle Management
- Transportation and Logistics Management
- Sales and Operations Planning
- Procurement and Sourcing
- Order Management
- Product Master Data Management
- By Deployment Type
- Hybrid Cloud
- Public Cloud
- Private Cloud
- By Organization Size
- Large Enterprises
- Small and Medium Enterprises
- By End-User Industry
- Retail
- Food and Beverage
- Manufacturing
- Automotive
- Oil and Gas
- Healthcare
- Consumer Electronics
- Aerospace and Defense
- Pharmaceuticals
- By Geography
- North America
- United States
- Canada
- Mexico
- South America
- Brazil
- Argentina
- Rest of South America
- Europe
- United Kingdom
- Germany
- France
- Italy
- Spain
- Russia
- Rest of Europe
- Asia Pacific
- China
- Japan
- India
- South Korea
- Australia
- Rest of Asia Pacific
- Middle East
- Saudi Arabia
- United Arab Emirates
- Turkey
- Rest of Middle East
- Africa
- South Africa
- Nigeria
- Egypt
- Rest of Africa
- North America
Data Sources, Market Sizing, and Validation
Desk Research
Desk work starts by anchoring the demand pool and adoption context for cloud based SCM. We used public sources such as the US Bureau of Economic Analysis (digital economy tables), US Census Bureau (business activity and trade data), Eurostat (ICT usage and enterprise stats), the World Bank (macro and trade indicators), and OECD (digital adoption metrics) to build clean directional inputs.
We cross checked market structure using company annual reports, SEC filings, investor presentations, earnings call transcripts, and press coverage about cloud product releases and customer wins. When needed, paid subscriptions were used for company financial intelligence, news and financials screening, and patent databases to identify module level investment activity and timing. These desk sources are illustrative, and we also used other public and paid references to collect, validate, and clarify data points.
Primary Interviews and Surveys
Primary work was used to pressure test what cloud SCM revenue looks like in practice and what share of each contract is software versus services. We spoke with SaaS product owners, system integrators, logistics and operations leaders, and procurement and planning managers across end users, then used their inputs to confirm adoption pace, module bundling, and typical renewal and expansion patterns across major regions.
Distribution of primary research fieldwork respondents
| Company type | Respondent position | Region |
|---|---|---|
| Top tier: 39% | CXOs: 14% | APAC: 39% |
| Mid tier: 42% | Functional/Unit leaders: 31% | EMEA: 34% |
| Smaller Players: 19% | Managers: 55% | Americas: 27% |
Market-Sizing & Forecasting
The core sizing model uses a top-down approach where enterprise software spend signals, cloud penetration by function, and end user adoption rates are used to reconstruct the addressable revenue pool for cloud SCM. The totals are then corroborated with selective bottom-up checks from a sample of supplier revenues, typical annual contract values, and module level attach rates, and the results are adjusted when the implied math does not match how buyers describe budgets.
Inputs used in the model include SaaS subscription and services mix, deployment patterns across public, private, and hybrid cloud, module adoption for areas like demand planning, transportation and logistics, inventory and warehouse, and procurement, and buying behavior by organization size and by end user industry. Where a vendor reports combined revenue across adjacent software categories, we apply splits based on product descriptions and interview based allocation rules, followed by a recheck against regional adoption signals.
For forecasting, we use multivariate regression combined with scenario analysis so the outlook reflects linked drivers rather than a single trend line. Key drivers include expected cloud migration pace, supply chain digitization after disruption events, industry level production and trade activity, and the rate of new module additions such as visibility and sustainability tracking, which expand average contract value.
Data Validation & Update Cycle
Outputs are validated through triangulation across three views: macro and enterprise spend signals, supplier and channel checks, and interview based pricing and adoption reality checks. Large variances are flagged, and the assumptions behind them are reviewed in steps, first by the model owner and then by a second analyst before sign-off.
We refresh the report annually, and interim updates are made when there is a material change like a major pricing shift, regulation driven demand, or a sharp regional slowdown. Before delivery, a fresh pass is completed so clients receive the most recent and internally consistent view.
Mordor Intelligence's Cloud Supply Chain Management Market Estimate Compared With Other Published Estimates
Published market sizes for cloud supply chain management often differ because the underlying scope and revenue recognition choices are not the same. Differences usually come from what is counted as cloud SCM, how services are treated, and whether the estimate is tied to adoption signals that can be rechecked.
Some published figures fold in broader supply chain software categories or include adjacent cloud platforms that sit outside SCM workflows. In Mordor Intelligence's model, revenue is counted only when it maps to defined SCM modules and cloud deployments, and services are included only when they are directly attached to those cloud SCM programs.
Benchmark comparison
| Source | Market Size | Gaps in Research Methodology |
|---|---|---|
| Mordor Intelligence | USD 13.98 B (2026) | |
| Global Consultancy A | USD 6.07 B (2024) | Uses an earlier base year and often reports a narrower revenue lens that leans toward subscription software only, which can undercount attached implementation and managed services in cloud SCM deals. |
| Trade Publisher B | USD 10.65 B (2025) | Tracks a nearby category focused on supply chain cloud service platforms, which can blend infrastructure and platform spend with application revenue, creating a different total and timing versus module-based SCM counting. |
Taken together, the spread mainly comes from category mixing and timing, not from a single math error. By keeping the scope tied to specific SCM modules, checking software and services splits through interviews, and rechecking outcomes against adoption and spend signals, the resulting number stays traceable and repeatable for planning.
Key Questions Answered in the Report
What is the current value of the cloud supply chain management market?
The market generated USD 13.98 billion in 2026 and is forecast to climb to USD 30.56 billion by 2031.
Which deployment model dominates cloud supply chain systems?
Public Cloud leads with 60.58% 2025 revenue, favored for rapid activation and vendor-managed infrastructure.
Which industry segment will grow fastest through 2031?
Healthcare is projected to post a 21.60% CAGR through 2031 due to serialization mandates and cold-chain traceability needs.
Why are digital twins important in supply chains?
Digital twins simulate network disruptions, allowing planners to preempt delays and reduce expedited freight costs, driving a 21.25% CAGR for this solution type.
How fragmented is vendor competition?
No provider holds more than 15% share, and the top five control roughly 30%, indicating moderate fragmentation.