
Cloud Project Portfolio Management Market Size and Share
Market Overview
| Study Period | 2020 - 2031 |
|---|---|
| Market Size (2026) | USD 13.28 Billion |
| Market Size (2031) | USD 25.53 Billion |
| Growth Rate (2026 - 2031) | 13.96 % |
| Fastest Growing Market | Asia Pacific |
| Largest Market | North America |
| Market Concentration | Medium |
Major Players *Disclaimer: Major Players sorted in no particular order Image © Mordor Intelligence. Reuse requires attribution under CC BY 4.0. | |
Cloud Project Portfolio Management Market Analysis by Mordor Intelligence
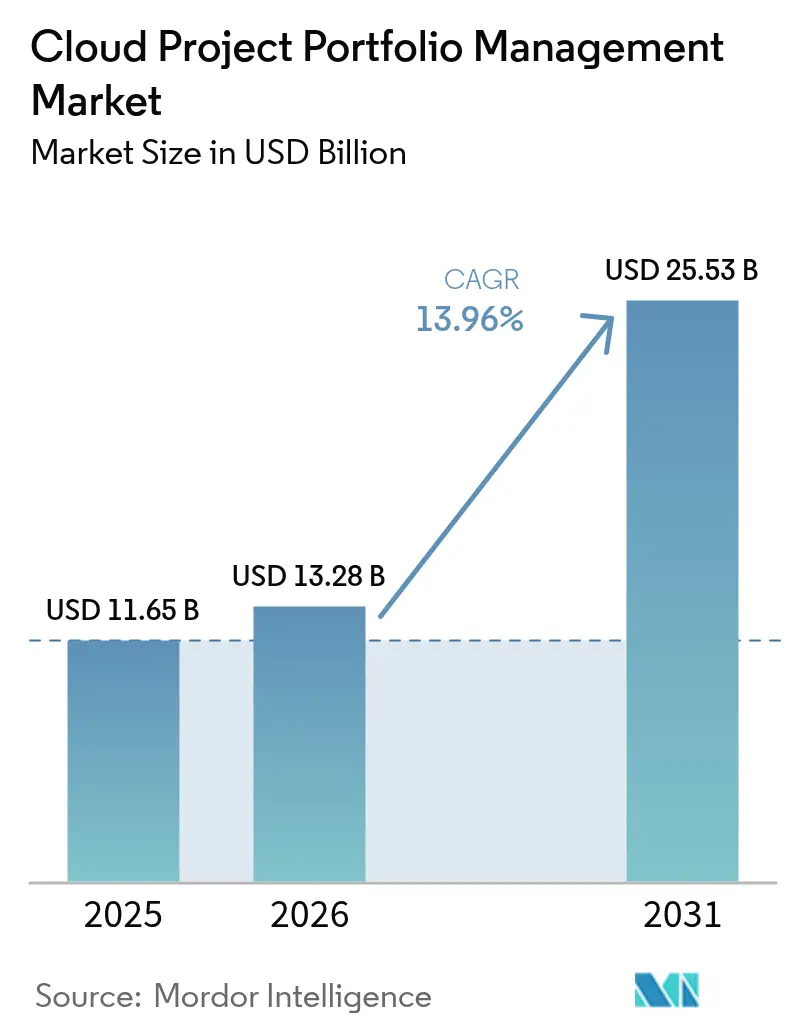
The cloud project portfolio management market size was valued at USD 11.65 billion in 2025 and estimated to grow from USD 13.28 billion in 2026 to reach USD 25.53 billion by 2031, at a CAGR of 13.96% during the forecast period (2026-2031). Rapid adoption of artificial intelligence, convergence of FinOps workflows, and the need to orchestrate hybrid workforces underpin the expansion of this software category. Demand accelerates in manufacturing settings where Industry 4.0 programs generate intricate, multi-vendor initiatives that require unified project oversight. Large enterprises still anchor spending; however, small and medium enterprises are scaling deployments quickly as subscription pricing removes IT-infrastructure hurdles. Deployment patterns show a pivot toward hybrid cloud estates that blend on-premise data stewardship with cloud-native analytics, while regional dynamics reveal Asia-Pacific closing the gap with North America on the strength of government-backed digitization investments. Competitive intensity is shaped by AI-first, cloud-native vendors that challenge incumbent enterprise software suppliers through predictive resource planning and real-time collaboration functions.
Key Report Takeaways
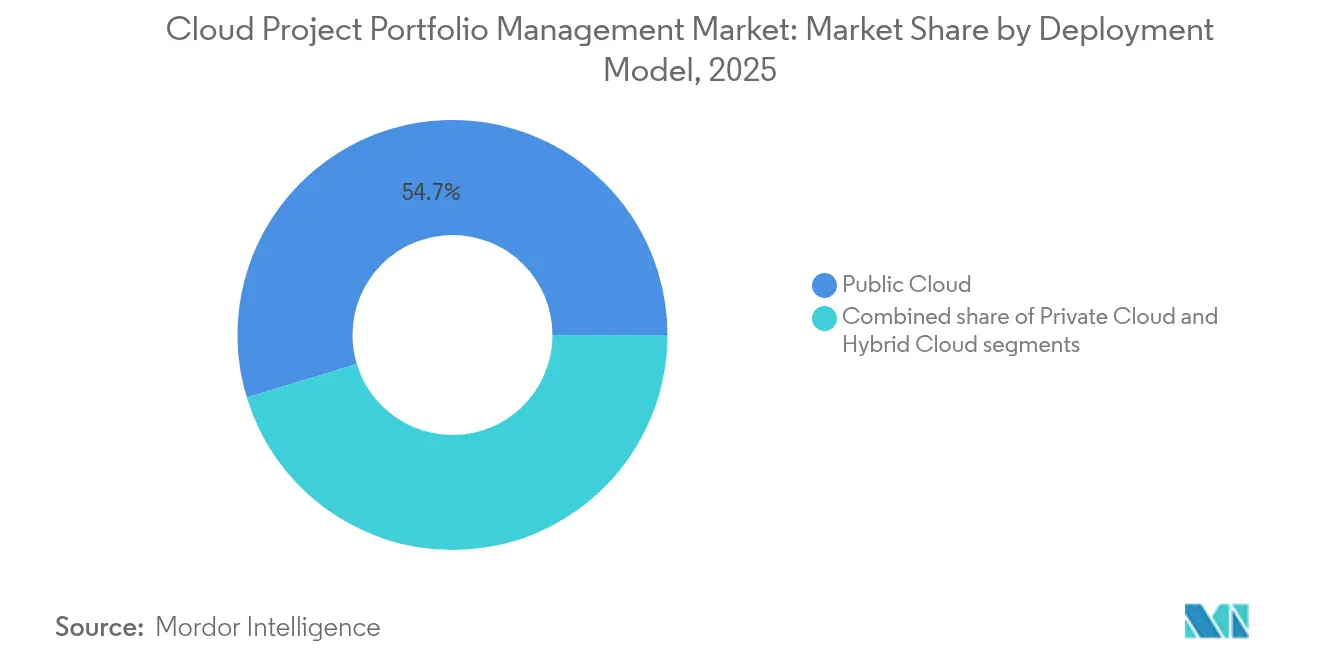
- By deployment model, public cloud led with 54.70% revenue share in 2025; hybrid cloud is projected to grow at a 15.05% CAGR to 2031.
- By application, portfolio management held 45.20% of the cloud project portfolio management market share in 2025, while resource management is advancing at a 14.65% CAGR through 2031.
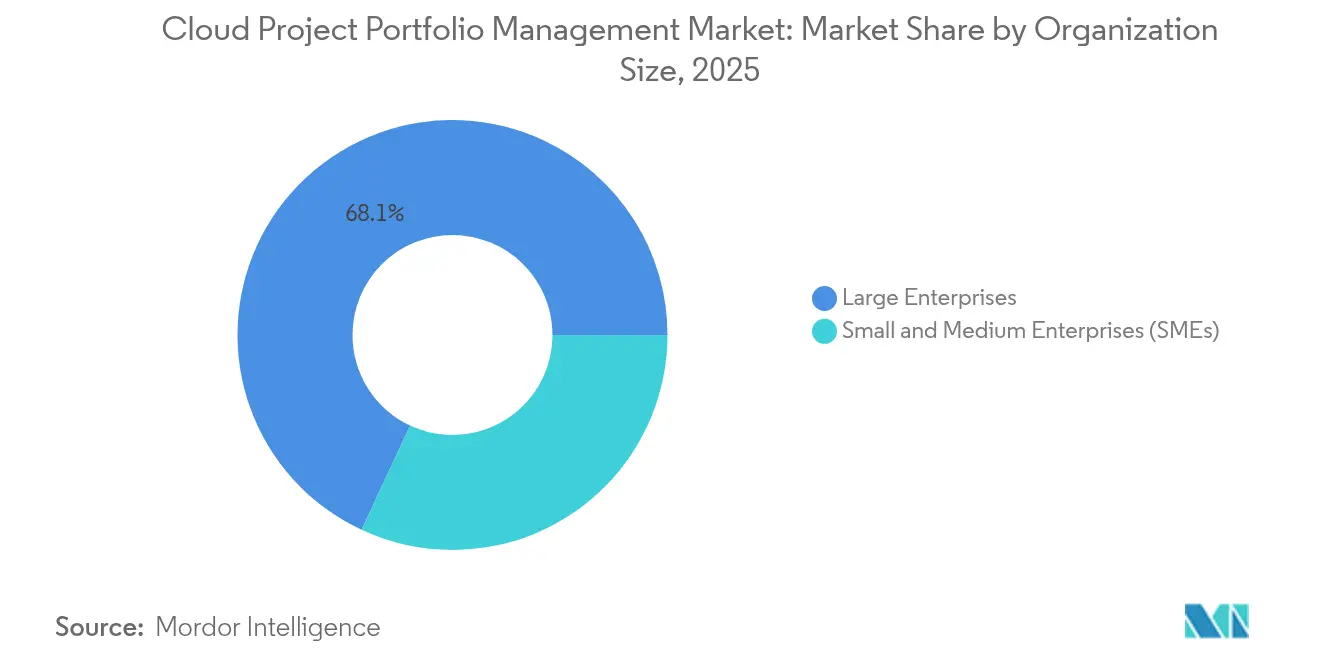
- By organization size, large enterprises captured 68.05% of the cloud project portfolio management market size in 2025; SMEs are forecast to expand at a 15.35% CAGR between 2026 and 2031.
- By industry vertical, IT and telecommunications accounted for 35.20% revenue share in 2025; manufacturing is forecast to grow at a 14.12% CAGR through 2031.
- By geography, North America led with 37.10% revenue share in 2025, whereas Asia-Pacific is set to record a 14.40% CAGR to 2031.
Note: Market size and forecast figures in this report are generated using Mordor Intelligence’s proprietary estimation framework, updated with the latest available data and insights as of 2026.
Market Trends and Insights
Drivers Impact Analysis of Cloud Project Portfolio Management Market*
| Driver | (~) % Impact on CAGR Forecast | Geographic Relevance | Impact Timeline |
|---|---|---|---|
| Growing BYOD and mobile-first workforce | +2.1% | Global, North America and EU focus | Short term (≤ 2 years) |
| Higher adoption of cloud analytics | +2.8% | Asia-Pacific core, North America spill-over | Medium term (2-4 years) |
| Shift toward hybrid / remote work models | +3.2% | Global, developed markets | Medium term (2-4 years) |
| Need for real-time portfolio visibility and ROI optimization | +2.5% | North America and EU, expanding Asia-Pacific | Short term (≤ 2 years) |
| FinOps-driven cost-governance integration | +1.9% | Global, cloud-mature firms | Long term (≥ 4 years) |
| AI-powered predictive project-health scoring | +2.7% | North America and EU early adopters | Medium term (2-4 years) |
| Source: Mordor Intelligence | |||
Growing BYOD and mobile-first workforce
Sixty-one percent of project management professionals now operate remotely at least part-time. Mobile access has therefore shifted from convenience to a baseline requirement. Enterprises migrating from desktop-centric tools prioritize responsive interfaces, biometric security, and offline sync to ensure continuity in travel or low-bandwidth scenarios. Technology and professional-services firms adopt mobile-optimized suites fastest because billable time hinges on instantaneous status updates. Vendors that embed push notifications and voice commands differentiate by allowing field engineers and consultants to react without opening laptops. As device diversity grows, platform compatibility becomes a decisive buying criterion for IT procurement leaders.
Higher adoption of cloud analytics
Organizations analyze historical project artifacts to forecast completion probabilities, flag resource bottlenecks, and quantify risk exposure. Machine-learning modules embedded in cloud project portfolio management market offerings accelerate this shift from descriptive dashboards to predictive insights. Enterprises running multi-year transformation programs benefit most, because statistical models surface interdependencies hidden in spreadsheets. Moreover, cost allocation accuracy improves when embedded analytics trace actual labor and infrastructure usage. Executives thus base prioritization decisions on empirical performance rather than intuition, which raises portfolio throughput and budget fidelity.
Shift toward hybrid/remote work models
Hybrid arrangements reshape collaboration norms by blending agile and predictive methodologies across time zones. Digital whiteboards, embedded video conferencing, and shared document repositories now ship as standard modules in cloud project portfolio management market platforms. Organizations that unify task, resource, and financial views inside the same interface avoid the silos that previously plagued distributed teams. Asynchronous communication features, such as threaded context within Gantt views, maintain momentum when colleagues are offline, while automated reminders enforce sprint cadences. The trend cements long-term demand for cloud-native suites that deliver identical experiences on desktop and mobile endpoints.
Need for real-time portfolio visibility and ROI optimization
Boards and CFOs demand continuous insight into strategic alignment, burn rates, and resource utilization. Modern dashboards ingest live data streams from DevOps, HR, and finance systems, translating them into heat-maps that flag projects at risk of schedule or budget overrun. Automated variance alerts reduce reliance on manual status reporting, freeing project managers to focus on remediation. Integrating earned-value analysis with scenario planning lets executives rebalance investment toward initiatives with superior return potential. As a result, platforms that combine financial and operational metrics achieve higher retention among Fortune 500 clients.
Restraints Impact Analysis of Cloud Project Portfolio Management Market*
| Restraint | (~) % Impact on CAGR Forecast | Geographic Relevance | Impact Timeline |
|---|---|---|---|
| Persistent security and privacy concerns | -1.8% | Global, high in EU and Germany | Short term (≤ 2 years) |
| Vendor lock-in across multi-cloud ecosystems | -1.4% | North America and EU | Medium term (2-4 years) |
| Lack of unified data taxonomies for AI models | -1.1% | Global | Long term (≥ 4 years) |
| Emerging ESG-reporting complexity | -0.9% | EU-led, expanding | Long term (≥ 4 years) |
| Source: Mordor Intelligence | |||
Persistent security and privacy concerns
Seventy-one percent of German cloud executives cite high cybersecurity anxiety when shifting project data off-premise[1]. Industries handling intellectual property or patient records often keep sensitive artifacts on-site, resorting to hybrid configurations that restrict external access. Fragmented international regulations such as GDPR add compliance overhead and force data-residency checks during portfolio planning. Though major vendors invest in zero-trust architectures and region-specific data centers, breach headlines still sway risk-averse boards. Consequently, procurement cycles elongate and pilot scopes narrow in financial services and healthcare.
Vendor lock-in across multi-cloud ecosystems
Eighty-five percent of enterprises operate workloads on two or more public clouds yet struggle to orchestrate them coherently. Proprietary workflow engines risk trapping metadata within a single provider, complicating exit strategies. Organizations therefore prioritize platform-agnostic tools built on open APIs and portable containers. Suppliers that certify interoperability with AWS, Azure, Google Cloud, and Oracle gain traction, particularly among conglomerates that inherit heterogeneous stacks via mergers. Absence of standardized cost-allocation tags across clouds further reinforces buyer hesitation.
*Our forecasts treat driver/restraint impacts as directional, not additive. The impact forecasts reflect baseline growth, mix effects, and variable interactions.
Cloud Project Portfolio Management Market Segment Analysis
By Deployment Model:
Hybrid Cloud Drives Strategic FlexibilityHybrid architectures recorded a 15.05% CAGR and continue to outpace other models as enterprises balance sovereignty with elasticity. The cloud project portfolio management market size for hybrid deployments is forecast to represent USD 10.06 billion by 2031, reflecting the segment’s strategic importance. Regulated industries prefer to process sensitive artifacts on-premise while streaming anonymized telemetry to cloud analytics engines for capacity planning. Hybrid suites integrate VPN orchestration, policy-based workload placement, and AI-assisted latency optimization, enabling project teams to place data where compliance and cost objectives align.
Vendor roadmaps reveal deeper support for edge nodes that synchronize intermittently yet preserve full functionality in disconnected scenarios. Automotive and defense contractors, for example, leverage offline-first capability to run simulations in secure facilities, later syncing progress to global stakeholders. Public cloud retains the broadest ecosystem and 54.70% revenue share, but hybrid’s growth trajectory underscores a shift toward mixed tenancy. Private cloud remains relevant for firms requiring complete tenant isolation; however, capital expenditure and talent demands curb its uptake. As cloud maturity rises, the cloud project portfolio management market sees heightened demand for policy engines that automate optimal workload distribution.

By Application:
Resource Management Gains Strategic PriorityResource management software is expanding at a 14.65% CAGR, outstripping portfolio governance modules. In 2025, portfolio management commanded 45.20% of revenue, yet capacity-planning pain points elevate resource-centric features in buying criteria. The cloud project portfolio management market share for resource management solutions reached 22.10% in 2025 and is expected to climb steadily. Predictive staffing algorithms match skills with sprint deliverables, reducing idle time and minimizing expensive contractor reliance. Professional services firms report margin lifts after adopting AI-driven allocation that quantifies probability-weighted utilization scenarios.
Integrated skills matrices and learning-path suggestions further connect talent development with delivery outcomes. Demand management, time tracking, and financial control modules converge into unified suites, creating a single source of truth for workforce and cost data. Vendors embedding natural-language chatbots simplify resourcing decisions for non-technical managers. Meanwhile, portfolio governance remains essential for strategic alignment, especially in conglomerates funding hundreds of concurrent initiatives. Yet the fastest value capture often occurs when under-resourced teams promptly redeploy staff to high-impact milestones, explaining the segment’s momentum.
By Organization Size:
SMEs Accelerate Cloud AdoptionSmall and medium enterprises exhibit a 15.35% CAGR as intuitive interfaces and pay-as-you-go pricing democratize enterprise-grade functionality. The segment accounted for 31.95% of the cloud project portfolio management market size in 2025 and will approach parity with large enterprises by 2031. Templates that pre-configure workflows for marketing launches or software sprints cut setup times from months to days. MDPI survey data indicates SMEs cite faster time-to-value and lower administrative overhead as top reasons for cloud migration.
Startups often leapfrog legacy on-premise stacks entirely, deploying single-sign-on and API integrations via marketplace click-through. Vendors respond by bundling onboarding services and community forums that substitute for large IT departments. Large enterprises still spend more in absolute terms due to customization, security reviews, and global rollouts, but their CAGR lags as many have already modernized their flagship portfolios. Hybrid governance boards at multinationals now pilot lightweight tools in business units, borrowing usability lessons from SME-oriented products to rejuvenate employee engagement.
By Industry Vertical:
Manufacturing Leads Digital TransformationManufacturing adoption is climbing at a 14.12% CAGR, propelled by digitized supply chains and complex product lifecycles. Automotive and aerospace engineers coordinate firmware updates, mechanical design, and compliance artefacts across suppliers, making real-time visibility critical. The cloud project portfolio management market size for manufacturing is projected to exceed USD 3.92 billion by 2031. Digital twins, additive manufacturing projects, and smart-factory retrofits introduce interdependencies that traditional spreadsheets cannot manage.
IT and telecommunications remained the largest spenders with a 35.20% share in 2025, citing software-release cadences and customer experience initiatives. Healthcare, life sciences, and public sector players deploy the platforms to maintain audit trails and unify grant-funded research. Vendor roadmaps increasingly include industry-specific accelerators, such as validated templates for ISO 13485 medical device compliance. This vertical tailoring shortens sales cycles and creates stickiness by embedding regulatory nuance directly in workflow logic.
Geography Analysis
North America Cloud Project Portfolio Management Market
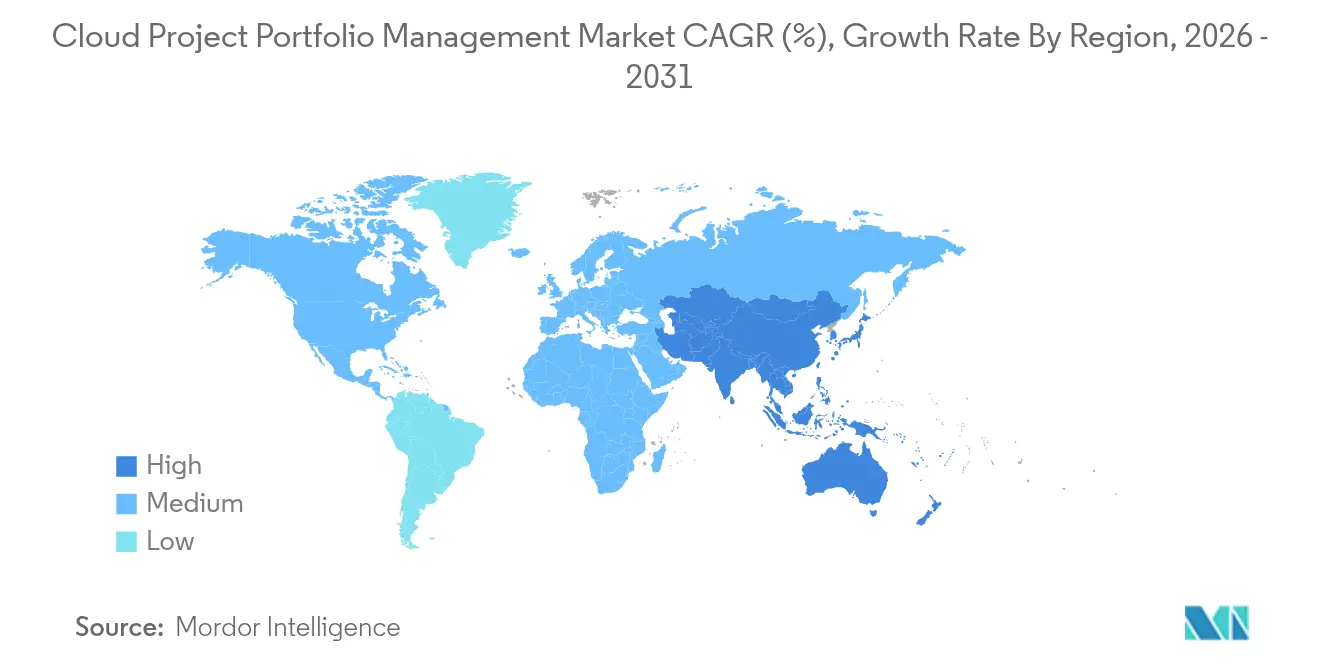
North America led the cloud project portfolio management market with a 37.10% share in 2025. United States operators in finance, aerospace, and technology anchor high-value enterprise rollouts, while Canada’s natural-resources firms implement cloud suites to manage capital-intensive projects. Mexico’s manufacturing corridors adopt the software to coordinate near-shore production schedules with US buyers. Mature SaaS penetration, robust 5G coverage, and deep reskilling programs sustain regional demand; nonetheless, heightened scrutiny on data residency keeps hybrid and sovereign-cloud options in focus.
APAC Cloud Project Portfolio Management Market
Asia-Pacific is the fastest-growing theatre at a 14.40% CAGR through 2031. China’s state-backed digital-economy programs incentivize local manufacturers to migrate engineering workflows to the cloud. Indian service integrators embed project portfolio management into client delivery frameworks, accelerating toolchain standardization. Japanese and South Korean conglomerates integrate factory-floor IoT telemetry with portfolio dashboards to compress time-to-market for electronics. Rapid submarine-cable expansion and hyperscaler datacenter investment lower latency, encouraging real-time collaboration across ASEAN project teams.
Europe Cloud Project Portfolio Management Market
Europe maintains steady mid-single-digit growth. German automotive giants enforce stringent data-sovereignty controls that favor regional providers and hybrid deployment. United Kingdom enterprises in life sciences pursue cloud suites to track multistage clinical trials under MHRA oversight. France, Italy, and Spain add momentum via public-sector modernization funds. Nordic firms prove early adopters of AI-infused resource scheduling, aligning with their advanced digital-government agendas. Regulatory complexity, including GDPR and forthcoming AI Act provisions, extends vendor qualification cycles but ultimately drives premium pricing for compliant offerings.
Regulatory Landscape
Cloud project portfolio management deployments increasingly operate under data protection, sovereignty, and cloud-assurance regimes that influence where project artifacts, financials, and collaboration data can be stored and processed. In the European Union, the European Commission adopted the proposal for the Cloud and AI Development Act (CADA) in June 2026, creating a unified framework for cloud and AI sovereignty, including tiered Union assurance levels for trusted services. This raises certification, auditability, and data residency requirements for vendors serving public sector and regulated enterprise buyers.
Outside the EU, cross-border data controls and procurement restrictions have become more visible in trade and policy discussions. The U.S. Office of the United States Trade Representative highlighted government cloud procurement restrictions tied to data sovereignty and localization in its April 2026 report on trade barriers, reflecting compliance complexity for global CPPM rollouts spanning multiple jurisdictions. At the same time, U.S. government guidance such as NIST cloud interoperability, portability, and security frameworks continues to shape security and audit expectations that enterprise buyers cite during vendor qualification and hybrid-cloud governance.
Value Chain Analysis
The CPPM value chain starts with hyperscale and sovereign cloud infrastructure, identity and access management, and cybersecurity controls that host the application layer. CPPM platform vendors then deliver portfolio, project, resource, and financial modules as subscription software.
A key downstream layer is integration and implementation partners that connect CPPM to systems of record (ERP, HRIS, CRM) and delivery toolchains (DevOps and collaboration suites), since many buyers use CPPM as an operating layer to align investment governance with execution across hybrid workforces. Value realization concentrates in integration, data modeling, and change management, where API-first connectivity and standardized data taxonomies reduce manual status reporting and reconcile financial and resource data in near real time. Recent enterprise patterns also point to deeper packaged integrations, including Boldyn Networks expanding PPO-linked project delivery and financial control by adding Workday integration in March 2026, after earlier integrations such as Salesforce and Exchequer, and a large enterprise migration that consolidated governance on ServiceNow Strategic Portfolio Management and integrated with Jira and SharePoint in April 2026. This integration-centric chain also aligns with market demand for portability across multi-cloud stacks, while hybrid deployments keep sensitive artifacts on-premise and stream operational telemetry to cloud analytics engines.
Competitive Landscape
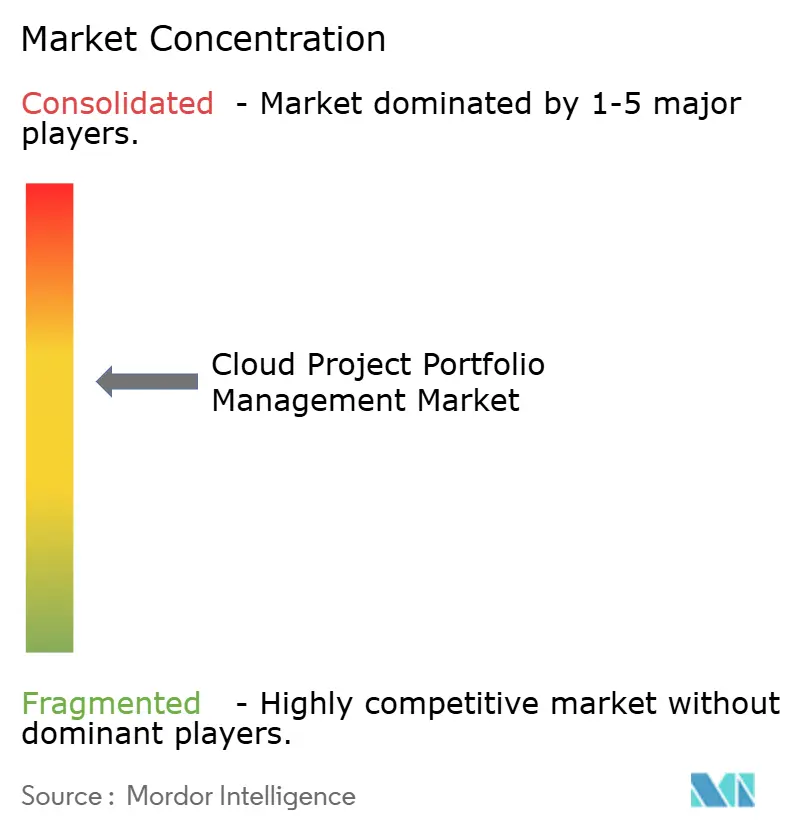
Competition is moderate with a blend of diversified software titans and cloud-native specialists. Microsoft, Oracle, and SAP capitalize on installed ERP footprints to cross-sell integrated portfolio modules. Oracle’s collaboration with Microsoft to host Oracle Database@Azure illustrates the market’s push to simplify multi-cloud operations[3]. Atlassian, Smartsheet, and monday.com pursue ease of use and rapid iteration, often landing in departmental budgets before expanding enterprise-wide.
Differentiation centers on embedded AI and extensibility. Atlassian’s Rovo launch integrates knowledge discovery and generative answers, positioning the firm to upsell predictive workflow automation. ServiceNow invests in regional partners, such as inMorphis, to localize generative-AI features for banking and telecoms. Vendors are also layering no-code builders so domain experts can tailor intake forms, approval gates, and KPIs without IT tickets. Open API ecosystems remain pivotal as clients demand bi-directional sync with DevOps, HRIS, and finance systems to maintain data congruence.
White-space exists in industry-specific compliance accelerators and edge-aware orchestration that harmonizes factory-floor data with cloud analytics. Mergers and acquisitions and strategic partnerships will likely intensify as platform players acquire AI start-ups to advance schedule-risk forecasting. Enterprises evaluating vendors rank cyber-security certifications, roadmap transparency, and customer success maturity alongside feature depth. Market leaders with expansive support footprints and flexible deployment options hold an advantage as regulatory landscapes tighten.
Cloud Project Portfolio Management Industry Leaders
-
Broadcom Corporation
-
Hewlett Packard Enterprise Development LP
-
Changepoint Corporation
-
Clarizen, Inc.
-
Microsoft Corporation
- *Disclaimer: Major Players sorted in no particular order
Cloud Project Portfolio Management Market Companies Covered in this Report
- Broadcom (Clarity)
- Hewlett Packard Enterprise
- Changepoint
- Clarizen
- Microsoft
- Mavenlink
- Oracle
- Planisware
- ServiceNow
- SAP
- Upland Software
- Workfront (Adobe)
- Planview
- Atlassian
- Smartsheet
- monday.com
- Wrike (Citrix)
- Asana
- WorkOtter
- Sciforma
Read Analysis of Cloud Project Portfolio Management Companies
Market Opportunities and Future Outlook
AI-native portfolio intelligence and workflow automation are broadening the opportunity set as vendors move beyond dashboarding into embedded copilots, in-memory analysis, and automated scenario planning. In 2026 product activity reflects this shift, with OnePlan expanding its Sofia AI assistant with copilot capabilities and adding German language support, and Planisware introducing Planisware Prisma as an AI-native operating layer for in-memory analysis and UI automation. These launches create room for vendors and integrators to standardize executive reporting, automate intake and prioritization, and reduce data friction that slows portfolio decision cycles across distributed teams.
Regulated-industry governance is another addressable area, where buyers look for packaged compliance controls inside CPPM workflows. In 2026, Cora Systems released an AI-powered update targeted at regulated industries, unifying earned value management, scheduling, and cost control aligned to standards such as FAR, DFARS, and ANSI/EIA-748, which supports demand for audit-ready templates and traceable financial governance. As hybrid-cloud adoption expands within regulated enterprises, CADA-related assurance schemes in the EU and continuing sovereignty requirements in multiple regions open additional differentiation paths for CPPM providers, especially around data residency controls, certification readiness, and integration patterns that preserve sensitive artifacts on-premise while enabling portfolio-wide analytics.
Recent Industry Developments in Cloud Project Portfolio Management Market
- March 2026: Boldyn Networks expanded PPO-linked project delivery and financial control by adding Workday integration, following earlier integrations with Salesforce and Exchequer. The update improves data flow between portfolio data and ERP-grade records across multi-cloud environments.
- March 2025: Microsoft and Oracle extended their alliance via Oracle Database@Azure, offering co-located databases designed to support unified workload management and lower latency. For CPPM buyers running complex, integrated toolchains, this multi-cloud alignment supports tighter coupling between portfolio data, ERP-grade records, and analytics without forcing a single-cloud commitment.
- May 2024: ServiceNow invested in inMorphis to deepen coverage in India and ASEAN while co-developing generative-AI modules for finance and telecoms. The move broadened ServiceNow’s partner capacity in fast-digitizing markets and supported localization of AI-enabled portfolio and workflow use cases for large regional deployments.
Cloud Project Portfolio Management Market Report Scope and Research Methodology
Market Definition and Coverage
For this study, the market covers cloud delivered project portfolio management software that helps organizations plan, prioritize, fund, execute, and track multiple projects through one shared workspace, with pricing typically linked to users or usage tiers.
Scope exclusions: We exclude on-premise PPM deployments, stand-alone task tracking tools, and revenue that is only from professional services without a recurring cloud software component.
Segments Covered in This Report
- By Deployment Model
- Public Cloud
- Private Cloud
- Hybrid Cloud
- By Application
- Portfolio Management
- Demand Management
- Project Management
- Resource Management
- Other Applications
- By Organization Size
- Large Enterprises
- Small and Medium Enterprises (SMEs)
- By Industry Vertical
- BFSI
- Healthcare and Life Sciences
- IT and Telecommunications
- Manufacturing
- Government and Public Sector
- Other Industry Verticals
- By Geography
- North America
- United States
- Canada
- Mexico
- Europe
- Germany
- United Kingdom
- France
- Italy
- Spain
- Rest of Europe
- Asia-Pacific
- China
- Japan
- India
- South Korea
- Australia and New Zealand
- Rest of Asia-Pacific
- South America
- Brazil
- Argentina
- Rest of South America
- Middle East and Africa
- Middle East
- Saudi Arabia
- United Arab Emirates
- Turkey
- Rest of Middle East
- Africa
- South Africa
- Egypt
- Nigeria
- Rest of Africa
- Middle East
- North America
Data Sources, Market Sizing, and Validation
Desk Research
Desk research started with defining what qualifies as cloud PPM in day to day buying, and then mapping the demand signals that can be checked in public data. We used sources such as the US Bureau of Labor Statistics for workforce and wage context, the US Census Bureau for business structure indicators, OECD ICT and digital economy statistics for comparable adoption trends, and World Bank macro series to keep the IT spending backdrop consistent across regions.
We also reviewed sources such as SEC filings, annual reports, investor presentations, and reputable press coverage to understand subscription mix, customer expansion patterns, and product positioning that influences what should be counted as portfolio management versus adjacent work management. In places where public disclosures were too aggregated, we relied on paid subscriptions that support company financials and intelligence, patent databases, and news and financials to cross-check product focus and timing of releases. The sources listed here are illustrative, and many other public and paid references were used during data collection, validation, and clarification.
Primary Interviews and Surveys
Primary work was used to test what buyers actually purchase under cloud PPM and how pricing and seat expansion behave after initial rollout, and then those learnings were applied back into the model. We spoke with implementation partners, enterprise PMO leaders, IT procurement teams, and product and strategy roles at solution providers across major regions so that assumptions like cloud mix, renewal behavior, and module attach were not left as desk-only estimates.
Distribution of primary research fieldwork respondents
| Company type | Respondent position | Region |
|---|---|---|
| Top tier: 37% | CXOs: 18% | APAC: 44% |
| Mid tier: 45% | Functional/Unit leaders: 23% | EMEA: 31% |
| Smaller Players: 18% | Managers: 59% | Americas: 25% |
Market-Sizing & Forecasting
Our sizing uses a top-down and bottom-up approach, where the demand pool is first reconstructed from cloud software spending patterns and enterprise adoption of portfolio governance practices, and then it is sanity checked with selective supplier and channel approximations. In practice, the top-down layer is anchored on how many target organizations run formal portfolio oversight, what share uses cloud delivery for these workflows, and the typical subscription value implied by user counts and pricing tiers.
To keep the model realistic, a few inputs are treated as primary drivers, such as the installed base of knowledge workers likely to be licensed, the mix of enterprise versus mid-market adoption, average users per customer account, module attachment for resource and financial governance, and expected price progression for subscriptions when functionality expands. Forecasting was then built using scenario analysis supported by expert consensus, because adoption and expansion rates can move quickly with budget cycles, compliance needs, and shifts in remote program delivery. When bottom-up checks were used, they were applied as sampled average contract value times estimated active customer counts for a defined vendor set, and gaps were handled by using adoption ratios and channel feedback rather than forcing an unrealistic full vendor roll-up.
Data Validation & Update Cycle
Model outputs were tested through multiple checks, including cross verification against independent indicators like enterprise cloud application adoption, reported subscription growth patterns, and changes in PMO headcount intensity in key industries. Outliers are flagged early, and assumptions are revisited when the implied spend per user or adoption rate moves outside what interviews and public disclosures suggest.
Before sign-off, a second analyst reviews the calculation chain and checks for year alignment, currency conversion timing, and any double counting between portfolio tools and adjacent work management categories. Reports refresh annually, and interim updates are triggered when material events occur, such as major licensing changes, pricing restructuring, or notable shifts in buyer budgets. Right before delivery, a final pass is completed so clients receive the most current view that can be traced back to clear inputs.
Mordor Intelligence's Cloud Project Portfolio Management Market Size Versus Other Published Estimates
Published market sizes for cloud project portfolio management can look far apart because firms do not always count the same product boundary, time window, and revenue components. Differences also show up when one estimate leans on vendor revenue alone, and another relies more on buyer adoption and subscription value assumptions.
Vendor subscription mix disclosures, cloud usage patterns in enterprise software, and interview checks on average licensed users per account are the evidence used to keep Mordor Intelligence's total tied to recurring cloud PPM subscription revenue, rather than broader work management or bundled collaboration spending. In addition, some publishers use older currency timing or a more aggressive expansion curve for seat growth, which can lift the near-term number even when the buyer base is unchanged.
Benchmark comparison
| Source | Market Size | Gaps in Research Methodology |
|---|---|---|
| Mordor Intelligence | USD 13.28 B (2026) | |
| Research Publisher A | USD 6.94 B (2024) | Uses an earlier base year and a different market framing (cloud-based PPM), which can pull in adjacent categories or apply different inclusion rules for services and modules, thereby shifting the revenue total. |
| Industry Publisher B | USD 5.06 B (2025) | Sets a different base year and a longer forecast window, and its growth curve implies a narrower counted spend per customer, which often happens when portfolio governance features are treated as optional add-ons rather than core subscription value. |
Across the three figures, the spread is largely explained by year alignment and what gets counted as true cloud PPM subscription revenue versus adjacent tooling and service-led activity. By tying the model to repeatable demand signals like licensed user assumptions, renewal behavior, and cloud delivery mix, the resulting market value stays easier to audit and update when new disclosures or interview feedback comes in.
Key Questions Answered in the Report
What is the current value of the cloud project portfolio management market?
The market is valued at USD 13.28 billion in 2026 and is expected to reach USD 25.53 billion by 2031.
Which deployment model is growing fastest?
Hybrid cloud deployments post the quickest rise with a 15.05% CAGR due to their balance of data control and cloud scalability.
Why are SMEs adopting these platforms rapidly?
Subscription pricing, quick onboarding, and pre-built templates eliminate the infrastructure and expertise barriers that once limited SME access.
How does AI improve project health monitoring?
AI engines parse historical data and real-time signals to assign risk scores, predict schedule slips, and recommend corrective staffing actions.
What restrains broader adoption in regulated industries?
Heightened security and privacy requirements plus data-sovereignty rules compel cautious, often hybrid, deployment strategies.
Who are the leading vendors in this space?
Microsoft, Oracle, SAP, Atlassian, Smartsheet, and monday.com lead, with newcomers specializing in AI-driven features and industry-specific compliance modules.