
Cloud Information Technology Service Management (ITSM) Market Size and Share
Market Overview
| Study Period | 2020 - 2031 |
|---|---|
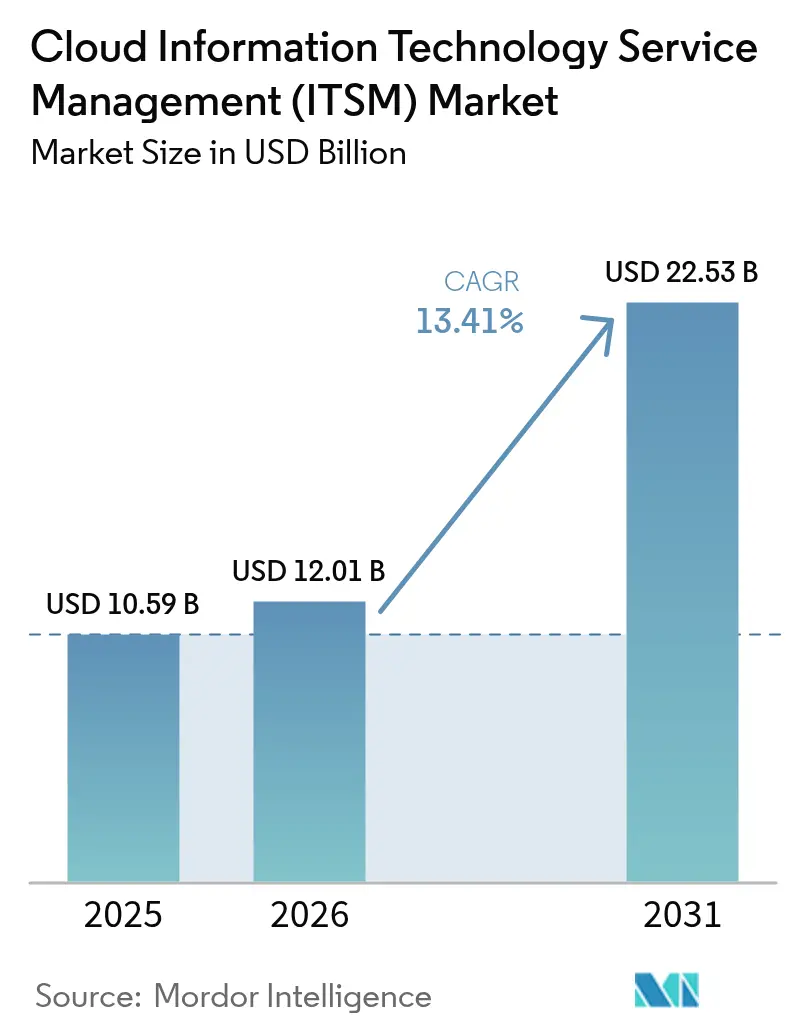
| Market Size (2026) | USD 12.01 Billion |
| Market Size (2031) | USD 22.53 Billion |
| Growth Rate (2026 - 2031) | 13.41% CAGR |
| Fastest Growing Market | Asia Pacific |
| Largest Market | North America |
| Market Concentration | Medium |
Major Players_Market_Major_Players_Logo.webp) *Disclaimer: Major Players sorted in no particular order Image © Mordor Intelligence. Reuse requires attribution under CC BY 4.0. | |
Cloud Information Technology Service Management (ITSM) Market Analysis by Mordor Intelligence
The cloud information technology service management (ITSM) market size in 2026 is estimated at USD 12.01 billion, growing from 2025 value of USD 10.59 billion with 2031 projections showing USD 22.53 billion, growing at 13.41% CAGR over 2026-2031. Steady growth reflects the enterprise's preference for subscription models that convert capital expenses into predictable operating costs, the rising adoption of AI-driven automation that cuts mean time to resolution, and a continued shift toward multi-cloud governance. Vendors are differentiating themselves through the accuracy of predictive analytics, which already delivers 99.46% precision in incident categorization, while customers insist on tighter integration with DevOps pipelines. Cost control through FinOps, data-sovereignty rules that favor regional deployments, and mounting pressure to streamline tool sprawl remain key strategic considerations for both buyers and suppliers.
Key Report Takeaways
- By component, solutions held 72.45% of the cloud information technology service management (ITSM) market share in 2025, while Services are projected to expand at a 18.65% CAGR through 2031.
- By deployment model, public Cloud retained 57.30% of the cloud information technology service management market size in 2025, whereas Hybrid Cloud is expected to exhibit the fastest growth at a 16.08% CAGR to 2031.
- By organization size, large enterprises accounted for 59.20% of the cloud information technology service management market in 2025; SMEs, on the other hand, recorded the highest CAGR of 18.22% through 2031.
- By application, network management led the cloud information technology service management market with an 17.60% share in 2025; Service Desk and Incident Management is forecast to accelerate at a 13.92% CAGR.
- By end-user vertical, IT and telecommunications accounted for a 23.70% share of the cloud information technology service management market size in 2025, while Healthcare and Life Sciences is advancing at an 17.95% CAGR.
- By geography, North America represented 39.60% of the overall cloud information technology service management market in 2025; Asia-Pacific is the fastest-growing region at 17.08% CAGR.
Note: Market size and forecast figures in this report are generated using Mordor Intelligence’s proprietary estimation framework, updated with the latest available data and insights as of 2026.
Global Cloud Information Technology Service Management (ITSM) Market Trends and Insights
Drivers Impact Analysis*
| Driver | (~) % Impact on CAGR Forecast | Geographic Relevance | Impact Timeline |
|---|---|---|---|
| Rising Demand for Multi-Cloud Service Governance Across Distributed DevOps Teams | +2.5% | Global, with concentration in North America and EU | Medium term (2-4 years) |
| Accelerated Shift to Remote and Hybrid Work Requiring ITSM Automation | +1.8% | Global, particularly APAC and North America | Short term (≤ 2 years) |
| Proliferation of ITIL 4 Adoption Among Enterprises Driving SaaS ITSM Upgrades | +2.1% | Europe and North America core, expanding to APAC | Medium term (2-4 years) |
| Integration of AI/ML for Predictive Incident Management Reducing MTTR | +1.4% | Global, led by developed markets | Long term (≥ 4 years) |
| Subscription-Based Opex Models Preferred Over Capex Especially Among SMEs | +0.9% | Global, with strong SME adoption in emerging markets | Short term (≤ 2 years) |
| Source: Mordor Intelligence | |||
Rising demand for multi-cloud governance across distributed DevOps teams
Enterprises running workloads across AWS, Microsoft Azure, and Google Cloud face escalating complexity as microservices span multiple regions and providers. Unified cloud information technology service management market platforms now offer automated discovery and dependency mapping that correlate incidents across hybrid estates, allowing DevOps teams to maintain service levels without juggling point tools.[1]ServiceNow, “Q2 2024 Earnings Release,” servicenow.com Consolidating visibility enables predictive analytics on containerized applications, reduces duplicated monitoring overhead, and provides compliance reporting that satisfies auditors evaluating cross-border data flows.
Accelerated shift to remote and hybrid work requiring ITSM automation
Permanent hybrid workforces demand always-on self-service portals and AI chatbots integrated with collaboration hubs such as Teams and Slack. Modern cloud information technology service management market platforms embed natural-language virtual agents that resolve routine tickets in seconds and escalate complex issues with full context attached, trimming support queues and enhancing employee experience.[2]ManageEngine, “Hybrid Work and IT Service Automation,” manageengine.com Predictive insights flag device failures before users are disrupted, a capability viewed as essential infrastructure for dispersed operations.
Proliferation of ITIL 4 adoption driving SaaS ITSM upgrades
The ITIL 4 framework emphasizes value streams, Agile alignment, and end-to-end service orchestration. Organizations therefore migrate from legacy on-prem tools to cloud architectures that natively support the four-dimensions model and built-in continual improvement practices. Vendors respond with configurable workflows, low-code automation, and pre-built integrations that enable rapid compliance without heavy custom code.
Integration of AI/ML for predictive incident management
Machine-learning models analyze historical tickets, performance telemetry, and environmental variables to detect anomalies hours before users notice degradation. Early warning allows automated remediation scripts to execute, halving mean time to resolution and boosting customer satisfaction scores.[3]Virtana, “Predictive AIOps for Hybrid Clouds,” virtana.com Advanced NLP extracts resolution steps from unstructured notes, guiding first-level agents and increasing knowledge-base utilization.
Restraints Impact Analysis*
| Restraint | (~) % Impact on CAGR Forecast | Geographic Relevance | Impact Timeline |
|---|---|---|---|
| Data Residency Regulations Limiting Cross-Border Incident Data Flow | -1.2% | EU, APAC (particularly China, South Korea), emerging in other regions | Medium term (2-4 years) |
| Legacy Tool Sprawl Hindering Unified CMDB Migration to Cloud | -0.8% | Global, with higher impact in mature markets with established IT infrastructure | Long term (≥ 4 years) |
| Visibility Gaps in Highly Containerised Micro-services Environments | -1.1% | Global, concentrated in technology-forward organizations and cloud-native companies | Medium term (2-4 years) |
| Rising Cloud Opex Costs Triggering FinOps Scrutiny and Renewal Delays | -0.7% | Global, particularly impacting cost-sensitive SMEs and budget-constrained enterprises | Short term (≤ 2 years) |
| Source: Mordor Intelligence | |||
Data residency regulations limiting cross-border incident data flow
Frameworks such as the EU’s Digital Operational Resilience Act and South Korea’s data sovereignty mandates require local storage of incident logs that may contain personal information, constraining central analytics and forcing cloud information technology service management market vendors to build regional data centers.[4]Cryptomathic, “Digital Operational Resilience Act Becomes Effective,” cryptomathic.com Multinationals deploy separate instances to comply, which increases operational costs and fragments global dashboards.
Legacy tool sprawl hindering unified CMDB migration to cloud
Large enterprises often maintain dozens of monitoring utilities accumulated over many years. Harmonizing asset records, deleting duplicates, and mapping dependencies slows transitions to a single cloud information technology service management market platform. Extended dual-run periods and custom connector development inflate migration budgets and postpone ROI.
*Our forecasts treat driver/restraint impacts as directional, not additive. The impact forecasts reflect baseline growth, mix effects, and variable interactions.
Segment Analysis
By Component: Solutions dominate despite services acceleration
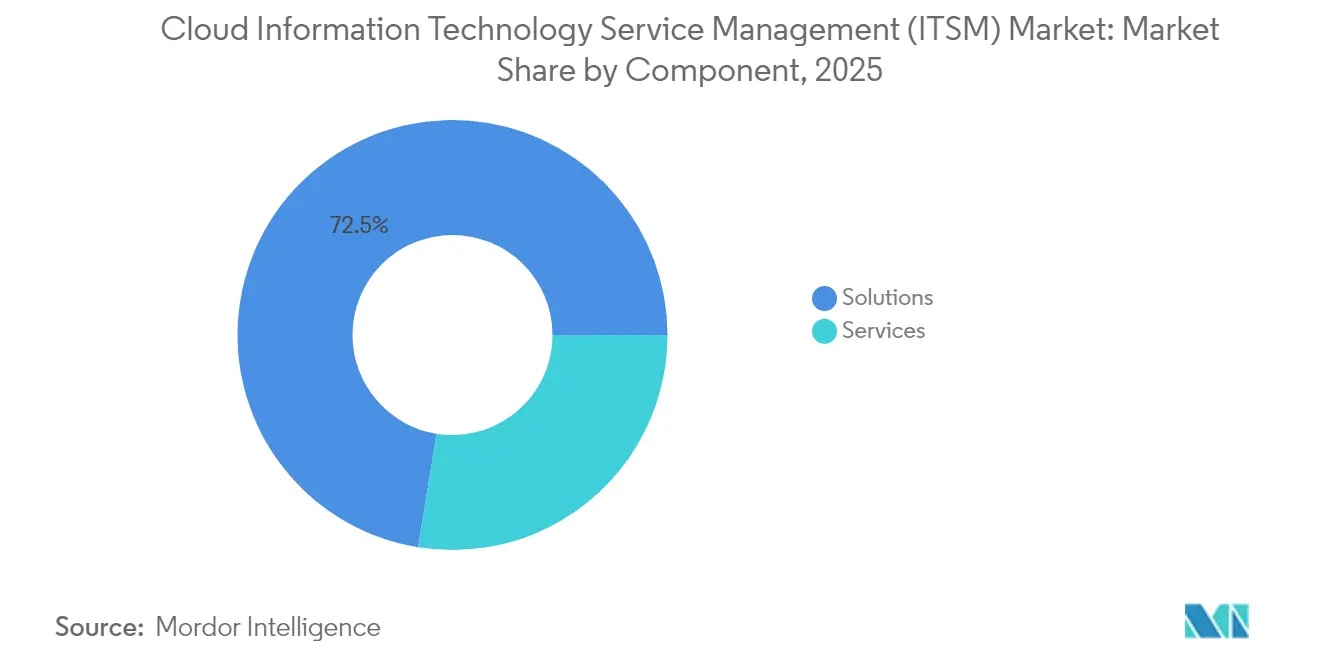
Solutions captured 72.45% of the cloud information technology service management market share in 2025, reflecting customers priority to secure a robust platform foundation. Subscription revenues at vendors such as ServiceNow surpassed USD 2.5 billion in Q2 2024, illustrating demand for AI automation modules, workflow engines, and low-code app builders.
Services revenue is climbing at 18.65% CAGR as enterprises realize the transformation effort required to configure intelligent routing, federate CMDBs, and embed DevOps pipelines. Managed providers now offer outcome-based agreements tied to MTTR and Net Promoter Scores, transferring operational risk and assuring value delivery.


By Deployment Model: Hybrid cloud gains momentum
The public cloud is expected to represent 57.30% of the cloud information technology service management market size in 2025, driven by rapid provisioning and lower infrastructure overhead. Yet, Hybrid cloud is rising at a 16.08% CAGR because regulated sectors keep sensitive data on private nodes while exploiting public-cloud AI engines for analytics.
A hybrid stance also mitigates vendor lock-in: organizations can redirect workloads if pricing or performance shifts. Vendors, therefore, invest in portable architectures that synchronize policies across environments and respect locality constraints without duplicating administrative effort.
By Organization Size: SME adoption accelerates
Large Enterprises command 59.20% of current spending, thanks to intricate estates requiring advanced governance. However, SME uptake is expanding at an 18.22% CAGR, as low-cost subscriptions and turnkey integrations remove barriers to entry. Research shows that SMEs can cut operating costs by 20% and increase customer satisfaction by 15% after deploying cloud-based information technology service management industry solutions that automate ticket triage.
New entrants prefer all-inclusive bundles that bundle endpoint management, observability, and self-service know-how out of the box, allowing lean IT teams to focus on strategic initiatives instead of basic upkeep.
By Application: Service desk transformation drives growth
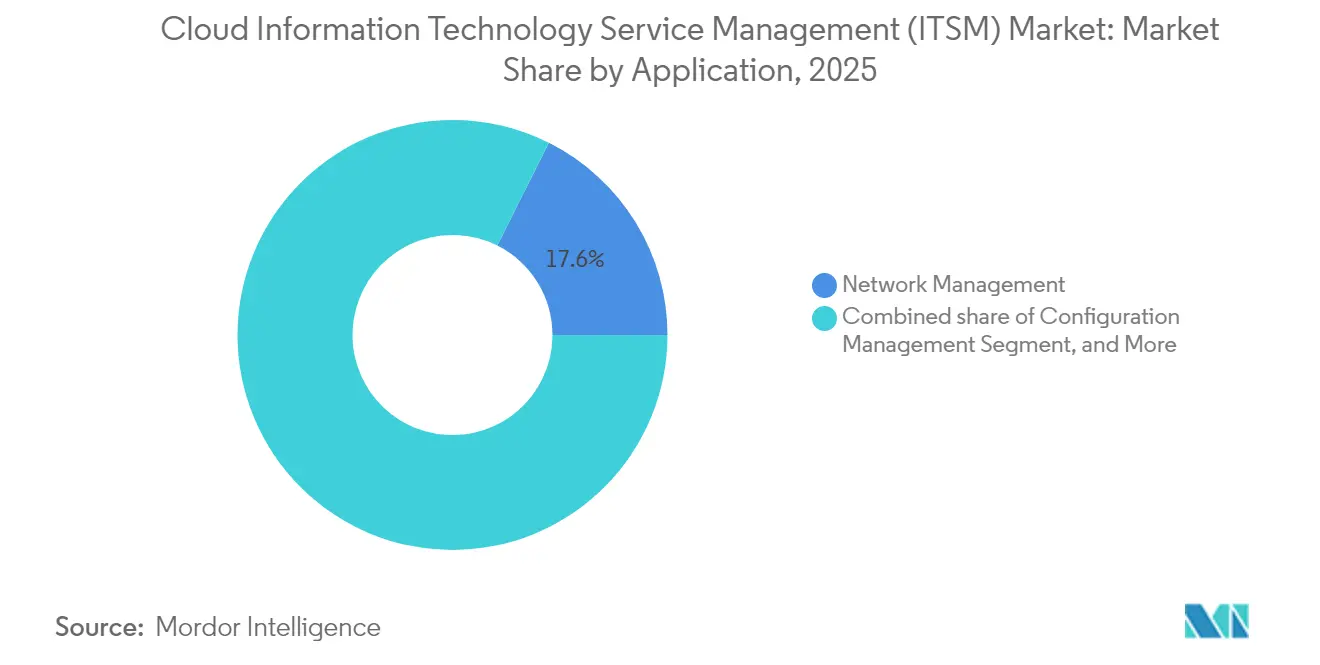
Network Management retained an 17.60% slice of the cloud information technology service management market in 2025, ensuring holistic visibility across multi-cloud networking layers. However, Service Desk and Incident Management is forecast to grow the fastest at 13.92% CAGR as conversational AI, dynamic knowledge surfacing, and intelligent routing redefine end-user support experiences.
Automated problem clustering links symptoms across microservices, expediting root cause isolation and surfacing impact analysis for stakeholders in minutes rather than hours.
By End-user Vertical: Healthcare leads digital transformation
IT and Telecommunications held 23.70% of 2025 revenue, mirroring tech firms’ appetite for continual innovation and superior customer SLAs. Conversely, Healthcare and Life Sciences exhibits an 17.95% CAGR, driven by HIPAA-aligned workflows, medical device inventories, and protected health information encryption requirements.
Specialty templates now embed compliance checkpoints, audit trails, and patient data segregation as standard features, lowering validation effort and accelerating go-live schedules for hospital systems modernizing clinical service desks.
Geography Analysis
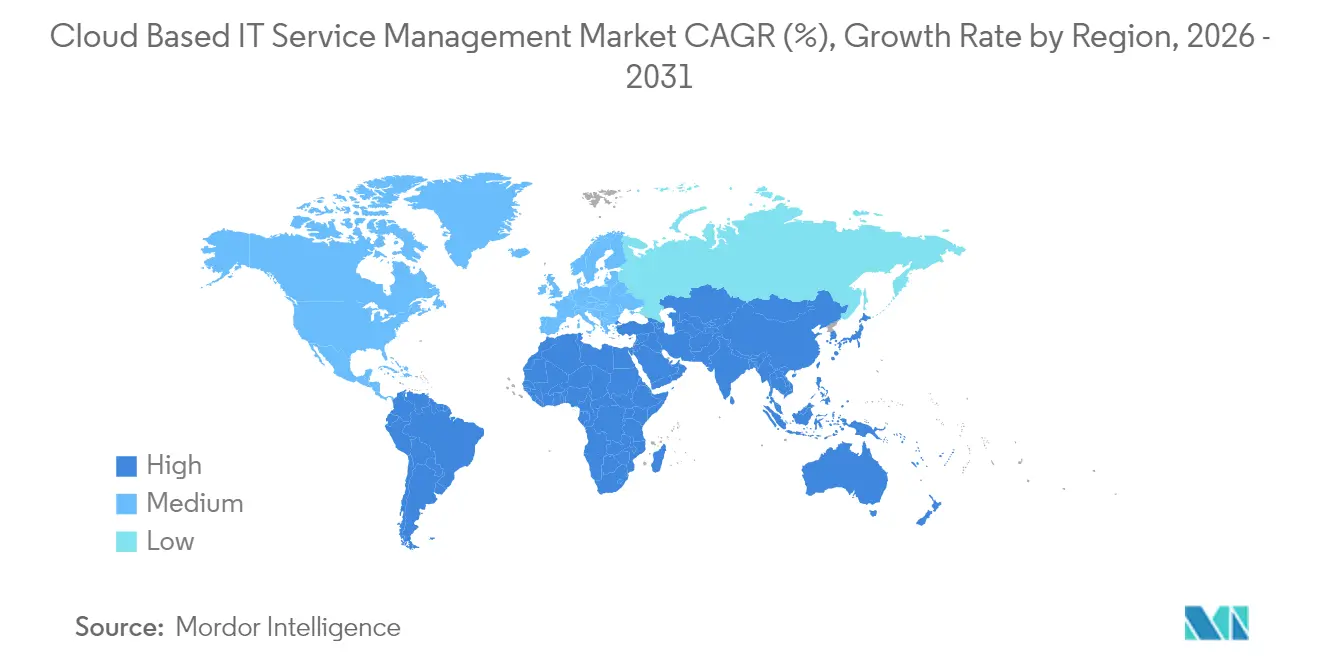
North America contributed 39.60% of total spending in 2025, enabled by deep cloud adoption, readily available AI skills, and active partnership ecosystems between hyperscalers and platform providers. Enterprises monitor cloud bills more closely and pursue FinOps governance to validate the business value of expansions. Investment continues where automation yields measurable productivity gains, particularly in highly competitive service industries.
The Asia-Pacific region is the fastest-growing region, with a 17.08% CAGR through 2031. National digital agendas in South Korea and Singapore incentivize local data centers, while businesses adopt cloud information technology service management market platforms to comply with data residency mandates. Atlassian’s decision to offer Seoul-hosted Jira Service Management illustrates the vendor's response to country-specific rules. Rapid SME formation in India and Indonesia also contributes to the growth in volume.
Europe expands at a steady pace, shaped by GDPR and, from 2025, DORA for finance. Organizations prefer suppliers offering strong encryption, granular audit logs, and documented breach-notification workflows. Middle East and Africa join the adoption curve as government entities pursue smart-city ambitions and require resilient IT backbones. Latin America follows with moderate, cost-sensitive uptake, favoring lighter bundles that address essential incident tracking and knowledge management.

Regulatory Landscape
Cloud ITSM purchasing and deployment are shaped by evolving cloud-security and service-management requirements that affect where incident data can be stored and how controls are audited. In the United States, OMB Memorandum M-25-04 (January 2025) reinforced federal expectations around security and privacy management, including zero trust emphasis. Defense-related cloud use cases continue to be governed through DFARS 252.239-7010 clauses for cloud computing services. FedRAMP also advanced its 2026 Consolidated Rules and agency-use requirements (public-preview materials for 2026), pushing providers and integrators to operationalize continuous monitoring and produce more repeatable authorization artifacts for government-aligned workloads.
In Europe, compliance alignment increasingly links ITSM workflows to cloud assurance frameworks and audit evidence. Germany's Federal Office for Information Security (BSI) released C5:2026, aligning cloud-control expectations with initiatives such as EUCS (Substantial) and with references to NIS2 and ISO/IEC 27001:2022, which raises the bar for cloud-hosted service management in regulated environments. Standards updates also affect process governance, as ISO/IEC 20000-1:2018/Amd 1:2024 added climate-action related changes to service management system requirements, reinforcing the need for documented, auditable service practices that cloud ITSM tooling and reporting can support.
Value Chain Analysis
The cloud ITSM value chain begins with hyperscale and regional cloud infrastructure (compute, storage, networking, identity) and extends to platform vendors that deliver ITSM workflows, service catalogs, CMDB and asset discovery, automation, and analytics. The surrounding partner layer includes observability and AIOps vendors, integration and workflow marketplaces, MSPs, and global and regional system integrators that support migration, configuration, and managed operations.
Recent product moves show vendors bundling adjacent layers to reduce customer integration burden: Freshworks introduced AI Agent Studio in Freshservice (May 2026) to govern AI-based service delivery across ITSM, ITAM, and ITOM, and Salesforce reported early adoption of Agentforce IT Service (February 2026), positioning a Slack-first, agentic AI interface as part of the delivery layer. Downstream, direct enterprise sales dominate for large accounts, cloud marketplaces support faster procurement, and partners lead delivery for mid-market and regulated deployments. Implementation services, managed services, and security and compliance validation remain key value-capture points because unified service management relies on accurate discovery, data normalization, and integration with DevOps and monitoring tools. ConnectWise also reinforced the partner role in outcome packaging, as it launched the general availability of the ConnectWise Platform (July 2026), integrating PSA, RMM, and AI agents for SMEs and distributed IT environments.
Competitive Landscape
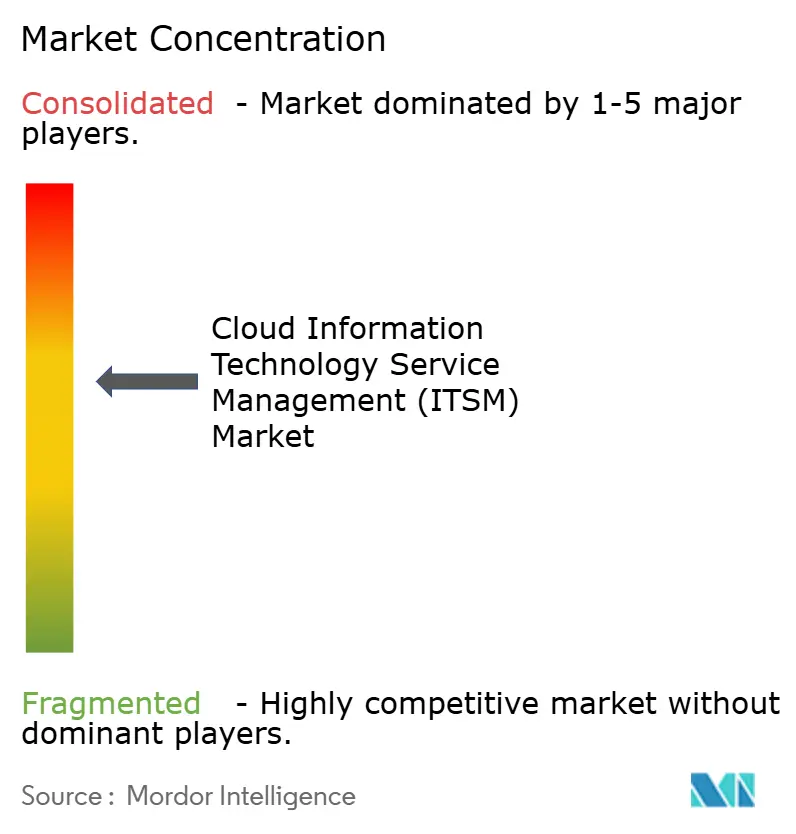
The cloud information technology service management market shows moderate concentration. ServiceNow leads with a broad Now Platform, achieving a 23% quarterly subscription growth, and strategic alliances that embed its workflows into Microsoft Copilot and Nvidia AI models. Microsoft, IBM, and Oracle cross-sell ITSM modules into existing infrastructure footprints, strengthening stickiness.
Atlassian targets mid-market and agile teams, posting USD 4.4 billion FY 2024 revenue on the strength of Jira Service Management and integrated DevOps toolchains. Freshworks, BMC, and Ivanti differentiate on rapid deployment, vertical templates, or outcome-priced managed services. Emerging vendors compete on niche regulatory expertise and domain-specific data models that incumbents lack.
Competitive advantages are increasingly based on embedded AI accuracy, open integration frameworks, and proof points that link platform usage to quantifiable operational outcomes. Providers invest in low-code customization and marketplace ecosystems to reduce the total cost of ownership and shorten the time to value for customers shifting from legacy landscapes.
Cloud Information Technology Service Management (ITSM) Industry Leaders
IBM Corporation
BMC Software Inc.
Micro Focus International PLC
ASG Technologies Group, Inc.
Atlassian Corporation Plc
- *Disclaimer: Major Players sorted in no particular order

Market Opportunities and Future Outlook
One visible opportunity area is platform consolidation across ITSM, IT operations management, and asset management to reduce tool sprawl and improve governance across hybrid and multi-cloud estates. Vendors are building connective tissue between service workflows and operational telemetry, including the multiyear Dynatrace and ServiceNow collaboration announced in October 2025, which aims to integrate AI-driven observability with ServiceNow ITSM and AIOps for autonomous operations use cases. For buyers, the focus is on faster incident correlation and standardized runbooks across distributed DevOps teams, without maintaining disconnected point tools.
Regulated and data-sovereignty constrained deployments also continue to create demand for regional hosting options, auditable workflow controls, and automated compliance evidence. The compliance environment spanning 2025 and 2026, including DORA in Europe from 2025 and the release of BSI C5:2026, aligns with demand for ITSM platforms that provide granular audit trails, segregation of duties, and locality-aware data handling. Alongside that, agentic AI packaging and governance has become a competitive lever as suppliers move beyond pilots into controlled, production-scale deployments, reflected in Freshworks AI Agent Studio (May 2026) and broader efforts to formalize AI control and workflow guardrails for IT service delivery.
Recent Industry Developments
- July 2026: BMC announced new capabilities to extend governed AI agents and assistants across hybrid enterprise workflows, including integrations tied to Control-M and major ecosystem tools. The release supports broader automation of service and operations processes while keeping governance and policy controls in view for large and regulated customers.
- June 2026: IBM and ServiceNow expanded their collaboration to integrate IBM AI, data, and automation capabilities with the ServiceNow AI Platform, including work around Workflow Data Fabric and watsonx.data. The partnership targets reduction of data silos that can block autonomous operations, strengthening end-to-end service workflows across legacy and cloud estates.
- February 2026: BMC signed a five-year strategic collaboration agreement with AWS to host the Control-M SaaS platform and accelerate intelligent automation delivery. This adds scale and cloud-infrastructure leverage for BMC's SaaS automation footprint, reinforcing the shift toward subscription delivery for operations and service management tooling.


Research Methodology Framework and Report Scope
Market Definition and Coverage
For this study, the market covers cloud-delivered IT service management tools and the related vendor-provided services that help organizations plan, run, and improve IT services. Revenues are measured from end-user spending.
Scope exclusions: We exclude on-premises-only ITSM suites, custom one-off consulting projects, and stand-alone DevOps tools that do not function as ITSM.
Segmentation Overview
- By Component
- Solutions
- Services
- By Deployment Model
- Public Cloud
- Private Cloud
- Hybrid Cloud
- By Organization Size
- Large Enterprises
- Small and Medium Enterprises (SMEs)
- By Application
- Configuration Management
- Performance Management
- Network Management
- Database Management
- Service Desk and Incident Management
- Problem Management
- Other Applications
- By End-user Vertical
- IT and Telecom
- BFSI
- Retail and Consumer Goods
- Healthcare and Life Sciences
- Manufacturing
- Government and Public Sector
- Education
- Other End-user Verticals
- By Geography
- North America
- United States
- Canada
- Mexico
- Europe
- United Kingdom
- Germany
- France
- Italy
- Spain
- Rest of Europe
- Asia-Pacific
- China
- Japan
- India
- South Korea
- Rest of Asia-Pacific
- South America
- Brazil
- Argentina
- Chile
- Rest of South America
- Middle East
- Saudi Arabia
- United Arab Emirates
- Qatar
- Turkey
- Rest of Middle East
- Africa
- South Africa
- Egypt
- Nigeria
- Kenya
- Rest of Africa
- North America
Data Sources, Market Sizing, and Validation
Desk Research
We start by building a view of addressable demand using public signals that can be re-checked later. Typical inputs include releases and datasets such as the US Bureau of Labor Statistics for IT employment trends, US SEC filings for company disclosures, OECD digital economy indicators, Eurostat ICT usage statistics, and ITIL guidance material from AXELOS.
Next, we ground the model using vendor annual reports, earnings call transcripts, product documentation, and credible press coverage that reflects pricing moves and module bundling changes. Where needed, we use a paid subscription for company financials and news intelligence, plus a patent database, to keep product scope mapping consistent across vendors and time. The desk sources listed here are not exhaustive, and we reviewed other public documents to support data collection, validation, and scope clarification.
Primary Interviews and Surveys
Our primary work focuses on validating what buyers adopt and pay for, and how cloud ITSM spend is split between core modules, add-ons, and support. We speak with enterprise IT leaders, service desk owners, MSPs, and implementation partners across major regions, so assumptions on renewal uplift, discounting, and migration timing can be stress-tested before the model is finalized.
Distribution of primary research fieldwork respondents
| Company type | Respondent position | Region |
|---|---|---|
| Top tier: 35% | CXOs: 14% | APAC: 40% |
| Mid tier: 51% | Functional/Unit leaders: 39% | EMEA: 36% |
| Smaller Players: 14% | Managers: 47% | Americas: 24% |
Market-Sizing & Forecasting
The sizing starts with a top-down build where cloud ITSM demand is reconstructed from enterprise IT spending patterns, cloud adoption in IT operations, and the share of service management workflows managed through subscription platforms. After we form the first total, we cross-check it with selective bottom-up checks, including sampled vendor revenue splits, typical subscription ASPs by seat or agent count, and volume proxies such as IT staff counts and ticketing intensity.
Key model inputs we track include migration pace from on-prem to SaaS ITSM, average contract term and renewal uplift, discounting and bundling of modules, growth in managed services attached to ITSM, and regional enterprise cloud maturity that affects adoption timing. Where vendor disclosures do not cleanly separate cloud ITSM from adjacent categories, we apply a documented allocation rule and then revisit it with partner and buyer feedback.
For forecasting, we use scenario analysis supported by a multivariate relationship between cloud adoption indicators, IT headcount growth, and expected subscription price progression. The final forecast is adjusted only after primary inputs confirm what is realistic for renewal cycles and procurement behavior.
Data Validation & Update Cycle
We validate outputs through multiple checks so the total remains aligned with real-world signals. We compare the model totals against vendor growth commentary, contract and renewal patterns, and region-level cloud spend direction, then investigate any outliers that do not match these indicators.
Before sign-off, an analyst reviews assumptions and calculations step by step, and sources are re-checked when a variance is larger than expected. The report is refreshed annually, and interim updates are made when material events occur, after which respondents may be re-contacted to confirm the impact. Right before delivery, we do a final fresh pass so clients receive the latest updated view.
Mordor Intelligence's Cloud Information Technology Service Management Itsm Market Size Versus Other Published Estimates
Published market numbers for cloud ITSM can differ sharply, even when the labels sound the same, because the scope boundary and pricing logic are applied differently. Variations usually show up around what is counted as cloud, how modules and add-ons are bundled, and whether services are included as part of the spend.
The spread is also influenced by refresh timing and how currency conversion is handled when contracts are renewed across regions, which shifts the same-year USD total. By re-checking subscription ASP movement, discounting, and renewal timing close to publication, and then running variance checks against cloud adoption signals, the estimate stays anchored to a repeatable spend view used by Mordor Intelligence.
Benchmark comparison
| Source | Market Size | Gaps in Research Methodology |
|---|---|---|
| Mordor Intelligence | USD 12.01 B (2026) | |
| Trade Journal B | USD 9.50 B (2024) | Uses an earlier base year and tends to lean on list pricing and headline seat rates, which can understate discounting and the timing of renewal uplifts in subscriptions. |
| Industry Report A | USD 8.90 B (2024) | Applies a broader definition across IT operations tooling and then projects forward with aggressive growth, which can mix adjacent spend that is not tied to ITSM workflow adoption. |
Overall, the biggest differences come from year alignment and what gets counted inside the cloud ITSM spend box. When scope rules, ASP progression, and currency timing are stated clearly and checked with buyer and partner feedback, the resulting market size is easier to trace and re-create for planning.


Key Questions Answered in the Report
What is the current size of the cloud information technology service management market?
The market is valued at USD 12.01 billion in 2026 and is projected to reach USD 22.53 billion by 2031.
Which deployment model is growing fastest?
Hybrid cloud deployments show the highest growth, expanding at a 16.08% CAGR as firms balance compliance and scalability.
Why are SMEs adopting cloud information technology service management platforms rapidly?
Subscription pricing removes large upfront costs, while turnkey automation cuts operating expense by up to 20% and boosts customer satisfaction.
How do data residency laws impact vendor selection?
Enterprises operating in regions such as the EU and South Korea require vendors with local data centers or sovereign-cloud options to stay compliant.
Which application area offers the greatest growth opportunity?
Service Desk & Incident Management, driven by AI-powered virtual agents and predictive triage, is expected to grow at 13.92% CAGR.
What role does AI play in modern ITSM platforms?
AI enables predictive incident detection, automated categorization with 99% precision, and contextual knowledge recommendations that dramatically reduce mean time to resolution.
Page last updated on:






