Cloud Gaming Market Size and Share
Market Overview
| Study Period | 2020 - 2031 |
|---|---|
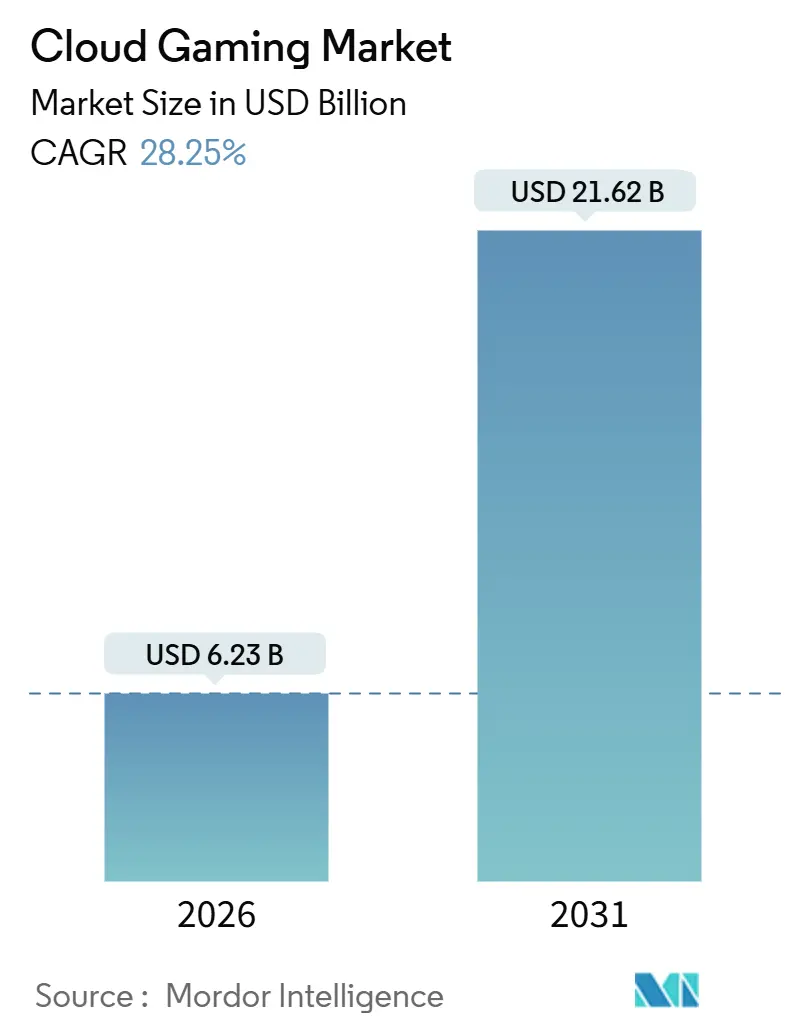
| Market Size (2026) | USD 6.23 Billion |
| Market Size (2031) | USD 21.62 Billion |
| Growth Rate (2026 - 2031) | 28.25% CAGR |
| Fastest Growing Market | Middle East and Africa |
| Largest Market | Asia Pacific |
| Market Concentration | Medium |
Major Players *Disclaimer: Major Players sorted in no particular order Image © Mordor Intelligence. Reuse requires attribution under CC BY 4.0. | |
Cloud Gaming Market Analysis by Mordor Intelligence
The cloud gaming market size stood at USD 6.23 billion in 2026 and is projected to reach USD 21.62 billion by 2031, reflecting a robust 28.25% CAGR. Rapid 5G and edge rollouts, publisher adoption of cloud-first releases, and generative AI compression have combined to push average round-trip latency below the 20-millisecond threshold in many metro areas, enabling premium gameplay on low-power devices. Platform holders are expanding regionally. Microsoft launched Xbox Cloud Gaming in India, Brazil, and Argentina in late 2025, while Sony launched PlayStation Portal streaming across 30 countries, illustrating a strategic shift toward geographic diversification. Telcos are bundling services to lift average revenue per user, and Asia Pacific remains the largest regional contributor, buoyed by Reliance Jio and Tencent initiatives.
Key Report Takeaways
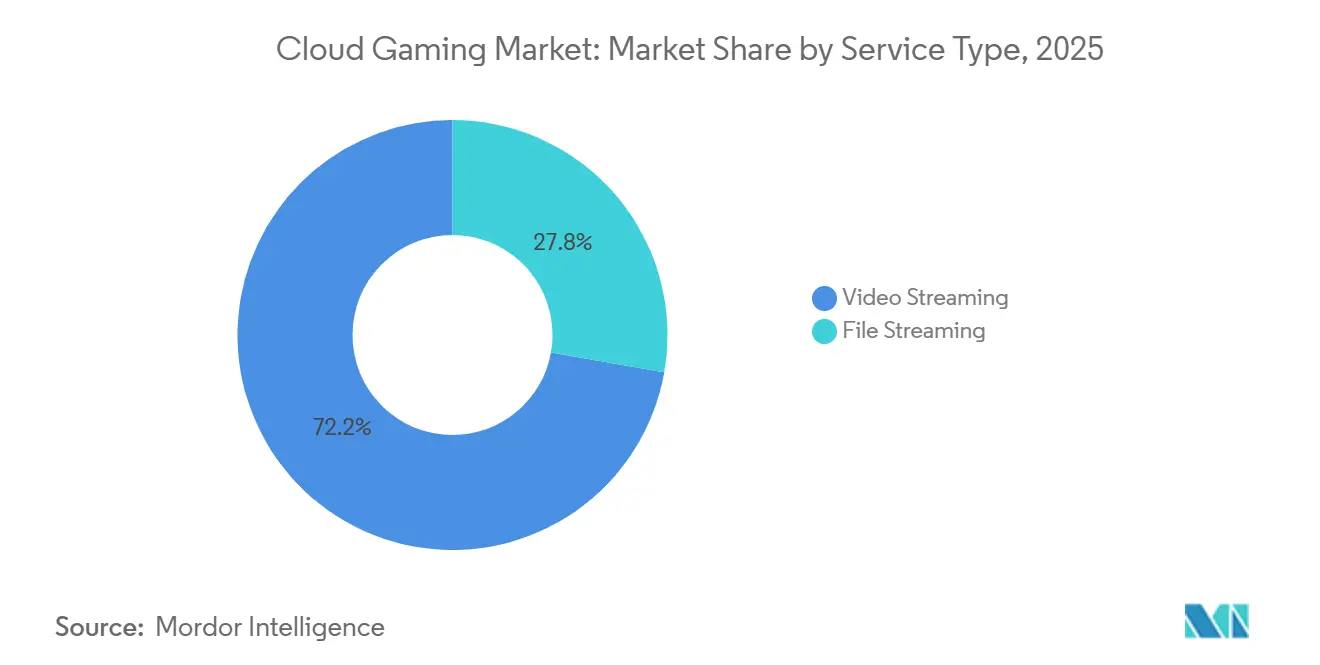
- By service type, video streaming led with 72.22% revenue share in 2025, while file streaming is advancing at a 28.71% CAGR through 2031.
- By device, smartphones held 46.12% of the cloud gaming market share in 2025, whereas tablets are forecast to expand at a 28.61% CAGR to 2031.
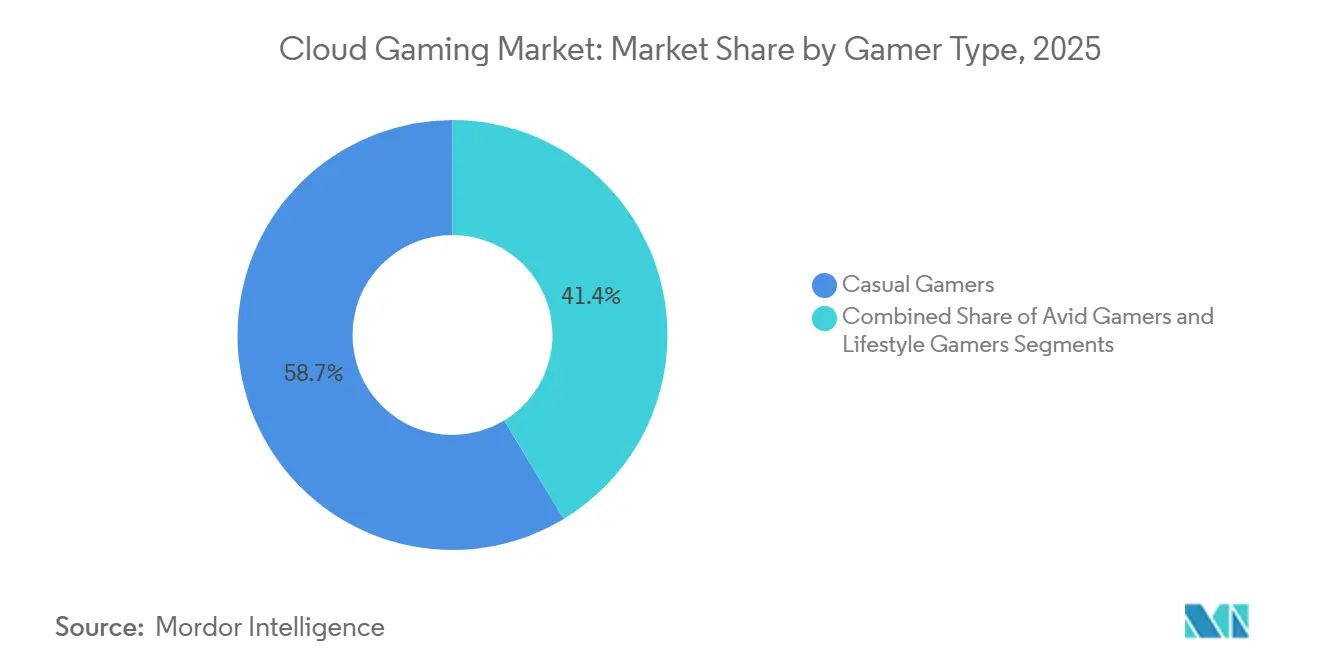
- By gamer type, casual gamers accounted for 58.65% of the cloud gaming market size in 2025, and lifestyle gamers are tracking a 29.01% CAGR into 2031.
- By business model, subscription plans captured 64.83% of revenue in 2025; free-to-play and ad-supported tiers are set to grow at a 29.15% CAGR through 2031.
- By geography, Asia Pacific commanded 38.45% of the cloud gaming market share in 2025, while the Middle East and Africa represent the fastest-growing region at a 29.35% CAGR through 2031.
Note: Market size and forecast figures in this report are generated using Mordor Intelligence’s proprietary estimation framework, updated with the latest available data and insights as of January 2026.
Market Trends and Insights
Drivers Impact Analysis of Cloud Gaming Market*
| Driver | (~) % Impact on CAGR Forecast | Geographic Relevance | Impact Timeline |
|---|---|---|---|
| 5G and edge roll-outs unlocking low-latency gameplay | +6.2% | Asia Pacific, North America | Medium term (2-4 years) |
| AAA publishers adopting cloud-first distribution | +5.8% | Global | Medium term (2-4 years) |
| Telco gaming bundles monetizing mobile data plans | +4.5% | Asia Pacific, the Middle East and Africa, and South America | Short term (≤ 2 years) |
| Generative-AI compression cuts bandwidth costs | +3.9% | Global | Long term (≥ 4 years) |
| Growth of cross-platform and device-agnostic gaming | +3.2% | Global | Medium term (2-4 years) |
| Increasing penetration of smart TVs and connected devices | +2.7% | North America, Europe, Asia Pacific | Short term (≤ 2 years) |
| Source: Mordor Intelligence | |||


5G and Edge Roll-outs Unlocking Low-Latency Gameplay
Multi-access edge computing nodes now place rendering servers within city limits, letting carriers deliver sub-15-millisecond round-trip times for titles such as Forza Horizon 5. Verizon’s partnership with AWS Wavelength in the United States and Bridge Alliance’s unified edge platform across Southeast Asia have proved that reducing backhaul hops immediately boosts session quality.[1]Verizon Editorial Staff, “5G Edge Computing Solutions,” Verizon, verizon.com GSMA Intelligence counted more than 1.2 billion 5G connections in the Asia Pacific in 2025, while Ericsson ConsumerLab reported that 68% of cloud gamers rank latency as the single most important satisfaction driver. Together, these factors convert casual mobile users into paying subscribers, particularly in bandwidth-intensive genres such as battle royales and racing simulators.
AAA Publishers Adopting Cloud-First Distribution
Publishers are launching marquee franchises simultaneously on cloud and traditional consoles to reach non-console owners. At GDC 2025, Microsoft revealed 140 million cumulative streaming hours, with over one-third of those coming from devices unable to run the content locally. Ubisoft and Tencent created a EUR 4 billion (USD 4.28 billion) subsidiary to push Assassin’s Creed and Rainbow Six directly to cloud players in Asia, bypassing physical disc sales. Amazon Luna’s multiyear pact with Electronic Arts places Star Wars Jedi: Survivor day-and-date inside the Prime bundle, cementing the expectation of instant access. Boston Consulting Group estimates that cloud-first launches widen the potential paying audience by 40%.
Telco Gaming Bundles Monetizing Mobile Data Plans
Connectivity providers are differentiating commoditized data plans by embedding premium titles. Reliance Jio offers unlimited Xbox Cloud Gaming traffic for subscribers paying INR 1,499 (USD 18) or more per month, while Zain KSA waived six months of GeForce NOW fees and increased postpaid conversions by 22%. It notes incremental monthly ARPU gains of USD 3 to USD 5, while Kearney reports an 18% reduction in subscriber churn among 18- to 34-year-olds. The model works because telcos already own last-mile infrastructure, making content bundling a low-marginal-cost upsell.
Generative-AI Compression Cutting Bandwidth Costs
SimaBit’s neural codec demonstrated 40% lower bitrates at comparable visual fidelity, reducing 1080p requirements from 15 Mbps to 9 Mbps and slashing one of the largest operating costs for smaller services. Nvidia’s RTX Video Super Resolution shifts upscaling to client devices, reducing data-center egress by 35% while still producing 1440p images. Peer-reviewed IEEE studies show transformer-based techniques surpassing the H.265 standard for motion-heavy gameplay. Over a five-year horizon, AI codecs could extend service reach into bandwidth-constrained emerging markets.
Restraints Impact Analysis of Cloud Gaming Market*
| Restraint | (~) % Impact on CAGR Forecast | Geographic Relevance | Impact Timeline |
|---|---|---|---|
| Rural latency bottlenecks in South America and Africa | -3.8% | South America, Sub-Saharan Africa | Long term (≥ 4 years) |
| High cloud-GPU rental costs are limiting indie platforms | -2.9% | Global | Medium term (2-4 years) |
| Content-licensing barriers to cross-border expansion | -1.7% | Europe | Medium term (2-4 years) |
| Data-usage caps and bandwidth restrictions | -1.4% | North America, select Asia Pacific markets | Short term (≤ 2 years) |
| Source: Mordor Intelligence | |||
Rural Latency Bottlenecks in South America and Africa
The World Bank found that only 35% of Sub-Saharan Africa had 4G access in 2024, and that median latency exceeded 80 milliseconds, making competitive titles unplayable. GSMA data shows that 5G coverage reached just 12% of South America’s population in 2025, largely confined to São Paulo, Buenos Aires, and Santiago. Brazil’s telecom regulator recorded rural fixed-broadband speeds below 10 Mbps, further limiting service quality. Infrastructure shortfalls effectively cap the cloud gaming market in vast interior regions, delaying uptake by several years.
High Cloud-GPU Rental Costs Limiting Indie Platforms
Spot pricing for Nvidia H100 GPUs on AWS and Azure averaged USD 2.50 to USD 3.00 per hour in 2025, translating to USD 1,800 per month at full utilization. CoreWeave reported gross margins of just 22% on gaming workloads, versus 35% on AI inference, steering scarce GPU capacity toward higher-margin customers. Smaller services like Shadow and Blacknut therefore impose waitlists during peak hours, eroding user satisfaction. Unless wholesale GPU prices ease or demand elasticity allows higher pay-as-you-play fees, indie platforms will struggle to scale globally.
*Our forecasts treat driver/restraint impacts as directional, not additive. The impact forecasts reflect baseline growth, mix effects, and variable interactions.
Cloud Gaming Market Segment Analysis
By Service Type:
File Streaming Gains on Install-to-Play FeaturesFile streaming captured momentum after Nvidia introduced install-to-play in September 2025, blending local asset storage with remote rendering and cutting perceived input lag to under 10 milliseconds for esports titles. Although video streaming still dominated with 72.22% of revenue in 2025, performance-sensitive gamers now gravitate toward hybrid delivery, driving a 28.71% CAGR for file streaming through 2031.
Academic work in the ACM Transactions on Graphics found 60% lower bandwidth use in static environments, validating the cost-benefit. The cloud gaming market, therefore, splits between casual players who value device agnosticism and enthusiasts who prioritize responsiveness. Install-to-play also lays the groundwork for emerging mixed-reality titles that require rapid asset swapping, expanding the overall cloud gaming market size by unlocking new content formats.

By Device:
Tablets Surge on Virtualization and PortabilityTablets are poised for a 28.61% CAGR, as Xiaomi’s WinPlay engine enables ARM-based devices to run Windows and Steam apps via virtualization, closing the content gap with PCs.[2]Xiaomi Global Communications, “WinPlay Engine Launch,” Xiaomi, mi.com Logitech sold 500,000 G Cloud handhelds in 2025, signalling pent-up demand for all-day battery life and physical controls. Smartphones will continue to contribute nearly half of 2026 revenue thanks to telco bundles, but tablets combine portability with larger screens, improving immersion for live-service games.
As vendors add detachable controllers and 144 Hz displays, the cloud gaming market share held by tablets is expected to close the gap with phones. Manufacturers are segmenting aggressively from high-refresh-rate OLED handhelds to entry-level Android slates, diversifying hardware options without fragmenting cloud infrastructure.
By Gamer Type:
Lifestyle Gamers Drive Cross-Platform AdoptionCasual users held 58.65% of 2025’s base, yet lifestyle gamers, Gen Z players who emphasize social connectivity, are expanding at 29.01% CAGR. Super Gamers in the United States spend USD 38 per month and view cloud streaming as a frictionless way to access day-one releases.
As engagement shifts from hardware ownership to continuous service access, lifestyle gamers expand the cloud gaming market by persuading publishers to maintain live-service roadmaps, thereby ensuring fresh content and ongoing microtransactions. Casual players, meanwhile, benefit from periodic free-to-play promotions, keeping funnel conversion high during seasonal events.

By Business Model:
Ad-Supported Tiers Broaden the FunnelSubscription tiers accounted for 64.83% of 2025 revenue, but Amazon Luna’s inclusion within Prime and Microsoft’s ad-supported pilot signal a pivot toward lower entry prices. Free-to-play and ad-funded offerings are projected to grow at a 29.15% CAGR, adding millions of price-sensitive users in developing markets.
This diversification stabilizes revenue by balancing predictable subscription income with the upside from advertising and microtransactions. In parallel, pay-as-you-play options such as NetEase’s RMB 1.8 (USD 0.25) per-hour service target infrequent players who balk at recurring fees. All told, a multilayered pricing ladder encourages trial, upgrades, and retention, distributing risk across different spending cohorts.
Geography Analysis
APAC Cloud Gaming Market
Asia Pacific captured 38.45% of 2025 revenue, anchored by Reliance Jio’s Xbox integration and Tencent’s EUR 1.16 billion (USD 1.24 billion) Ubisoft investment, which cements the region as a cloud-first hub. India alone added more than 800 million smartphones and is on track to become the largest gaming territory by 2033. China’s local platforms, despite foreign licensing hurdles, generated USD 1.87 billion in revenue in 2024, illustrating domestic resilience.
MEA Cloud Gaming Market
The Middle East and Africa have the fastest trajectory, with a 29.35% CAGR through 2031. Saudi Arabia’s USD 38 billion Savvy Games Group investment and the United Arab Emirates’ push to host regional studios reduced regional dependence on imported content. MTN’s Cloudplay launch and Zain KSA’s bundling of GeForce NOW show that carrier-led approaches can leapfrog console scarcity. Increased data-center capacity across Gulf states has lowered latency below 30 milliseconds, a critical threshold for multiplayer shooters.
North America and Europe Cloud Gaming Market
North America and Europe retain high revenue per user, with the United States and Germany acting as early adopters of premium subscriptions. Microsoft’s partnership with Telcel in Mexico broadens Spanish-language catalogs, while European operators must navigate content-licensing mandates arising from the Activision Blizzard decision, which fragments libraries across borders.
Mordor Intelligence provides coverage of the cloud gaming market across other key regional markets. Detailed country-level analysis extends to United States incorporating local coverage and market participation, as required.


Competitive Landscape
The sector is moderately fragmented, with Microsoft, Sony, and Nvidia anchoring platform strategies. Microsoft expanded Xbox Cloud Gaming into populous emerging markets and began testing ad-funded tiers, diversifying both geography and price points. Sony leverages exclusive first-party franchises to entrench subscribers, launching PlayStation Portal streaming across 30 countries in November 2025. Nvidia’s GeForce NOW differentiates on hardware independence and frequent GPU upgrades, introducing RTX 5080 nodes for 1440p at 120 fps.
Telcos such as Reliance Jio and Zain KSA serve as distribution gatekeepers, bundling gaming traffic with higher-tier data plans while avoiding direct content acquisition costs. Independent aggregators Shadow, Blacknut, and Boosteroid address niches like bring-your-own-storefront libraries but face margin pressure because GPU rentals absorb up to 50% of operating budgets.
Intellectual-property access remains a strategic battleground. The European Commission imposed 10-year licensing guarantees on Microsoft’s Activision assets, raising compliance complexity but improving third-party content parity.[3] Vision 2030 Secretariat, “Savvy Games Investment Overview,” Vision 2030, vision2030.gov.sa Technology differentiation focuses on proprietary codecs, AI upscaling patents, and cross-platform save states. First movers in edge nodes and generative compression gain defensible user-experience advantages that lower churn and raise switching costs.
Cloud Gaming Industry Leaders
Nvidia Corporation
Microsoft Corporation
Sony Group Corporation
Tencent Holdings Limited
Amazon.com, Inc.
- *Disclaimer: Major Players sorted in no particular order
Cloud Gaming Market Companies Covered in this Report
- Nvidia Corporation
- Microsoft Corporation
- Sony Group Corporation
- Tencent Holdings Limited
- Amazon.com, Inc.
- Alphabet Inc. (Google)
- Ubisoft Entertainment SA
- Electronic Arts Inc.
- Ubitus K.K.
- Shadow SAS
- Blacknut SAS
- Parsec Cloud Inc. (Unity Software Inc.)
- Utomik BV
- Numecent Holdings Ltd.
- Antstream Arcade Ltd.
- Vortex Cloud Gaming (RemoteMyApp Sp. z o.o.)
- Loudplay (Azerion)
- PlayGiga S.L. (Meta Platforms Inc.)
- Boosteroid Ltd.
- My.Games Cloud (VK Company Limited)

Recent Industry Developments in Cloud Gaming Market
- November 2025: Sony activated full cloud streaming for PlayStation Portal across 30 countries, unlocking 1080p visuals and 3D audio for more than 2,000 PlayStation 5 titles.
- November 2025: Microsoft expanded Xbox Cloud Gaming to India, Brazil, and Argentina via carrier bundles targeting a combined 250 million gamers.
- October 2025: Amazon Luna folded its GameNight library into Amazon Prime at no added cost, and Microsoft began piloting an ad-supported Xbox Cloud Gaming tier.
- September 2025: Nvidia upgraded GeForce NOW to RTX 5080 GPUs and introduced install-to-play functionality that balances latency and bandwidth usage.


Cloud Gaming Market Report Scope and Research Methodology
Market Definition and Coverage
Our study defines the cloud gaming market as all revenues earned when video games are rendered on remote servers and streamed either as live video or as file segments to consumer devices, so the end-user plays without local downloads or specialized hardware.
Scope Exclusions: The model omits physical console sales, discretionary in-game micro-transactions, and generic cloud infrastructure leasing unconnected to game delivery.
Segments Covered in This Report
- By Service Type
- Video Streaming
- File Streaming
- By Device
- Smartphones
- Tablets
- PCs and Laptops
- Other Devices
- By Gamer Type
- Casual Gamers
- Avid Gamers
- Lifestyle Gamers
- By Business Model
- Subscription-Based
- Pay-As-You-Play
- Free-to-Play and Ad-Supported
- Other Business Models
- By Geography
- North America
- United States
- Canada
- Mexico
- South America
- Brazil
- Argentina
- Rest of South America
- Europe
- Germany
- United Kingdom
- France
- Italy
- Spain
- Rest of Europe
- Asia Pacific
- China
- Japan
- South Korea
- India
- Australia
- New Zealand
- Rest of Asia Pacific
- Middle East and Africa
- United Arab Emirates
- Saudi Arabia
- South Africa
- Rest of Middle East and Africa
- North America
Data Sources, Market Sizing, and Validation
Primary Research
Mordor analysts interviewed cloud-platform engineers, telecom product managers, esports organizers, and indie publishers across North America, Europe, and fast-growing Asia-Pacific. These conversations clarified playable latency thresholds, churn triggers inside telco bundles, and realistic uptake curves, tightening assumptions uncovered during desk work.
Desk Research
We began by mapping the addressable user base through public datasets such as ITU broadband statistics, GSMA 5G deployment trackers, and national telecom regulator traffic reports, then blended these with trade-body insights from ESA, Korea Game Industry Association, and Japan's CESA. Company 10-Ks, telco investor decks, and technology patents accessed via Questel helped size platform fees and GPU rental trends. Subscription pricing ladders and regional ARPU signals were obtained from press releases captured in Dow Jones Factiva. The sources listed illustrate our inputs and are not exhaustive; many additional publications underpinned data checks.
Market-Sizing & Forecasting
A top-down demand pool was built from 5G subscriber counts, average monthly gaming hours, and paid adoption rates, which are then sanity checked through selective bottom-up roll-ups of active platform subscribers and sampled average service price. Core variables including smartphone install base growth, edge-server GPU costs, median downstream bandwidth, and casual to avid gamer migration drive yearly shifts. Multivariate regression couples these factors with historical uptake to forecast through 2030, while scenario analysis tests bandwidth cost shocks and regulatory shifts. Gaps in bottom-up data, such as small regional platform figures, are bridged by weighted proxies anchored to reliable traffic logs.
Data Validation & Update Cycle
Outputs pass three-layer checks: automated variance flags, peer review, and final lead analyst sign-off. Reports refresh annually, with mid-cycle updates if major events like a flagship service launch change baseline assumptions. Clients therefore receive the latest vetted view.
How Mordor Intelligence's Cloud Gaming Market Size Compares to Other Published Estimates
Published estimates often diverge because firms pick different revenue streams, forecasting windows, and refresh cadences.
Key gap drivers include studies that fold in generic compute leasing, reports that stop at consumer subscriptions, or models that simply inflate a single-year baseline without new primary inputs. By contrast, Mordor triangulates platform fees, telco bundle payouts, and ad-supported revenues, revisiting each variable every year.
Benchmark comparison
| Market Size | Anonymized source | Primary gap driver |
|---|---|---|
| USD 5.32 B (2025) | Mordor Intelligence | |
| USD 15.74 B (2025) | Global Consultancy A | Adds hardware rental and cloud infrastructure revenues, plus an aggressive adoption scenario |
| USD 3.36 B (2025) | Industry Research Group B | Counts only direct consumer subscriptions, excluding telco and ad-supported streams |
| USD 19.45 B (2025) | Trade Journal C | Projects a 2024 baseline forward with a flat CAGR, no primary validation or regional splits |
In sum, the disciplined blend of current data sources, frequent refreshes, and dual-path modeling lets Mordor Intelligence deliver a balanced, transparent baseline that decision-makers can reproduce and trust.


Key Questions Answered in the Report
What is the current size of the cloud gaming market, and what is its forecast growth?
The market generated USD 6.23 billion in 2026 and is expected to reach USD 21.62 billion by 2031 at a 28.25% CAGR.
Which region leads revenue in cloud streaming services?
Asia Pacific commanded 38.45% of 2025 revenue, thanks to large-scale telco bundles and publisher partnerships.
Why are tablets expected to grow faster than smartphones?
ARM virtualization like Xiaomi’s WinPlay and dedicated handhelds such as Logitech G Cloud improve performance and portability, driving a 28.61% CAGR.
How are publishers monetizing cloud gaming audiences?
AAA franchises now launch cloud-first, expanding reach to non-console owners and boosting total addressable players by up to 40%.
What pricing models are most attractive to new users?
Ad-supported and free-to-play tiers, exemplified by Amazon Luna and Microsoft pilots, lower entry barriers while maintaining upgrade paths to premium subscriptions.
What limits cloud gaming adoption in rural markets?
High latency from limited 4G and 5G coverage, combined with low fixed-broadband speeds, hampers playability outside urban centers in South America and Africa.
Page last updated on:


