
Cloud Computing Market Size and Share
Market Overview
| Study Period | 2020 - 2031 |
|---|---|
| Market Size (2026) | USD 1.04 Trillion |
| Market Size (2031) | USD 2.65 Trillion |
| Growth Rate (2026 - 2031) | 20.65% CAGR |
| Fastest Growing Market | Asia-Pacific |
| Largest Market | North America |
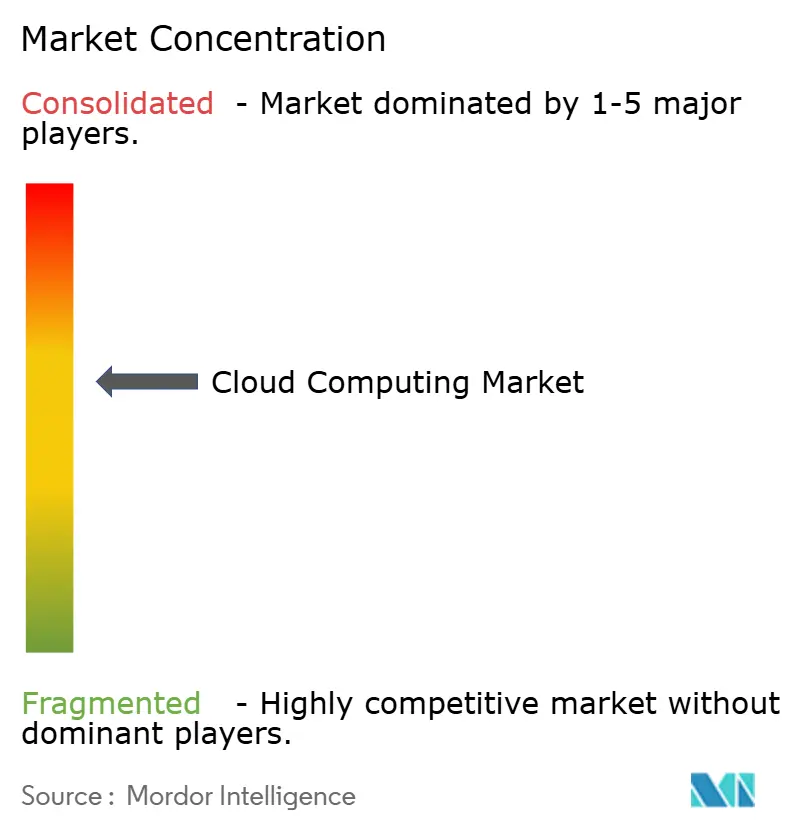
| Market Concentration | Medium |
Major Players
*Disclaimer: Major Players sorted in no particular order Image © Mordor Intelligence. Reuse requires attribution under CC BY 4.0. |
|
Cloud Computing Market Analysis by Mordor Intelligence
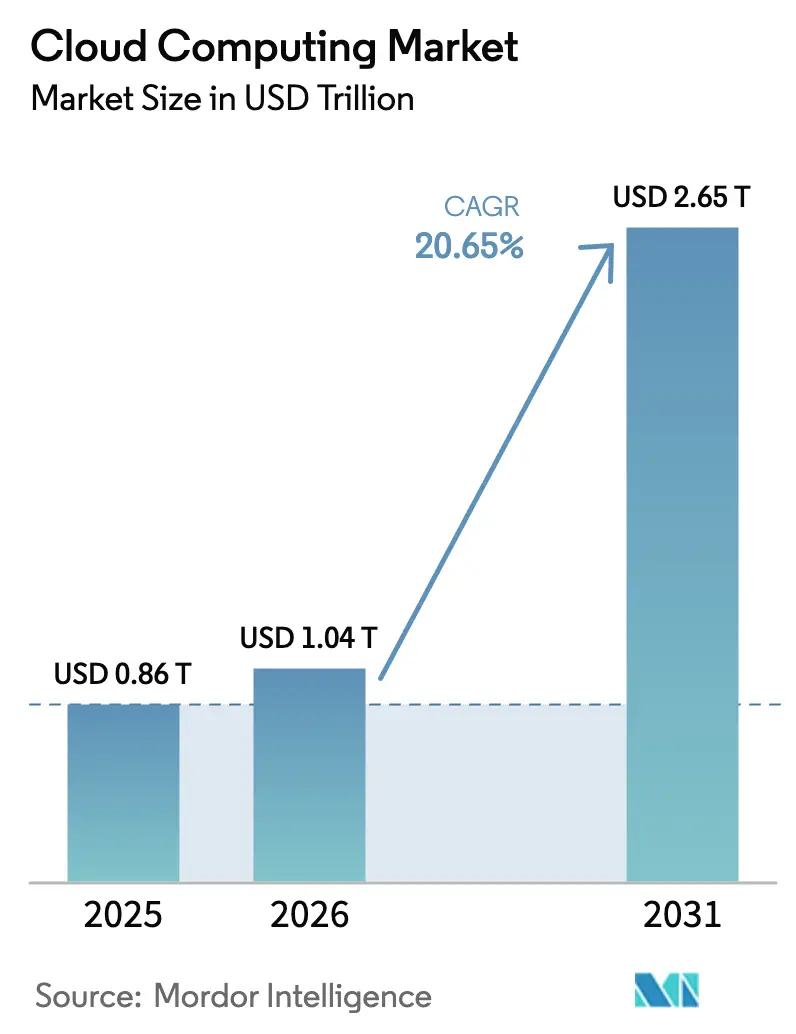
The Cloud Computing market size is expected to grow from USD 0.86 trillion in 2025 to USD 1.04 trillion in 2026 and is forecast to reach USD 2.65 trillion by 2031 at 20.65% CAGR over 2026-2031.
The surge is tied to AI-first digital‐transformation agendas, enterprise migration of core applications to Software-as-a-Service (SaaS) platforms, expanding sovereign-cloud rules in Europe and the Gulf, and the rollout of sub-10 millisecond edge-cloud zones that underpin extended-reality (XR) and autonomous-operations use cases. Hyperscale providers are therefore racing to enlarge GPU-rich data-center footprints, while industry-specific cloud blueprints simplify compliance for health, finance, and the public sector. At the same time, hybrid-cloud strategies gain prominence as enterprises seek workload portability and cost discipline. Intensifying competition among providers is pushing multi-cloud interoperability to the forefront, positioning open ecosystems over lock-in as a new source of value creation.
Key Report Takeaways
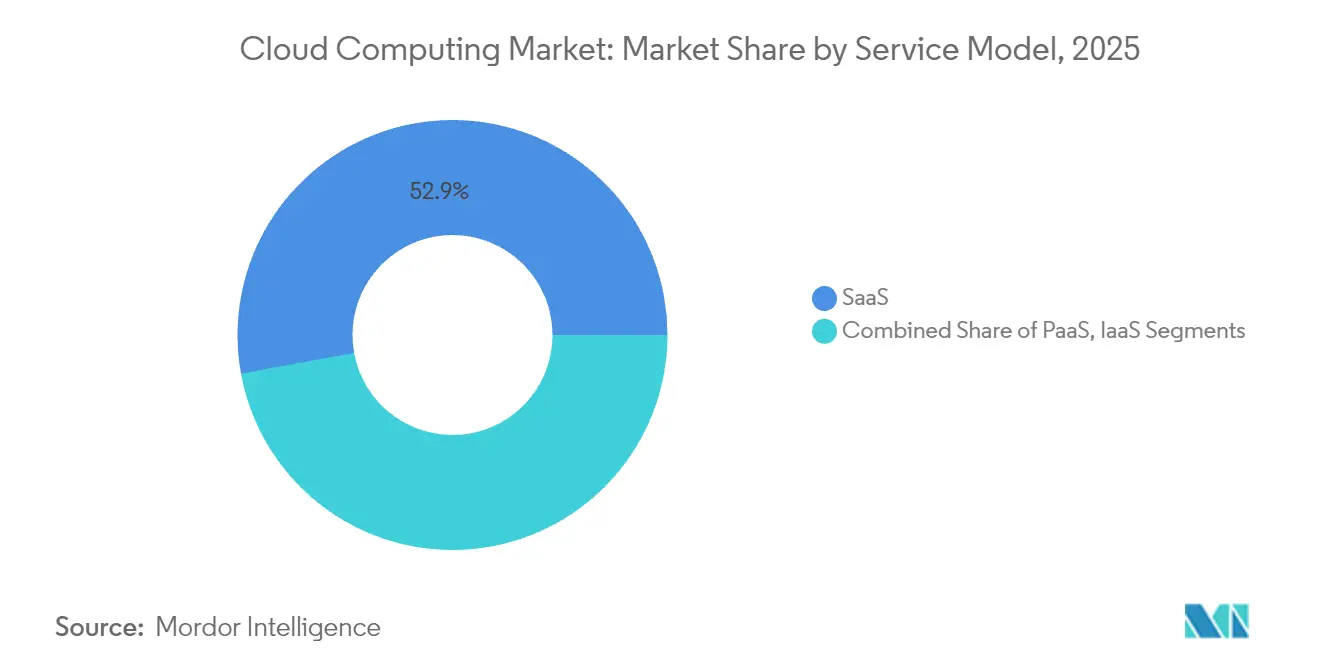
- By service model, SaaS led with 52.87% revenue share in 2025, while the Platform-as-a-Service segment is projected to advance at 22.85% CAGR to 2031.
- By deployment model, the Private-Cloud segment held 46.62% of the cloud computing market share in 2025; Hybrid-Cloud adoption is slated to expand at 22.24% CAGR through 2031.
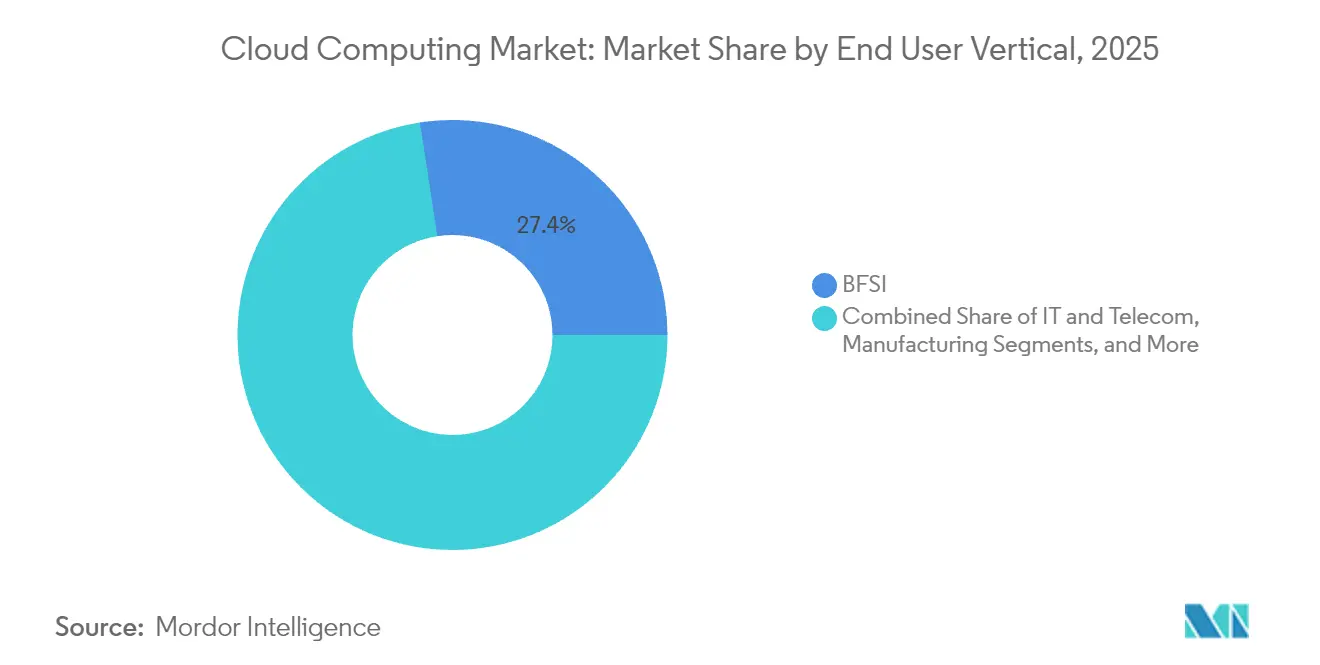
- By end-user vertical, healthcare captured 20.92% CAGR—highest among all industries—while banking, financial services, and insurance accounted for 27.42% share of the cloud computing market size in 2025.
- By Organization Size, the large enterprise segment held 53.12% of the cloud computing market share in 2025; SMEs adoption is slated to expand at 21.28% CAGR through 2031.
- By geography, North America retained 24.18% share of the 2025 cloud computing market, whereas Asia-Pacific is set to register the fastest 21.65% CAGR to 2031.
Note: Market size and forecast figures in this report are generated using Mordor Intelligence’s proprietary estimation framework, updated with the latest available data and insights as of 2026.
Global Cloud Computing Market Trends and Insights
Drivers Impact Analysis*
| Driver | (~) % Impact on CAGR Forecast | Geographic Relevance | Impact Timeline |
|---|---|---|---|
| Explosive SaaS adoption in core enterprise software | +4.20% | Global; strongest in North America and Europe | Medium term (2-4 years) |
| Proliferation of Gen-AI workloads demanding elastic compute | +5.80% | Global; concentrated in US, China, EU | Short term (≤ 2 years) |
| Industry-specific cloud platforms with compliance blueprints | +3.10% | North America and EU; expanding to Asia-Pacific | Medium term (2-4 years) |
| Sovereign-cloud mandates across EU and GCC | +2.70% | Europe and Middle East | Long term (≥ 4 years) |
| Rise of sub-10 ms edge-cloud zones for XR and autonomy | +2.90% | Asia-Pacific core; North America, selective EU | Long term (≥ 4 years) |
| Green-cloud buying linked to Scope-3 targets | +1.80% | Global; strongest in EU and North America | Medium term (2-4 years) |
| Source: Mordor Intelligence | |||
Explosive SaaS adoption in core enterprise software
Cloud migrations now encompass mission-critical enterprise-resource-planning, customer-relationship-management, and finance systems rather than only productivity workloads, a shift that is increasingly shaping the broader Cloud Computing Market. Delta Air Lines finalized a USD 500 million overhaul of its digital core in 2024, using SaaS to enable AI-driven personalization and punctuality improvements. The pivot delivers continuous feature updates and embedded analytics, unlocking real-time decision-making that on-premises software cannot match. Regulated sectors benefit from standardized compliance controls baked into SaaS stacks, accelerating audits and lowering operational overhead. Organizations delaying migration risk capability gaps and slower product cycles compared with SaaS-first peers
Proliferation of Gen-AI workloads demanding elastic compute
Large-language-model training requires thousands of high-bandwidth GPUs operating in parallel, dwarfing previous enterprise-workload footprints. Oracle reserved USD 40 billion worth of Nvidia processors for a Texas site supporting OpenAI in 2025.[1]Oracle Corp., “Oracle to Invest $40 Billion in Nvidia GPUs,” oracle.com Such scale drives radical shifts in data-center power, cooling, and network fabric design. Providers are re-architecting around AI-optimized silicon, direct-liquid cooling, and high-speed interconnects to satisfy growing demand. Customers gravitate toward vendors able to guarantee capacity and favorable economics for bursty AI experiments and production inference.
Industry-specific cloud platforms (compliance-ready blueprints)
Vertical clouds blend infrastructure with preconfigured regulatory artefacts. In healthcare, Oracle’s Clinical Digital Assistant embeds HIPAA compliance and clinical reasoning, saving clinicians 4.5 minutes per visit. Similar blueprints in finance integrate risk and fraud modules, while public-sector versions incorporate FedRAMP controls. These domain-rich clouds reduce customization time, shorten procurement cycles, and lock in specialized best practices, raising switching costs for customers once deployed.
Sovereign-cloud mandates in EU and GCC
Regulators require sensitive workloads and metadata to remain within defined borders and under local legal jurisdiction. Vendors respond with region-specific instances, citizen-cleared staffing, and audit trails that satisfy national standards. The approach preserves consistent APIs yet segregates control planes, helping enterprises comply without refactoring applications. Still, fragmented footprints diminish economies of scale and demand new investment to meet regional capacity needs.[2]European Data Protection Board (EDPB, “European Data Protection Board (EDPB) guidance on cross-border data transfer." edpb.europa.eu
Restraints Impact Analysis*
| Restraint | (~) % Impact on CAGR Forecast | Geographic Relevance | Impact Timeline |
|---|---|---|---|
| Data-localization laws fragment global footprints | −2.8% | Europe and GCC; expanding worldwide | Medium term (2-4 years) |
| Run-rate cost overruns versus on-prem TCO | −1.9% | Global; large enterprises most affected | Short term (≤ 2 years) |
| Advanced chip export controls limiting GPU supply | −2.1% | Global; strongest in China and Russia | Short term (≤ 2 years) |
| Scarcity of low-carbon power for hyperscale DCs | −1.4% | Global; high-growth regions | Long term (≥ 4 years) |
| Source: Mordor Intelligence | |||
Data-localization laws fragmenting global footprints
Jurisdiction-specific residency rules compel providers to duplicate infrastructure and create discrete logical environments, adding cost and operational complexity. Multinationals face overlapping obligations on storage, processing, and personnel access, often forcing architectural redesigns and higher service prices.[3]Amazon Sustainability, “Amazon on Path to 100 Percent Renewable Energy by 2030,” aboutamazon.com
Run-rate cost overruns vs on-prem TCO
As enterprises shift to pay-as-you-go models, unmanaged resource sprawl, premium support, and outbound-data fees erode anticipated savings. Studies show that nearly 30% of cloud spend is wasted on over-provisioned or idle assets. Effective governance, rightsizing, and FinOps capabilities are required to protect the business case.
*Our forecasts treat driver/restraint impacts as directional, not additive. The impact forecasts reflect baseline growth, mix effects, and variable interactions.
Segment Analysis
By Service Model: PaaS accelerates application velocity
Platform-as-a-Service is forecast to compound at 22.85% from 2026-2031, the quickest pace among service models. SaaS retained a commanding 52.87% of 2025 revenue, while Infrastructure-as-a-Service remains the elastic foundation underneath. The PaaS wave is fueled by container orchestration, serverless runtimes, and low-code tools that compress release cycles from months to weeks. Amazon earmarked USD 150 billion for AI-centric data centers catering to those PaaS workloads. As providers enrich platforms with built-in security and AI services, developers gain more freedom to focus on user value rather than plumbing.
In the cloud computing market, PaaS vendors increasingly differentiate through industry frameworks and integrated MLOps. These capabilities shorten deployment of advanced analytics, raise code quality, and reduce developer toil. The combination positions PaaS as a strategic lever for digital products, underpinning rapid experimentation and continuous delivery.


By Deployment Model: Hybrid architectures balance control and scale
Although private clouds captured 46.62% revenue in 2025, hybrid clouds are expanding at 22.24% CAGR. The model preserves data closeness for sensitive workloads while bursting to public capacity for testing, analytics, and disaster recovery. The cloud computing market size for hybrid deployments is set to rise sharply as firms standardize Kubernetes control planes across on-premises cores and outsourced capacity.
Oracle’s cross-cloud pact with AWS eliminates data-egress fees and permits Oracle Database to run seamlessly on either provider. Interoperability curbs vendor-lock fears and lets customers optimize on performance or price. Consequently, the hybrid strategy is viewed as a safety valve for compliance and a springboard for modernization without risky forklift migrations.
By End-User Vertical: Healthcare digitizes at record pace
Healthcare and life-sciences workloads will grow at 20.92% CAGR through 2031—fastest in the cloud computing market. Electronic health records, telemedicine, and AI-enabled diagnostics depend on high-performance, compliant clouds. Banking, financial services, and insurance hold the greatest revenue share at 27.42%, leveraging real-time fraud analytics and regulatory reporting hosted on scalable platforms.
For providers, healthcare-specific offerings embed audit trails, encryption, and clinical-decision support. Such deep verticalization minimizes setup complexity and accelerates time-to-value, bolstering adoption even in historically cautious environments.
By Organization Size: SMEs tap enterprise-class tech
Small and medium-sized enterprises represent the most vibrant cohort at 21.28% CAGR. Cloud eliminates heavy upfront capital outlays, allowing SMEs to deploy ERP, ecommerce, and data analytics through subscription models. While large enterprises still account for 53.12% of spending, SME momentum widens the customer base and spurs provider innovation in simplified pricing, guided onboarding, and managed services.
In the cloud computing industry, SME-focused bundles include one-click backups, pre-set security policies, and vertical templates. These design choices lower skill barriers and extend reach into emerging economies where on-prem hardware would be cost-prohibitive.
Geography Analysis
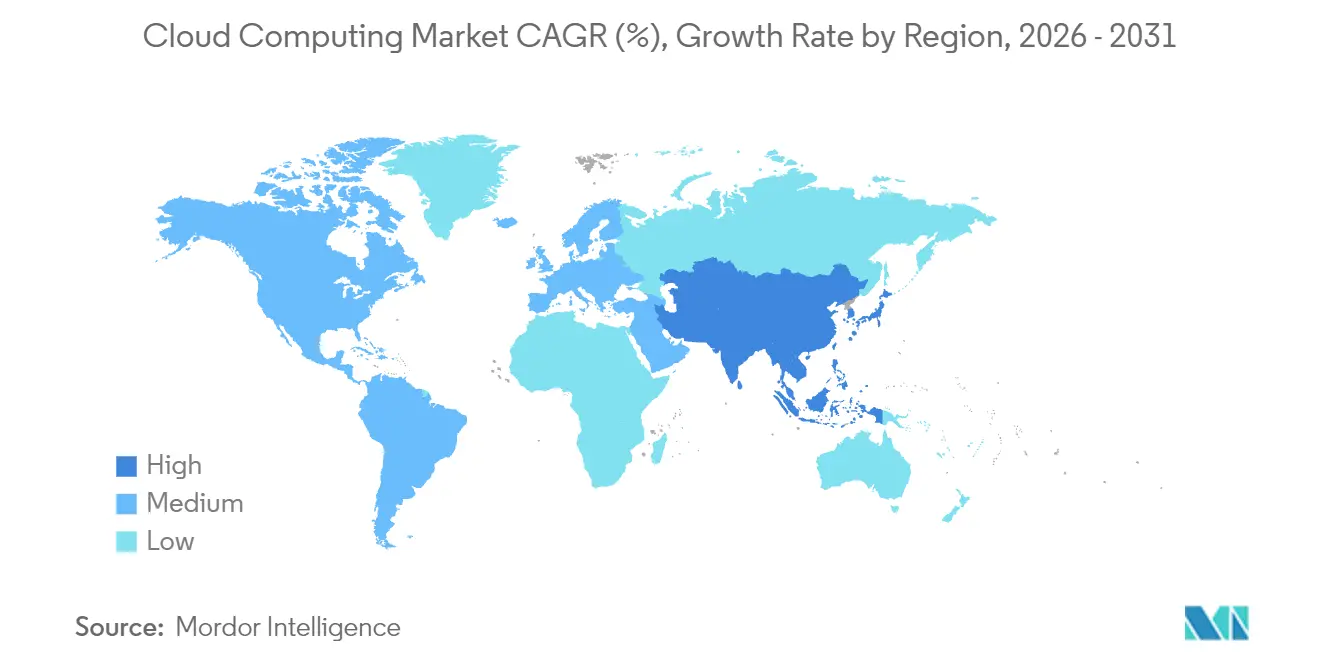
North America commanded 24.18% of 2025 revenue thanks to an early lead in cloud adoption and dense clusters of digital-native enterprises. Investment continues: Amazon is channeling USD 30 billion into Pennsylvania and North Carolina campuses, while Microsoft plans USD 80 billion in fiscal-year 2025 capacity. Growth in the region now pivots around AI workloads that demand proximity to talent and research hubs. Canada and Mexico open incremental opportunities as firms spread workloads for redundancy and cost optimization.
Europe balances aggressive digital-transformation targets with stringent data-sovereignty rules, shaping the region’s trajectory within the Cloud Computing Market. Organizations favor hybrid architectures that keep sensitive data local yet leverage global clouds for development and analytics. Providers such as OVHcloud emphasize European data residency as a unique selling point. Geopolitical shifts post-Brexit compel UK businesses to navigate evolving cross-border data agreements, further reinforcing hybrid adoption.
Asia-Pacific is the engine of future expansion, with a projected 21.65% CAGR. Infrastructure projects scale rapidly: Sify will invest USD 5 billion in Indian AI-focused data centers. Domestic champions such as Alibaba Cloud and Tencent Cloud dominate China, while international providers target Japan, South Korea, India, and fast-growing ASEAN states. Governments back cloud-first policies and smart-city programs, accelerating demand for scalable platforms.
Mordor Intelligence provides coverage of the cloud computing market across other key regional markets, including North America, Europe, Asia, and South America, each with their regulatory frameworks and demand patterns. Detailed country-level analysis extends to Canada, France, India, Brazil, United States, and Spain incorporating local coverage and market participation, as required.

Regulatory Landscape
Cloud computing regulation is increasingly framed around data sovereignty, cloud assurance certification, and requirements tied to switching and portability. In the European Union, the Data Act begins applying in September 2025, adding obligations intended to make cloud switching and portability easier. The European Commission proposed the Cloud and AI Development Act (CADA) in June 2026 to reduce infrastructure dependency and set up a sovereign cloud framework with multiple Union assurance levels. Taken together, these rules raise the bar for in-region processing, auditable controls, and clearer provider transparency as enterprises move regulated workloads to SaaS and industry-specific cloud platforms.
Outside Europe, national frameworks continue to shape deployment choices and provider selection, especially for public sector and critical infrastructure workloads. Saudi Arabia's Communications, Space, and Technology Commission (CST) administers the Cloud Computing Regulatory Framework (CCRF), and South Korea's Cloud Security Assurance Program (CSAP) includes localization and assurance requirements that can limit foreign cloud participation. Trade policy has also become a point of pressure: the US 2026 Report on Trade Barriers highlighted cloud procurement restrictions and localization-oriented measures across multiple markets, illustrating how compliance and market access intersect for hyperscalers and their enterprise customers.
Competitive Landscape
Significant moves include Oracle’s USD 40 billion Nvidia-chip order, Amazon’s multi-state AI campus rollouts, and Microsoft’s bespoke Azure AI silicon roadmap. Multi-cloud collaboration—Oracle Database@AWS and @Google Cloud—highlights a pivot from exclusivity to ecosystem value. White-space niches arise in sovereign-cloud offerings, edge nodes for autonomous systems, and developer-friendly platforms targeting SMEs.
Emergent disruptors such as Snowflake and DigitalOcean focus on narrow workload classes, leveraging agility over scale. Proprietary chip lines (AWS Graviton, Google TPU, Microsoft Azure Cobalt) drive performance per watt gains and differentiate cost economics. The playing field remains dynamic, yet capital intensity and network effects favor incumbents able to sustain multi-billion-dollar annual investments.
Cloud Computing Industry Leaders
-
Amazon (AWS)
-
Microsoft
-
Google Cloud
-
Alibaba Cloud
-
IBM
- *Disclaimer: Major Players sorted in no particular order

Market Opportunities and Future Outlook
Sovereign-cloud and assurance-led procurement is creating whitespace for providers and partners that can deliver compliant architectures without slowing development timelines. The EU's June 2026 CADA proposal, which targets a significant increase in regional data center capacity through 2033, strengthens demand for in-region infrastructure, certified operations, and localized support models. It also points to opportunities for European-residency offerings, including certified stacks for government and critical infrastructure, and for tooling that helps organizations operationalize portability and switching requirements under the EU Data Act, particularly across hybrid and multi-cloud environments.
AI infrastructure scaling and multi-cloud interoperability are also becoming more productized and partner-driven, which expands the opportunity set across hardware, networking, and managed services layers. In July 2026, Microsoft expanded its long-term partnership with AMD to deploy next-generation Instinct and EPYC platforms, plus Pensando DPUs and rack-scale designs, to strengthen Azure AI inference and networking performance, while a separate July 2026 partnership with 3M brought Expanded Beam Optical technology into Azure data center infrastructure to improve density and scalability. On interoperability, AWS made AWS Interconnect - multicloud generally available in April 2026, enabling private connectivity that starts with Google Cloud, and AWS Security Hub added monitoring support for Microsoft Azure resources in June 2026. Together, these steps broaden options for cross-cloud security posture management, network interconnect services, and workload portability offerings aimed at reducing friction in multi-cloud operations.
Recent Industry Developments
- July 2026: Microsoft expanded strategic partnership with AMD to deploy AMD Helios rack-scale solutions, 6th Gen AMD EPYC Venice processors, and AMD Pensando DPUs in Azure. The move enhances AI-infra performance for cloud workloads. Hardware co-engineering strengthens Azure AI compute moat and scalable data-center capability
- July 2026: Microsoft partnered with 3M to deploy 3M Expanded Beam Optical technology in Azure data centers to advance AI infrastructure. The upgrade supports optical infrastructure throughput for AI data centers. Differentiates Azure in data-center throughput and energy efficiency for AI workloads
- April 2026: AWS General availability of AWS Interconnect - multicloud, a service enabling private, high-speed connections between AWS and other cloud providers, starting with Google Cloud. Multicloud interoperability and private interconnect for enterprise workloads. Reduces friction for customers migrating or distributing workloads across clouds, strengthening AWS ecosystem glue


Research Methodology Framework and Report Scope
Market Definition and Coverage
For this report, the cloud computing market is defined as spending on cloud delivered computing services that enterprises and consumers access over a network. The scope covers core infrastructure, platform services, and software provided through cloud deployment models.
Scope exclusions: We exclude traditional on-premise software licenses and hardware-only sales that are not delivered as a cloud service.
Segmentation Overview
-
By Service Model
- IaaS
- PaaS
- SaaS
-
By Deployment Model
- Public Cloud
- Private Cloud
- Hybrid Cloud
-
By End-user Vertical
- IT and Telecom
- BFSI
- Manufacturing
- Retail and Consumer Goods
- Healthcare and Life Sciences
- Others
-
By Organisation Size
- Large Enterprises
- Small and Mid-Sized Enterprises (SMEs)
-
By Geography
-
North America
- United States
- Canada
- Mexico
-
South America
- Brazil
- Argentina
- Rest of South America
-
Europe
- Germany
- United Kingdom
- France
- Italy
- Spain
- Rest of Europe
-
Asia-Pacific
- China
- Japan
- India
- South Korea
- Southeast Asia
- Rest of Asia-Pacific
-
Middle East and Africa
-
Middle East
- Saudi Arabia
- United Arab Emirates
- Turkey
- Rest of Middle East
-
Africa
- South Africa
- Nigeria
- Egypt
- Rest of Africa
- Egypt
- Rest of Africa
-
Middle East
-
North America
Data Sources, Market Sizing, and Validation
Desk Research
Desk research was used to build the starting structure of the market and to pin down consistent definitions around service models and deployment. We leaned on public sources such as US NIST cloud computing publications, OECD digital economy indicators, ITU ICT statistics, World Bank macro and sector datasets, and WTO and national statistical releases to interpret trade, investment, and digitization signals.
We also reviewed annual reports, earnings transcripts, investor presentations, and credible press coverage to understand pricing direction, capacity expansion themes, and large contract movements that may shift demand. For cross-checks, we selectively used paid subscriptions that cover company financials and intelligence, news and financials, patent databases, and contract and tender tracking. The desk sources listed here are illustrative only, and many additional public and paid references were used for data collection, validation, and clarification.
Primary Interviews and Surveys
Primary work focused on interviews and surveys with cloud buyers, channel partners, and technical and commercial experts who track service adoption and budgeting patterns. To keep assumptions realistic, we tested points such as service mix shifts, typical contract terms, and pricing movement by workload type, then aligned those responses with regional demand signals across major geographies.
When a data gap showed up in desk research, respondents were re-contacted to confirm the best proxy to use, for example deployment mix or average usage intensity for key customer groups.
Distribution of primary research fieldwork respondents
| Company type | Respondent position | Region |
|---|---|---|
| Top tier: 27% | CXOs: 19% | APAC: 46% |
| Mid tier: 52% | Functional/Unit leaders: 32% | EMEA: 30% |
| Smaller Players: 21% | Managers: 49% | Americas: 24% |
Market-Sizing & Forecasting
Sizing starts with a top-down build where public cloud and broader digital spending signals are translated into a cloud demand pool. We then split the demand by service model and deployment using adoption and mix patterns validated through interviews. To keep the totals grounded, we corroborate the outcome with selective bottom-up checks, including sampled vendor revenue direction, channel feedback on pipeline strength, and ASP times volume style approximations for large service buckets.
Inputs that materially move the model include enterprise cloud migration pace, workload growth tied to data and AI usage, pricing trends for compute and storage, shifts between public, private, and hybrid deployments, and the share of spend flowing to SaaS versus platform and infrastructure services. Where direct splits are not available, we use transparent allocation keys consistent across regions, then adjust them only when primary feedback and observable indicators suggest a persistent difference.
For forecasting, we rely on scenario analysis supported by trend smoothing, with base case growth tied to a small set of drivers that can be updated each year. The scenarios are anchored around demand visibility from budgets and contracts, then stress-tested for macro changes, regulatory constraints, and capacity additions that could change near-term growth.
Data Validation & Update Cycle
Validation is handled through multiple checks so that large jumps do not pass through without a clear explanation. We compare the modeled totals with independent signals such as public cloud spending trackers, macro IT spend direction, and service category growth rates, and then investigate variances before sign-off.
Any unusual movement triggers a deeper review of assumptions, followed by targeted follow-ups with primary respondents when needed. Reports are refreshed annually, and interim updates are made when material events occur, such as sharp pricing shifts, major regulatory moves, or step changes in capacity. Before delivery, the full model is re-run with a final pass so clients receive the latest updated view.
Mordor Intelligence's Cloud Computing Market Size Compared With Other Published Estimates
Published market values for cloud computing can look far apart because each publisher draws the market boundary in its own way, and not all use the same year, currency timing, or spending measure. Differences also show up when one estimate is based on end-user spend, while another is built from service revenue and then split by deployment and service model.
The table shows a spread that is mainly explained by what is counted inside the total and how quickly assumptions are refreshed. In Mordor Intelligence's model, the total is built as a full cloud computing market across IaaS, PaaS, and SaaS, then segmented by deployment (public, private, hybrid), rather than limiting the number to only public cloud end-user spending.
Benchmark comparison
| Source | Market Size | Gaps in Research Methodology |
|---|---|---|
| Mordor Intelligence | USD 1.04 T (2026) | |
| Industry Forecast Publisher A | USD 723.4 B (2025) | Uses public cloud end-user spending totals and a different base year, which typically excludes private cloud and may treat some adjacent categories (like BPaaS) differently from a full cloud computing revenue view. |
| Industry Forecast Publisher B | USD 675.4 B (2024) | Reports a one-year earlier public cloud spending figure and can understate totals versus models that also account for private and hybrid deployments, plus year-to-year currency timing and rounding can shift the published headline number. |
Looking across the three figures, the biggest takeaway is that scope and the spending lens matter as much as the math. Once the same service coverage, deployment inclusion, and base-year timing are aligned, the remaining variance usually comes from how pricing and mix are carried forward during the forecast, which is why we keep assumptions traceable to a small set of observable drivers.


Key Questions Answered in the Report
What is the current size of the global cloud computing market?
The global cloud computing market is valued at USD 1.04 trillion in 2026 and is projected to reach USD 2.65 trillion by 2031, representing a compound annual growth rate of 20.65% during the forecast period.
What is the largest cloud service model by market share?
Software-as-a-Service (SaaS) maintains the dominant position with 52.87% market share in 2025, benefiting from continued enterprise application migration to cloud-native architectures.
Are small and medium enterprises (SMEs) adopting cloud computing faster than large enterprises?
Yes, SMEs demonstrate the highest growth rate at 21.28% CAGR through 2031, reflecting the democratization of enterprise-grade technology capabilities through cloud platforms that eliminate traditional barriers to advanced IT infrastructure.
Which region dominates the cloud computing market?
North America maintains the largest market share at 24.18% in 2025, supported by the presence of major hyperscale providers, early enterprise cloud adoption, and a regulatory environment that generally supports cross-border data flows.
Page last updated on:


