
Cloud Automation Market Size and Share
Market Overview
| Study Period | 2020 - 2031 |
|---|---|
| Market Size (2026) | USD 9.69 Billion |
| Market Size (2031) | USD 23.75 Billion |
| Growth Rate (2026 - 2031) | 19.64% CAGR |
| Fastest Growing Market | Asia-Pacific |
| Largest Market | North America |
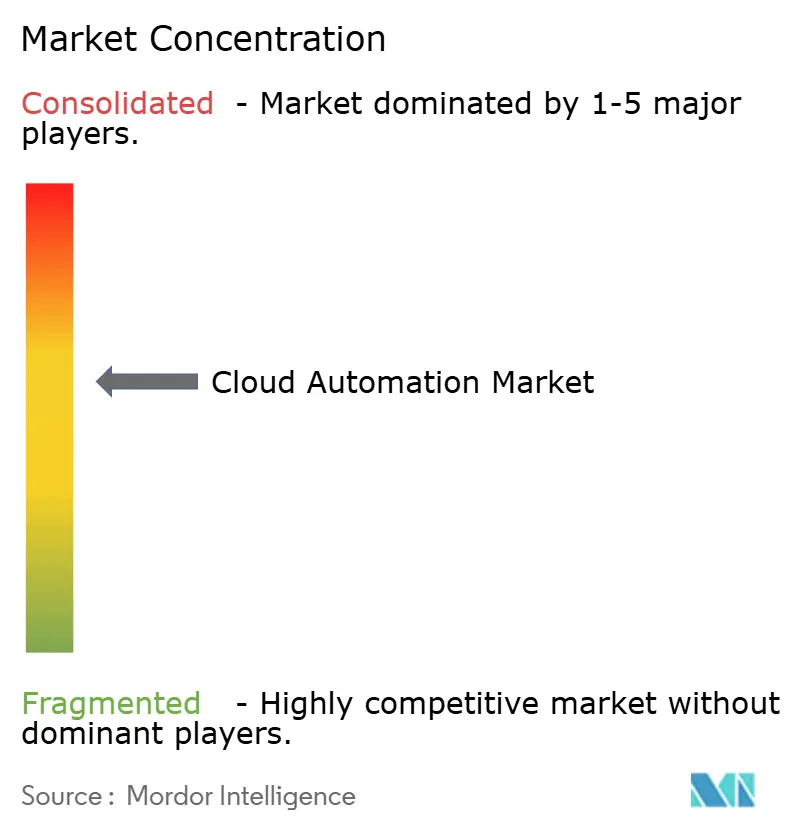
| Market Concentration | Medium |
Major Players *Disclaimer: Major Players sorted in no particular order Image © Mordor Intelligence. Reuse requires attribution under CC BY 4.0. | |
Cloud Automation Market Analysis by Mordor Intelligence
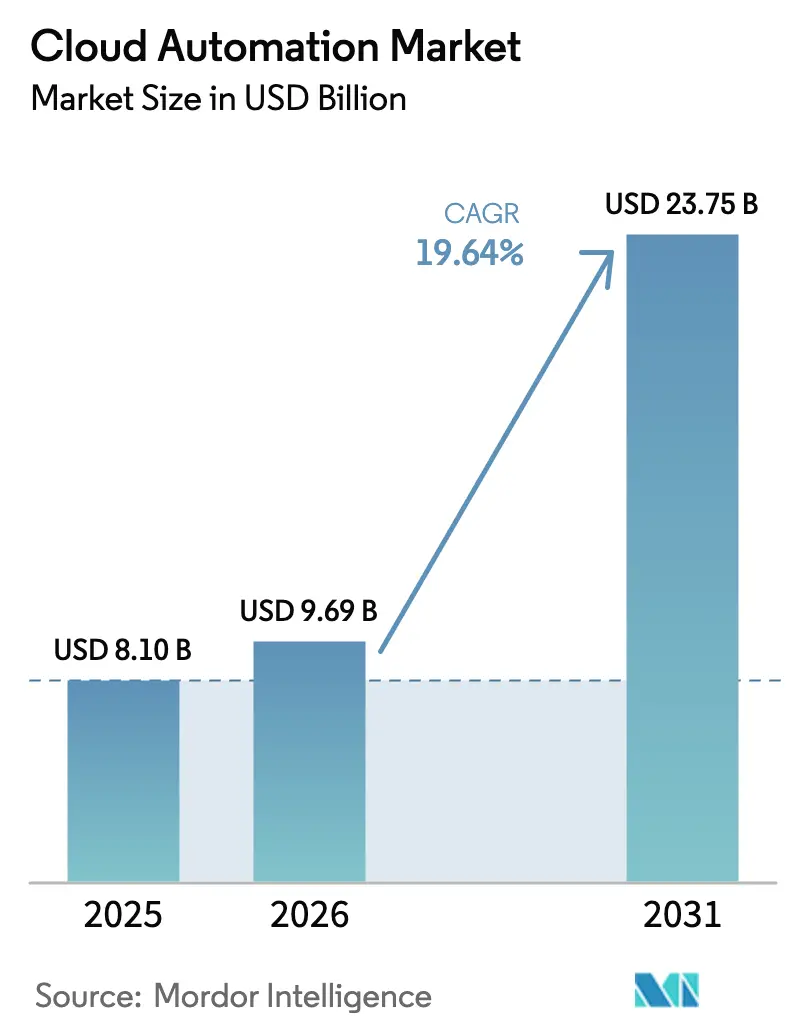
The cloud automation market size in 2026 is estimated at USD 9.69 billion, growing from 2025 value of USD 8.10 billion with 2031 projections showing USD 23.75 billion, growing at 19.64% CAGR over 2026-2031. This acceleration reflects enterprises' strategic pivot toward infrastructure-as-code methodologies and policy-driven governance frameworks that reduce operational overhead while enhancing deployment velocity. The market's robust trajectory stems from converging forces: sovereign AI regulations driving on-premise automation capabilities, the proliferation of edge computing requiring distributed orchestration, and FinOps mandates compelling real-time cost optimization across multi-cloud environments.
Key Report Takeaways
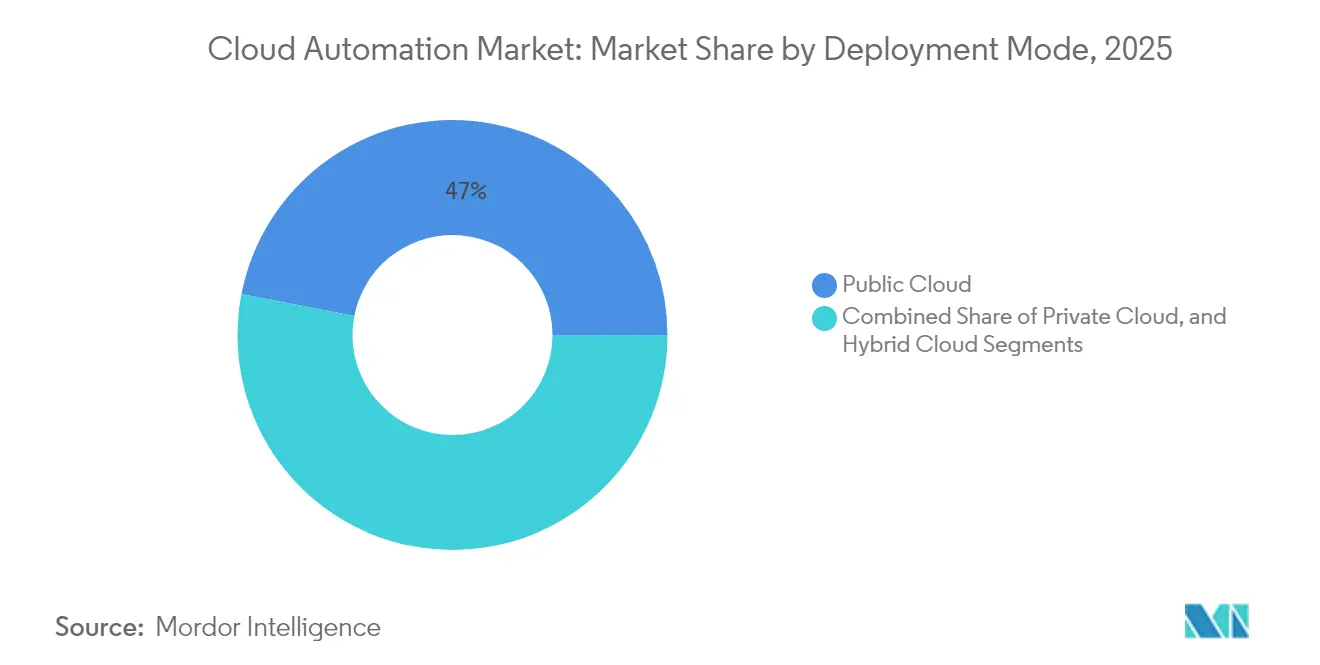
- By deployment model, public cloud held 46.95% of the cloud automation market share in 2025, while hybrid clouds are projected to advance at a 19.98% CAGR through 2031.
- By end-user industry, IT and telecom captured 26.35% of the cloud automation market size in 2025; manufacturing represents the fastest-growing sub-segment, with a 20.52% CAGR from 2025 to 2031.
- By organization size, large enterprises led with 50.25% revenue share in 2025, while small and medium enterprises are projected to expand at a 20.08% CAGR to 2031.
- By workload/process type, infrastructure provisioning accounted for 37.05% of the cloud automation market size in 2025, and security and compliance are rising at a 22.35% CAGR, outpacing on-premise models.
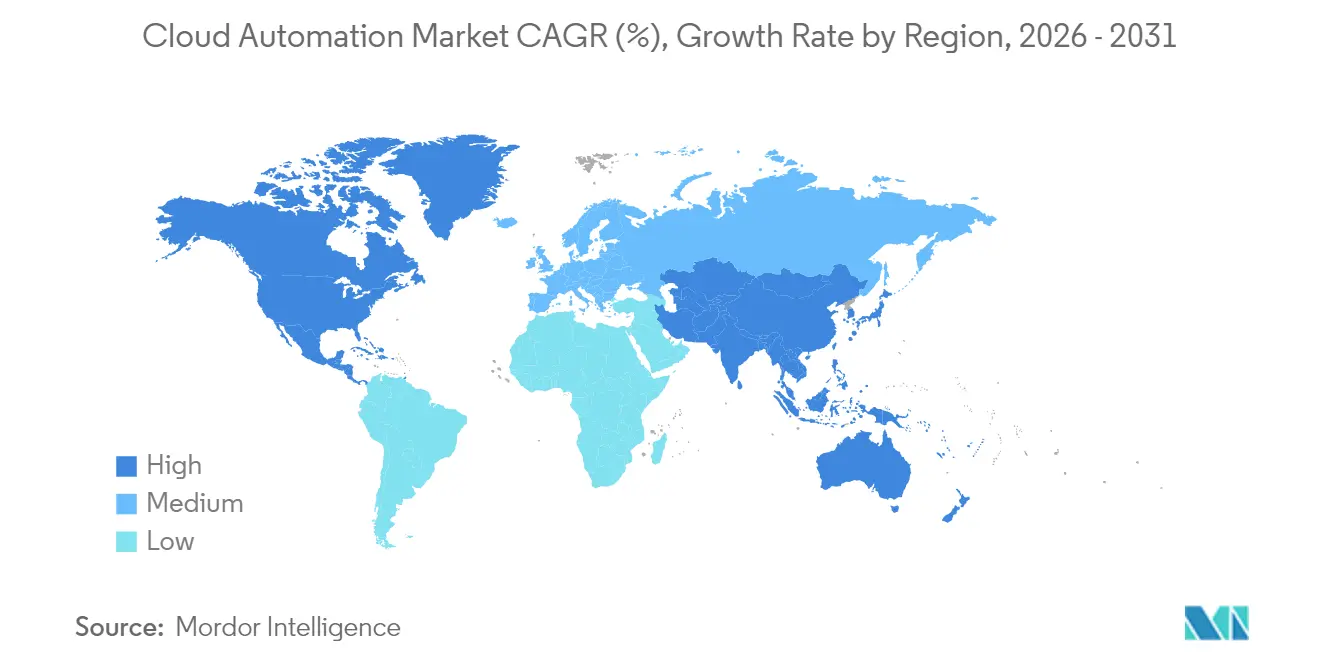
- By geography, North America controlled 32.75% of the cloud automation market share in 2025, and Asia-Pacific is advancing at a 20.64% CAGR through 2031.
Note: Market size and forecast figures in this report are generated using Mordor Intelligence’s proprietary estimation framework, updated with the latest available data and insights as of 2026.
Global Cloud Automation Market Trends and Insights
Drivers Impact Analysis*
| DRIVER | (~) % IMPACT ON CAGR FORECAST | GEOGRAPHIC RELEVANCE | IMPACT TIMELINE |
|---|---|---|---|
| Surging need for low-cost storage and faster data access | +3.2% | Global, with early gains in North America and Asia-Pacific | Medium term (2-4 years) |
| Accelerated research and development spending on cloud-native automation toolsets | +2.8% | North America and Europe core, spill-over to Asia-Pacific | Long term (≥ 4 years) |
| Proliferation of multi-/hybrid-cloud architectures | +4.1% | Global | Short term (≤ 2 years) |
| DevOps and CI/CD adoption driving "everything-as-code" | +3.6% | Global, with a concentration in tech hubs | Medium term (2-4 years) |
| FinOps automation for real-time cloud cost governance | +2.9% | North America and Europe, expanding to the Asia-Pacific | Short term (≤ 2 years) |
| Edge-to-cloud automation for Industry 4.0 micro-DCs | +2.4% | Asia-Pacific core, spill-over to the Middle East and Africa | Long term (≥ 4 years) |
| Source: Mordor Intelligence | |||
Proliferation of Multi-/Hybrid-Cloud Architectures
Multi-cloud and hybrid-cloud strategies have evolved beyond risk mitigation to become competitive differentiators, with several enterprises expected to operate across multiple cloud providers by 2024. This architectural shift drives demand for unified orchestration platforms that can abstract infrastructure complexity while maintaining workload portability and flexibility. The trend accelerates as data sovereignty regulations in the EU and Asia-Pacific require localized processing capabilities, forcing enterprises to deploy geographically distributed automation frameworks that can seamlessly manage workloads across sovereign boundaries.
DevOps and CI/CD Adoption Driving "Everything-as-Code"
As large enterprises increasingly form dedicated platform teams, platform engineering emerges as the dominant strategy for scaling DevOps practices. This evolution has spurred a heightened demand for self-service automation tools, empowering developers to provision infrastructure, deploy applications, and oversee security policies via code-driven workflows. Furthermore, this trend is paving the way for smaller automation vendors, who prioritize enhancing the developer experience. Organizations are actively seeking these nimble alternatives, moving away from traditional monolithic platforms that often stifle innovation and agility.
FinOps Automation for Real-Time Cloud Cost Governance
Cloud cost optimization has transitioned from sporadic evaluations to seamless, automated routines. Today, practices like real-time spending alerts and dynamic resource rightsizing are the norm. Organizations leveraging FinOps automation are reaping substantial savings and gaining clearer insights into their cloud usage. This evolution is fueling a surge in demand for specialized platforms. These platforms not only integrate with financial systems but also provide detailed cost attribution in complex, multi-cloud environments.
Accelerated Research and Development Spending on Cloud-Native Automation Tool-Sets
Despite facing broader market challenges, investor enthusiasm for cloud automation startups remains robust. This persistent interest highlights a strong belief in automation's capability to mitigate skills shortages and streamline operations. Moreover, funding patterns are increasingly gravitating towards solutions that democratize automation, making it user-friendly for those without technical expertise. This trend underscores a significant shift towards low-code and no-code automation interfaces.
Restraints Impact Analysis*
| RESTRAINT | (~) % IMPACT ON CAGR FORECAST | GEOGRAPHIC RELEVANCE | IMPACT TIMELINE |
|---|---|---|---|
| Persistent privacy and security vulnerabilities | -2.1% | Global, with heightened impact in Europe and Asia-Pacific | Short term (≤ 2 years) |
| Legacy infrastructure technical debt | -1.8% | North America and Europe, with an emerging impact in Asia-Pacific | Medium term (2-4 years) |
| Cross-border regulatory compliance hurdles | -1.4% | Global, with a concentration in highly regulated industries | Long term (≥ 4 years) |
| Acute skills gap in policy-as-code scripting | -2.3% | Global | Medium term (2-4 years) |
| Source: Mordor Intelligence | |||
Persistent Privacy and Security Vulnerabilities
Cloud automation platforms are facing escalating security challenges as the attack surface expands across distributed infrastructure environments. The 2024 Cloud Security Alliance report documented a 47% increase in automation-related security incidents, primarily attributed to misconfigured access policies and inadequate management of secrets.[1]Cloud Security Alliance, “Automation Security Challenges and Solutions,” cloudsecurityalliance.org This vulnerability creates hesitation among risk-averse enterprises, particularly in financial services and healthcare sectors, where regulatory compliance requirements demand zero-tolerance approaches to security breaches.
Acute Skills Gap in Policy-as-Code Scripting
Organizations face significant challenges in acquiring talent due to the specialized expertise required for declarative programming languages and infrastructure automation tools, as well as the transition to policy-as-code frameworks. This shortage of skills not only slows down the adoption of these frameworks but also drives up implementation costs. Smaller organizations, in particular, face additional difficulties as they often lack the financial and operational resources to invest in comprehensive training programs or hire experienced professionals, further constraining their ability to implement these frameworks effectively.
*Our forecasts treat driver/restraint impacts as directional, not additive. The impact forecasts reflect baseline growth, mix effects, and variable interactions.
Segment Analysis
By Deployment Model: Hybrid Architectures Drive Growth
Hybrid cloud automation commands the fastest growth trajectory, with a 19.98% CAGR through 2031, despite the public cloud maintaining the largest market share at 46.95% in 2025. This divergence reflects enterprises' strategic preference for workload flexibility over single-vendor dependencies, particularly as data residency requirements intensify across jurisdictions. Public cloud automation benefits from hyperscaler investments in AI-driven optimization capabilities, while private cloud segments serve specialized use cases requiring air-gapped security or ultra-low latency performance.
The deployment model landscape reveals distinct regional preferences, with North American enterprises favoring public cloud automation for cost efficiency, while European organizations prioritize hybrid approaches to address GDPR compliance requirements. Private cloud automation, although representing the smallest segment, remains relevant in highly regulated industries where data sovereignty concerns outweigh cost considerations. Edge computing integration is increasingly blurring traditional deployment boundaries, creating a demand for unified automation platforms that can orchestrate workloads across diverse infrastructure environments.


By End-User Industry: Manufacturing Leads Acceleration
Manufacturing emerges as the fastest-growing end-user segment, with a 20.52% CAGR through 2031, driven by Industry 4.0 initiatives that require real-time automation across production environments. Smart factory implementations demand edge-to-cloud orchestration capabilities that can manage thousands of IoT devices while maintaining millisecond response times for critical control systems. IT and telecom maintain the largest market share at 26.35% in 2025, benefiting from early automation adoption and continuous infrastructure modernization requirements.
Healthcare automation adoption is accelerating as regulatory frameworks evolve to accommodate cloud-based patient data processing, with HIPAA-compliant automation platforms experiencing an 18.12% growth rate in 2025. BFSI segments demonstrate measured adoption patterns, prioritizing security and compliance automation over operational efficiency gains. Retail automation focuses on supply chain optimization and enhancing the customer experience, while other industries explore vertical-specific use cases, ranging from energy grid management to transportation logistics coordination.
By Organization Size: SMEs Drive Democratic Adoption
Small and medium enterprises accelerate cloud automation adoption at 20.08% CAGR through 2031, challenging the traditional assumption that automation requires enterprise-scale resources. This growth reflects the democratization of automation capabilities through cloud-native platforms that eliminate upfront infrastructure investments and provide pay-as-you-scale pricing models. Large enterprises are expected to maintain a 50.25% market share in 2025, leveraging automation for complex, multi-cloud orchestration and compliance management across their global operations.
The SME acceleration trend creates opportunities for automation vendors targeting simplified deployment experiences and industry-specific templates. Large enterprises focus on custom automation frameworks that integrate with their existing enterprise architecture, while SMEs prioritize out-of-the-box solutions that deliver immediate value without requiring extensive customization. This bifurcation drives product strategy differentiation, with vendors developing distinct offerings for each market segment's unique requirements and resource constraints.

By Workload/Process Type: Security Automation Surges
Security and compliance automation experiences the fastest growth, at a 22.35% CAGR through 2031, reflecting heightened cyber threat landscapes and increased regulatory scrutiny across industries. This acceleration stems from enterprises' recognition that manual security processes cannot keep pace with the rapid development of cloud-native applications, creating a demand for automated threat detection, incident response, and compliance monitoring capabilities. Infrastructure provisioning maintains the largest market share at 37.05% in 2025, serving as the foundation layer for all subsequent automation initiatives.
Application deployment automation benefits from DevOps maturation and the adoption of container orchestration platforms, while monitoring and performance management automation addresses the complexity challenges inherent in distributed cloud architectures. The convergence of these workload types creates opportunities for integrated automation platforms that can manage the entire application lifecycle from infrastructure provisioning through security monitoring. Regulatory compliance automation, particularly when combined with AI-driven policy enforcement capabilities, benefits from the ability to adapt to evolving regulatory requirements without manual intervention.
Geography Analysis
North America is expected to command a 32.75% market share in 2025, leveraging its mature cloud infrastructure and early enterprise adoption of automation frameworks. The region's growth trajectory reflects hyperscaler investments in AI-driven optimization capabilities and the proliferation of platform engineering practices among Fortune 500 companies. Canadian enterprises, in particular, focus on hybrid cloud automation to address data residency requirements while maintaining cross-border operational efficiency. Mexico's emerging manufacturing sector drives demand for Industry 4.0 automation solutions that can integrate with North American supply chains, creating opportunities for specialized automation platforms targeting cross-border operations.
The Asia-Pacific region's 20.64% CAGR through 2031 positions it as the primary growth engine for global cloud automation adoption. China's emphasis on domestic cloud platforms drives demand for automation tools that can operate within the country's unique regulatory environment, while Japan's aging workforce accelerates the adoption of automation across traditional industries. India's IT services sector serves as a global automation hub, with domestic vendors developing specialized platforms for international markets while addressing the cost-sensitive requirements of local enterprises. Southeast Asian economies benefit from government digitalization initiatives that mandate cloud-first approaches for public sector operations.
Europe's automation adoption reflects the region's dual focus on regulatory compliance and technological sovereignty, with GDPR and emerging AI regulations shaping platform selection criteria. Germany's Industrie 4.0 initiative drives demand for manufacturing automation, while the UK's post-Brexit regulatory landscape creates opportunities for automation platforms that can manage compliance across multiple jurisdictions. The region's commitment to sustainable technology practices favors automation platforms that can demonstrate measurable environmental benefits through optimized resource utilization and energy efficiency improvements.

Regulatory Landscape
Cloud automation adoption is increasingly shaped by cloud assurance, cybersecurity, and public-sector authorization regimes that push enterprises toward policy-driven governance. In the European Union, the European Commission published a proposal for the Cloud and AI Development Act (CADA) on June 3, 2026, positioning cloud sovereignty and assurance levels as procurement and deployment decision inputs for enterprises operating across jurisdictions. Germany's Federal Office for Information Security (BSI) also released C5:2026, updating cloud compliance criteria and integrating requirements aligned to NIS2 and the European Cybersecurity Certification Scheme for Cloud Services (EUCS). This reinforces the need for automated evidence collection, configuration drift detection, and continuous controls monitoring.
In the United States, federal cloud usage continues to be gated by FedRAMP authorizations and scope determinations tied to agency obligations under 44 U.S. Code 3506. That gating increases demand for automation workflows that standardize control implementation and audit artifacts across environments. Taken together, these regimes strengthen the case for infrastructure-as-code and policy-as-code approaches to consistently enforce identity, logging, encryption, and data handling requirements across public, private, and hybrid deployments. They also raise expectations for tooling that can produce verifiable compliance outputs on demand.
Value Chain Analysis
The cloud automation value chain spans infrastructure providers (hyperscalers and private cloud stacks), automation software and platforms (IaC, CI/CD, configuration management, orchestration, and security and compliance automation), and integration and managed services (consulting, MSPs, SIs). Enterprise buyers then operationalize automation through platform engineering and FinOps practices. Upstream, cloud service providers supply compute, storage, networking, and managed services that expose APIs and control planes consumed by automation tools. Downstream, enterprises and service partners translate these primitives into reusable blueprints, guardrails, and self-service catalogs for developers and operations teams.
Implementation patterns increasingly emphasize resilient multi-region and multi-cloud architectures, including cell-based designs that isolate workloads to limit incident blast radius, and event-driven approaches that handle asynchronous state changes across deployment and governance workflows. As agentic and AI-assisted operations expand, enterprise automation stacks are converging around shared components, including runtime, memory and state, tool gateways, identity, observability, and governance. This reinforces security, compliance, and auditability as embedded layers rather than post-deployment add-ons.
Competitive Landscape
The cloud automation market exhibits moderate fragmentation, creating opportunities for specialized platforms targeting vertical-specific use cases and emerging technologies. Hyperscalers leverage their infrastructure advantages to offer integrated automation capabilities, while independent software vendors focus on best-of-breed solutions that can operate across multi-cloud environments. The competitive dynamics favor platforms that can demonstrate clear return on investment through reduced operational overhead and improved deployment velocity, rather than feature-rich solutions that increase complexity.
Strategy patterns reveal distinct approaches across vendor categories, with established players emphasizing platform consolidation and AI-driven optimization capabilities, while emerging vendors target underserved market segments through specialized automation frameworks. White-space opportunities exist in edge computing orchestration, quantum-safe security automation, and industry-specific compliance management platforms. The market's evolution toward policy-as-code methodologies creates competitive advantages for vendors that can simplify complex automation workflows through intuitive user interfaces and extensive template libraries, addressing the persistent skills gap that constrains market growth.
Cloud Automation Industry Leaders
Amazon Web Services, Inc.
Microsoft Corporation (Azure)
Google LLC (Google Cloud Platform)
IBM Corporation
Cisco Systems, Inc.
- *Disclaimer: Major Players sorted in no particular order

Market Opportunities and Future Outlook
A key opportunity area is automation built around enterprise AI agent governance, where organizations need controlled tool access, policy enforcement, and audit trails as agents interact with cloud services. This shift shows up in hyperscaler and partner activity, including AWS launching a USD 1 billion Forward Deployed Engineering (FDE) organization to help enterprises deploy agents in production environments, and IBM and Google Cloud announcing a strategic partnership in June 2026 centered on scaling AI, hybrid cloud, and cybersecurity. The announcement includes delivery models that combine IBM Consulting Advantage with Google Cloud capabilities. These moves widen the addressable scope for cloud automation vendors that can package secure, repeatable deployment workflows, identity and secrets guardrails, and continuous verification across multi-cloud estates.
Regulation-driven sovereignty and assurance requirements also create whitespace for compliance-native automation, particularly in Europe where C5:2026 and the proposed CADA elevate assurance frameworks and control mapping as selection criteria. Vendors that operationalize policy-as-code across heterogeneous environments, generate machine-verifiable compliance evidence, and integrate with enterprise risk and procurement processes can differentiate in regulated verticals and public-sector adjacent deployments. In parallel, cross-cloud operational tooling that reduces friction in hybrid and multi-cloud connectivity, along with day-2 operations automation, supports platforms that unify observability, cost governance (FinOps automation), and security remediation workflows under a single automation plane.
Recent Industry Developments
- June 2026: IBM Corporation & Google LLC announce a strategic partnership to launch a new Google Cloud Practice using IBM Consulting Advantage and Google Cloud Gemini Enterprise Agent Platform to automate deployment and governance of enterprise-grade AI agents. The collaboration expands cross cloud automation capabilities and accelerates adoption of agentic AI workflows in hybrid cloud environments.
- June 2026: Amazon Web Services Inc. launches AWS Lambda MicroVMs, a serverless compute primitive offering VM level isolation and stateful execution for code generated by users or AI. Enables secure, isolated execution of AI driven automation at scale within serverless model; enhances automation reliability and governance.
- May 2026: Amazon Web Services Inc. general availability of the AWS MCP Server, a managed tool for giving AI coding agents secure, auditable access to AWS services using the Model Context Protocol. Improves control, traceability, and security of automated cloud workflows powered by AI agents.


Research Methodology Framework and Report Scope
Market Definition and Coverage
For this report, the cloud automation market is counted as revenue from software and related services used to automate cloud provisioning, configuration, orchestration, governance, and day-to-day operations across public, private, and hybrid environments.
Scope exclusions: We exclude general IT outsourcing that is not tied to cloud automation tooling, along with pure cloud hosting revenue that is not attributable to automation software or services.
Segmentation Overview
- By Deployment Model
- Public Cloud
- Private Cloud
- Hybrid Cloud
- By End-user Industry
- BFSI
- Healthcare
- IT and Telecom
- Manufacturing
- Retail
- Other End-user Industry
- By Organization Size
- Small and Medium Enterprises (SMEs)
- Large Enterprises
- By Workload / Process Type
- Infrastructure Provisioning
- Application Deployment
- Security and Compliance
- Monitoring and Performance Management
- By Geography
- North America
- United States
- Canada
- Mexico
- South America
- Brazil
- Argentina
- Rest of South America
- Europe
- Germany
- United Kingdom
- France
- Italy
- Spain
- Russia
- Rest of Europe
- Asia-Pacific
- China
- Japan
- India
- South Korea
- South-East Asia
- Rest of Asia-Pacific
- Middle East and Africa
- Middle East
- Saudi Arabia
- United Arab Emirates
- Rest of Middle East
- Africa
- South Africa
- Egypt
- Rest of Africa
- Middle East
- North America
Data Sources, Market Sizing, and Validation
Desk Research
Desk research starts with public anchors that help build a realistic demand and spend picture, and then it is refined into a market model that matches how cloud automation is bought and deployed. We used sources such as the US Bureau of Labor Statistics, the US Census Bureau, OECD digital economy indicators, World Bank macro series, and ITU ICT statistics to align the model with enterprise IT spending capacity and cloud adoption direction.
To make the supply side measurable, we also review company filings, earnings call transcripts, investor presentations, product documentation, and credible industry association releases that describe automation practices and policy changes. Where needed, we use paid subscriptions for company financials and intelligence, news and financials, and patent databases to confirm product coverage and the timing of capability releases. The sources listed here are illustrative only, since many other public references were also used for data collection, validation, and clarification during the study.
Primary Interviews and Surveys
Primary work is used to test what we saw in desk research, and it also helps fill gaps that are hard to see from public material, such as packaging rules, typical deal sizes, and adoption speed by workload type. We spoke with cloud operations leaders, platform engineering roles, systems integrators, and procurement stakeholders across key regions, and the inputs helped us confirm assumptions on pricing progression and how multi-cloud programs are budgeted.
Distribution of primary research fieldwork respondents
| Company type | Respondent position | Region |
|---|---|---|
| Top tier: 25% | CXOs: 15% | APAC: 45% |
| Mid tier: 57% | Functional/Unit leaders: 33% | EMEA: 33% |
| Smaller Players: 18% | Managers: 52% | Americas: 22% |
Market-Sizing & Forecasting
Sizing starts from a top-down build where signals from cloud infrastructure and platform adoption are converted into an automation spend pool using penetration and attach-rate logic, and then this is split across major end use settings and geographies. To keep the model grounded, we corroborate totals with selective bottom-up checks, such as sampled average selling price ranges times estimated user counts, channel feedback on renewal patterns, and supplier-side revenue splits where disclosures are available.
A few inputs that materially shape the numbers include enterprise cloud workload growth, the share of environments moving to infrastructure as code, the mix of public versus hybrid deployments, governance requirements that push automation tooling, and observed subscription price movement tied to feature bundling. When a metric is not consistently available for a country, proxy indicators are applied (for example, cloud adoption direction, IT spend capacity, and large enterprise concentration), then adjusted through interview feedback.
For forecasting, scenario analysis is used with a base case path, since buying cycles can shift with macro budgets and security events. Assumptions on adoption pace and ASP change are reviewed with practitioners so the growth curve reflects what is implementable, not just what is theoretically possible.
Data Validation & Update Cycle
Validation is done through repeated cross checks between the model outputs and independent signals, such as cloud adoption direction, reported automation program scale, and spend patterns discussed in public disclosures. When a value looks unusual, the drivers are rechecked, the conversion logic is revisited, and follow-up calls are triggered to confirm whether the variance is real or caused by a scope mismatch.
Before sign off, assumptions and calculations go through multi step analyst review so the final market number is traceable to clear inputs. Reports are refreshed annually, and interim updates are made when material events shift adoption or pricing. Right before delivery, a fresh review pass is completed so clients receive the latest updated view.
Mordor Intelligence's Cloud Automation Market Size Versus Other Published Estimates
Published cloud automation market sizes can look far apart, even when the topic label sounds the same, because timing, pricing logic, and what gets counted as automation revenue are not standardized. We see the biggest spreads when studies use older exchange-rate timing, mix licenses and services differently, or apply a single ASP curve across different workload types.
When the estimate is refreshed close to the base year and pricing is revalidated through current contract and renewal checks, the total is usually less sensitive to short-term currency moves and temporary discounting. That is why the 2025 value and the 2026 update points on this page matter, and why the latest checks and currency timing applied by Mordor Intelligence can produce a tighter range than figures built on older snapshots.
Benchmark comparison
| Source | Market Size | Gaps in Research Methodology |
|---|---|---|
| Mordor Intelligence | USD 8.10 B (2025) | |
| Global Consultancy A | USD 18.10 B (2025) | Uses a wider scope that likely bundles broader cloud management and optimization tools into automation, and it appears to apply aggressive ASP expansion without the same level of renewal based validation. |
| Trade Journal B | USD 19.70 B (2025) | Reported as a software only view for cloud infrastructure automation, which can still diverge due to different base year currency timing and a simpler approach to separating orchestration, governance, and adjacent management features. |
Looking across the three figures, most of the gap can be explained by scope boundaries and by how pricing is carried forward from older deal assumptions into the base year. By keeping the counted revenue tied to clear automation use cases and by rechecking base year pricing and currency timing, the market size stays easier to reconcile with real buying behavior and repeatable inputs.


Key Questions Answered in the Report
What is the current size of the cloud automation market in 2026?
The market is expected to reach USD 9.69 billion by 2026.
What is the current size of the cloud automation market in 2026?
It is projected to reach USD 23.75 billion, registering a 19.64% CAGR between 2026-2031.
Which deployment model is expanding the quickest?
Hybrid cloud automation is the fastest, advancing at a 19.98% CAGR through 2031.
Which region shows the strongest growth momentum?
Asia-Pacific leads regional growth with a projected 20.64% CAGR to 2031.
Which workload category is seeing the most rapid adoption?
Security and compliance automation is growing at the fastest rate, with a 22.35% CAGR through 2031.
Page last updated on:






