
Clinical Trial Imaging Market Size and Share
Market Overview
| Study Period | 2020 - 2031 |
|---|---|
| Market Size (2026) | USD 1.42 Billion |
| Market Size (2031) | USD 2.04 Billion |
| Growth Rate (2026 - 2031) | 7.47 % |
| Fastest Growing Market | Asia Pacific |
| Largest Market | North America |
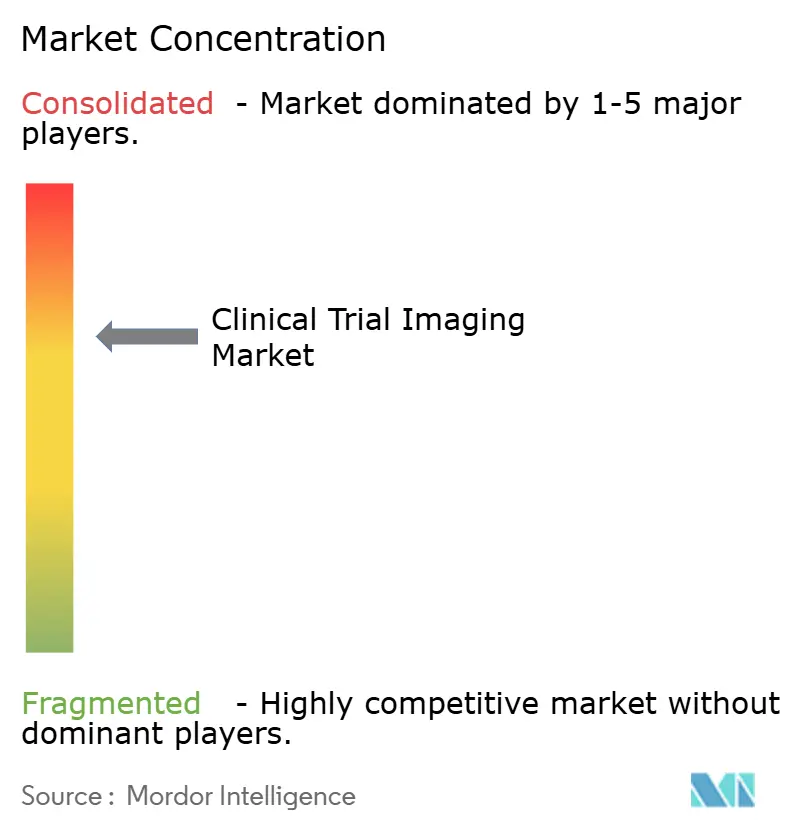
| Market Concentration | Medium |
Major Players *Disclaimer: Major Players sorted in no particular order Image © Mordor Intelligence. Reuse requires attribution under CC BY 4.0. | |
Clinical Trial Imaging Market Analysis by Mordor Intelligence
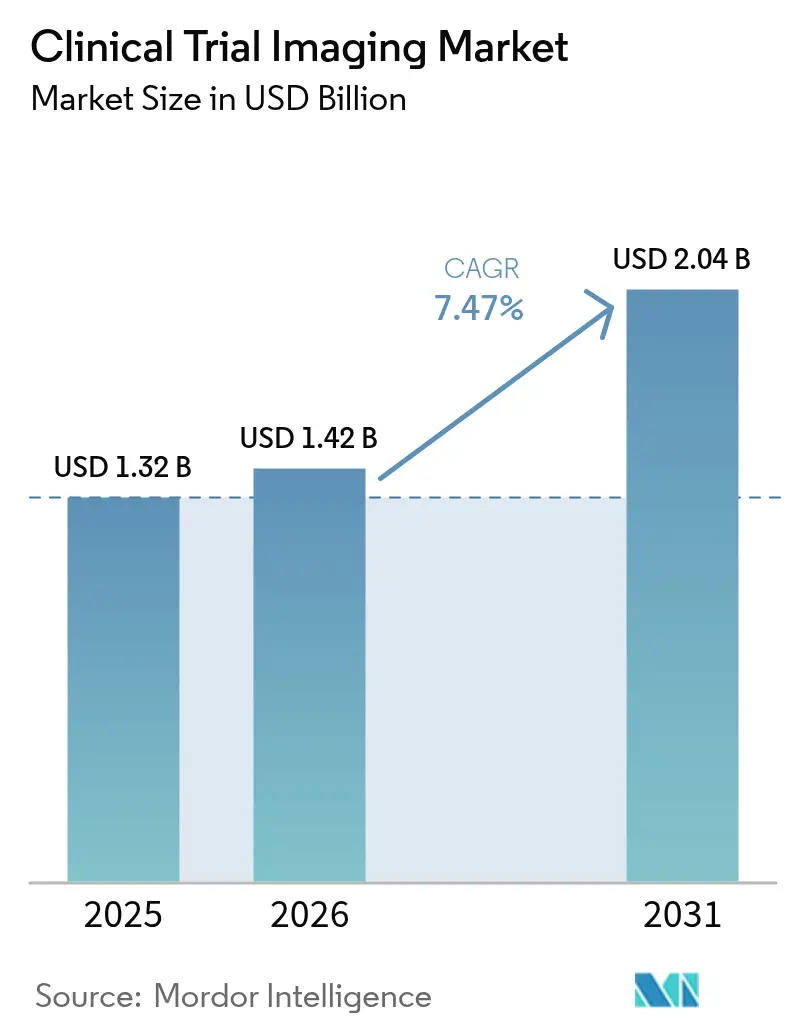
The clinical trial imaging market size is expected to grow from USD 1.32 billion in 2025 to USD 1.42 billion in 2026 and is forecast to reach USD 2.04 billion by 2031 at 7.47% CAGR over 2026-2031. This expansion mirrors the surge in global pharmaceutical R&D budgets, the growing use of imaging biomarkers in complex studies, and the steady migration toward AI-enabled data analysis. Oncology and neurology trials dominate demand because they rely on visual endpoints to prove therapeutic value, while decentralized and hybrid trial models are widening access to patient pools and accelerating enrollment timelines. AI adoption is speeding image interpretation, cutting reader variability, and improving protocol compliance across multi-site programs. Consolidation among imaging core laboratories and modality vendors is intensifying as firms bundle hardware, software, and analytics to deliver end-to-end services. Regulatory shifts—most notably the European Union Clinical Trials Regulation (EU CTR)—are harmonizing processes across borders and encouraging standardized imaging workflows.
Key Report Takeaways
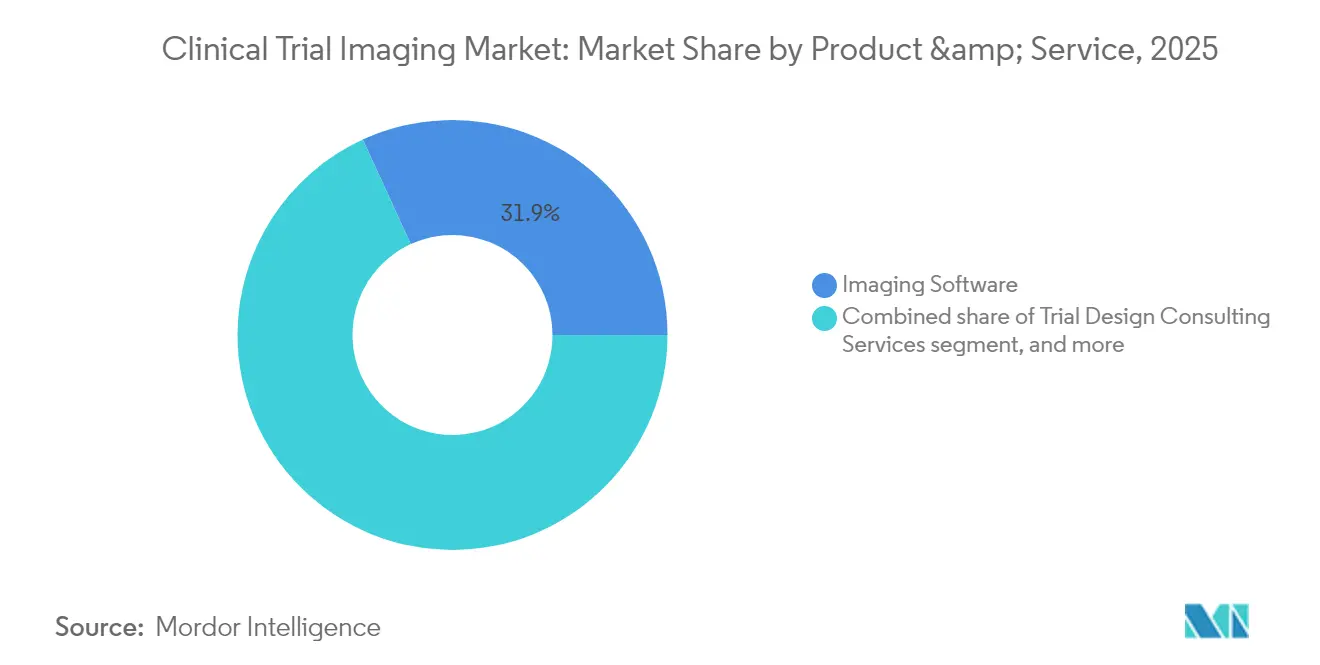
- By product & service, imaging software held 31.85% of the clinical trial imaging market size in 2025, while imaging biomarker development services are projected to climb at a 9.21% CAGR to 2031.
- By modality, computed tomography commanded 24.70% of the clinical trial imaging market size in 2025; positron emission tomography is advancing at a 9.29% CAGR between 2026-2031.
- By end-user, pharmaceutical & biotechnology companies captured 48.10% of clinical trial imaging market share in 2025, whereas contract research organizations are anticipated to grow at an 10.78% CAGR to 2031.
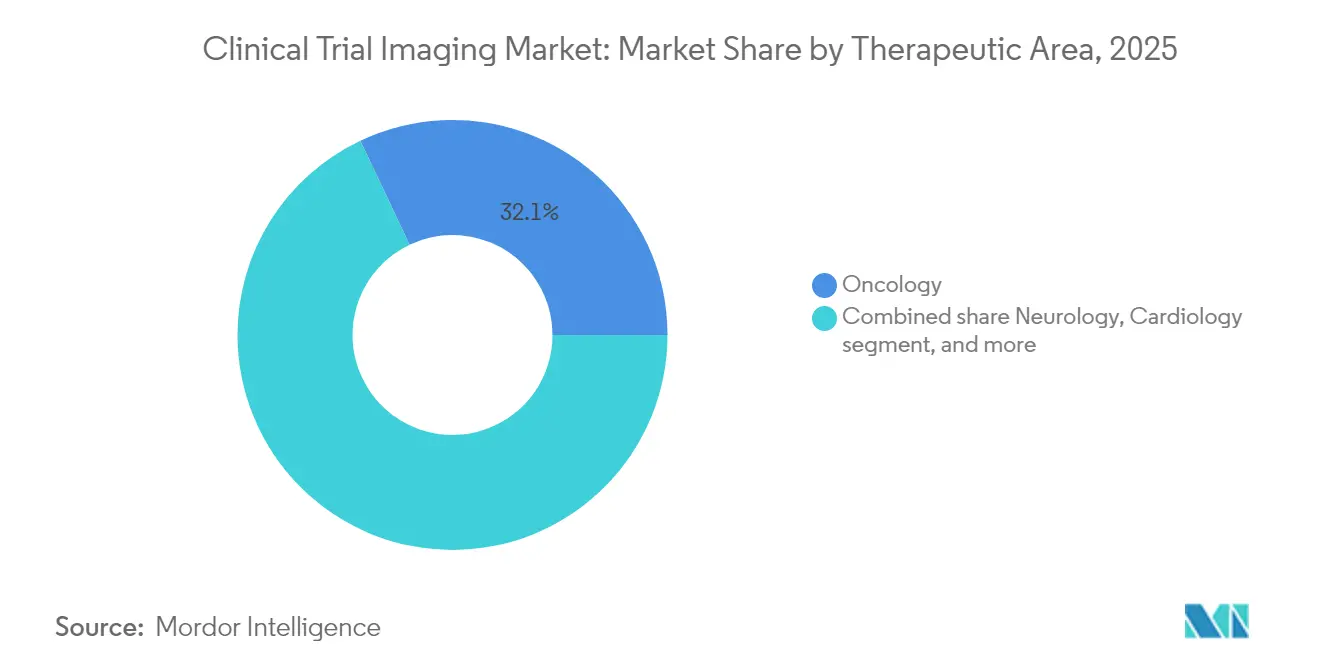
- By therapeutic area, oncology generated 32.05% of the clinical trial imaging market size in 2025, yet rare diseases are forecast to post a 9.93% CAGR through 2031.
- By trial phase, phase III studies accounted for 40.95% of the clinical trial imaging market size in 2025, while phase I studies are on track for a 10.12% CAGR during 2026-2031.
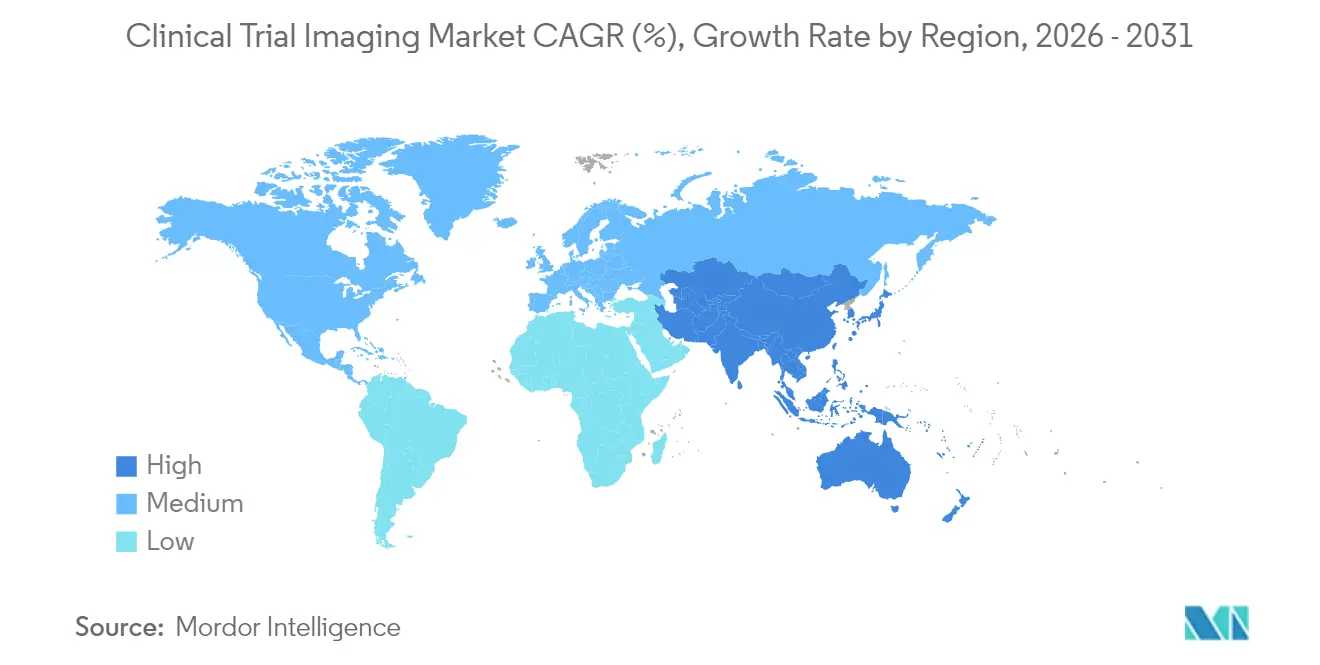
- By geography, North America led with 38.10% of clinical trial imaging market share in 2025, yet Asia-Pacific is forecast to expand at an 8.55% CAGR through 2031.
Note: Market size and forecast figures in this report are generated using Mordor Intelligence’s proprietary estimation framework, updated with the latest available data and insights as of 2026.
Market Trends and Insights
Drivers Impact Analysis of Clinical Trial Imaging Market*
| Driver | (~) % Impact on CAGR Forecast | Geographic Relevance | Impact Timeline |
|---|---|---|---|
| Increasing Pharmaceutical And Biotechnology R&D Expenditure | +2.1% | Global, led by North America & Europe | Long term (≥ 4 years) |
| Growing Outsourcing Of Imaging Services To Contract Research Organizations | +1.8% | Global; strong in Asia-Pacific & North America | Medium term (2-4 years) |
| Technological Advancements In Medical Imaging Modalities | +1.5% | Global; innovation hubs in North America & Europe | Medium term (2-4 years) |
| Rising Adoption Of Artificial Intelligence In Clinical Trial Imaging | +1.3% | Global; early uptake in North America | Short term (≤ 2 years) |
| Growth In Oncology And Neurology Clinical Trials | +0.9% | Global; high activity in Asia-Pacific & Europe | Medium term (2-4 years) |
| Expansion Of Decentralized And Hybrid Clinical Trial Models | +0.7% | Global; accelerated in Asia-Pacific post-pandemic | Short term (≤ 2 years) |
| Source: Mordor Intelligence | |||
Increasing Pharmaceutical and Biotechnology R&D Expenditure
R&D budgets climbed 9.7% in 2024 among large drug makers, and pipelines now exceed 8,000 active assets, deepening demand for imaging endpoints that objectively track therapeutic impact. Biologics and gene therapies—expected to represent more than 60% of new approvals by 2030—often require molecular-level visualization, pushing sponsors to secure sophisticated imaging core lab support. Leading firms such as Eli Lilly have extended investments in GLP-1 programs, and each protocol embeds specialized MRI or PET components to monitor metabolic and cardiovascular parameters. As outsourcing grows, suppliers able to scale imaging services across continents stand out, with over 80% of R&D executives planning double-digit spending increases on external partners. This funding momentum anchors a long-term tailwind for the clinical trial imaging market.
Growing Outsourcing of Imaging Services to Contract Research Organizations
CRO revenues hit USD 52.19 billion in 2023, reflecting a strategic pivot by drug developers toward external imaging expertise to cut fixed costs and speed trial execution[1]. ICON alone reported USD 9.974 billion in new business wins during 2024, underscoring sponsor appetite for integrated imaging networks capable of protocol harmonization, real-time QC, and automated AI analytics. Outsourcing can trim study timelines by up to 30% by centralizing image data and applying predefined read algorithms, advantages magnified in hybrid and decentralized models that collect scans from community sites and patients’ homes. CROs are matching demand with targeted acquisitions in teleradiology, ophthalmic imaging, and quantitative biomarker platforms to widen service breadth across therapeutic areas.
Technological Advancements in Medical Imaging Modalities
Photon-counting CT scanners cut radiation dose while boosting spatial resolution, a breakthrough for longitudinal pediatric trials where cumulative exposure is a concern. PET-MRI hybrids deliver concurrent functional and anatomic data, simplifying patient visits and enhancing endpoint correlation in neuro-oncology programs. Portable MRI and low-payload CT units are extending trial reach to rural regions, broadening recruitment and supporting decentralized designs. Novel radiotracers, including PSMA agents for prostate cancer and FAPI compounds for fibrosis mapping, enrich biomarker toolkits and enable earlier treatment-response readouts[2]. These innovations unlock new endpoints and improve data precision, reinforcing technology’s positive pull on the clinical trial imaging market.
Rising Adoption of Artificial Intelligence in Clinical Trial Imaging
More than half of healthcare organizations now deploy AI in at least one imaging workflow, compared with 17% in 2018. In trials, AI automates QC, flags protocol deviations, and extracts quantitative biomarkers in seconds, shrinking analysis bottlenecks and lowering inter-reader variability. ICON’s AI suite manages document routing, forecasts staffing needs, and supplies on-demand read analytics, while GE HealthCare’s acquisition of MIM Software brings deep-learning segmentation and dosimetry tools under one roof. Regulatory confidence is rising: the FDA lists more than 300 cleared AI imaging devices, and Europe has issued guidance on AI use in the product lifecycle[3]. Although most sponsors remain in pilot phases, growing confidence in validation frameworks signals rapid AI scale-up over the next two years.
Restraints Impact Analysis of Clinical Trial Imaging Market*
| Restraints Impact Analysis | (~) % Impact on CAGR Forecast | Geographic Relevance | Impact Timeline |
|---|---|---|---|
| High Capital Investment And Operational Costs Of Imaging Equipment | -1.4% | Global; hardest for smaller CROs & academic centers | Long term (≥ 4 years) |
| Shortage Of Skilled Imaging Professionals | -0.8% | Global; most acute in North America & Europe | Medium term (2-4 years) |
| Stringent Regulatory And Data Privacy Requirements | -0.6% | Global; heightened in EU & North America | Medium term (2-4 years) |
| Lack Of Standardized Imaging Protocols Across Trial Sites | -0.5% | Global; multi-center studies worldwide | Short term (≤ 2 years) |
| Source: Mordor Intelligence | |||
High Capital Investment and Operational Costs of Imaging Equipment
State-of-the-art PET-MRI systems can cost USD 4-6 million, and photon-counting CT platforms add another USD 2-3 million burden before siting, shielding, and maintenance are factored in. Nuclear medicine programs require on-site radiopharmaceutical facilities that meet stringent cGMP standards, lifting total start-up spending far beyond many regional CROs or academic core labs. Rapid hardware cycles further complicate ROI calculations, pushing stakeholders toward mergers or strategic alliances, as seen in Affinity Equity Partners’ USD 658 million purchase of Lumus Imaging aimed at gaining scale economies.
Shortage of Skilled Imaging Professionals
Complex trial protocols depend on technologists, physicists, and image analysts versed in Good Clinical Practice, multi-modal acquisition, and regulatory submission standards. Despite growth initiatives, global supply trails demand, with vacancies highest in nuclear medicine and advanced MRI specialties. ICON employs more than 450 imaging experts, yet reports persistent recruitment strain in North America and Western Europe. Remote scanning supervision platforms and AI-guided acquisition workflows alleviate staffing gaps, but their deployment calls for regulatory approvals and secure data pathways, presenting an additional hurdle.
*Our forecasts treat driver/restraint impacts as directional, not additive. The impact forecasts reflect baseline growth, mix effects, and variable interactions.
Clinical Trial Imaging Market Segment Analysis
By Product & Service:
Software Dominance Drives InnovationImaging software accounted for 31.85% of the clinical trial imaging market in 2025, cementing its status as the backbone of data flow across global sites. These platforms automate QC, anonymize datasets, and integrate seamlessly with electronic data capture systems, lowering error rates and ensuring consistency. In revenue terms, the segment formed the largest slice of the clinical trial imaging market size, and its influence will grow as AI modules move from pilot to production. The rise of SaaS deployment models is shifting budgets from capex to opex, appealing to small and mid-sized sponsors seeking scalability without heavy infrastructure outlay.
Imaging biomarker development services, meanwhile, are projected to expand at a 9.21% CAGR, reflecting escalating demand for validated, quantitative endpoints capable of persuading regulators and payers. Underpinning this surge are FDA initiatives that underscore the value of imaging biomarkers in accelerated approvals, and the movement toward personalized therapies that require sensitive measures of treatment response. Vendors that fuse software, biomarker science, and regulatory consulting are capturing higher-margin projects, intensifying competition in this growth pocket of the clinical trial imaging market.

By Modality:
CT Leadership Faces PET Innovation ChallengeComputed tomography held 24.70% of the clinical trial imaging market in 2025 thanks to its ubiquity, rapid acquisition times, and validated role in solid tumor trials. Its dominance also stems from reimbursement support and wide reader familiarity, factors essential to large phase III studies. Even so, the modality’s share is slowly eroding as sponsors pivot to lower-dose photon-counting systems and hybrid imaging that better resolve soft-tissue changes.
Positron emission tomography is expected to post a 9.29% CAGR through 2031, the fastest among modalities. Growth hinges on a pipeline of novel radiotracers that move beyond glucose metabolism to target cell-surface receptors, hypoxia markers, and amyloid aggregates. PET’s sensitivity in detecting molecular changes ahead of anatomical shifts makes it invaluable for early dose-response studies and adaptive trial designs. The spread of total-body PET scanners, which cut dose and bolster throughput, further sharpens its appeal and enlarges its role within the clinical trial imaging market.
By End-User:
Pharma Dominance Meets CRO AccelerationPharmaceutical and biotechnology sponsors generated 48.10% of clinical trial imaging market revenue in 2025 by directly funding core lab contracts, technology licenses, and equipment leases tied to their R&D portfolios. Their in-house imaging groups oversee protocol development and vendor management but increasingly partner with technology suppliers to integrate AI and cloud delivery. The expansion of GLP-1 and monoclonal antibody pipelines keeps imaging budgets robust, especially for metabolic, cardiovascular, and oncology programs.
Contract research organizations are the fastest-growing constituency, projected at an 10.78% CAGR through 2031. CROs absorb imaging responsibilities for small to mid-tier biotechs that lack internal expertise, and they offer global site networks, standardized SOPs, and consolidated data hubs. Strategic acquisitions—such as Clario’s purchase of NeuroRx—broaden therapeutic specialization and strengthen neurology capabilities, allowing CROs to capture emerging rare-disease opportunities poised to reshape the clinical trial imaging market.
By Therapeutic Area:
Oncology Leads While Rare Diseases SurgeOncology contributed 32.05% of clinical trial imaging market revenue in 2025, cementing its primacy due to the modality-intensive nature of solid tumor assessments. RECIST metrics, bone lesion detection, and theranostic radiopharmaceuticals make imaging indispensable throughout oncology drug lifecycles. Immuno-oncology combinations and tissue-agnostic indications continue to propel imaging demand, with total-body PET and AI-assisted CT enabling earlier response readouts that inform mid-study dose adjustments.
Rare diseases, however, will outpace all other segments at a 9.93% CAGR because regulatory incentives and smaller patient pools magnify the utility of sensitive imaging biomarkers. NIH funding schemes encourage biomarker validation for conditions such as Friedreich’s ataxia and Huntington’s disease, prompting institutions like Biospective to develop sub-millimeter MRI protocols tailored to these populations. Precision endpoints derived from high-resolution neuroimaging reduce trial sizes and attenuate placebo effects, positioning this niche for outsized influence on the clinical trial imaging market.
By Phase of Clinical Trial:
Phase III Dominance Meets Phase I InnovationPhase III programs consumed 40.95% of clinical trial imaging market outlays in 2025 because pivotal studies require global site harmonization, blinded independent central review, and rigorous archiving to satisfy regulators. These late-stage budgets accommodate multiple modalities, repeat scanning, and data locks synchronized to interim analyses, all of which inflate imaging spend. Sponsors also commission endpoint adjudication committees and duplicate reads to shore up data integrity ahead of marketing authorization submissions.
Phase I studies are forecast to register a 10.12% CAGR through 2031 as imaging biomarkers shift upstream to guide dose selection and patient stratification. Whole-organ perfusion MRI, dynamic contrast-enhanced CT, and molecular PET enable non-invasive quantification of early pharmacodynamic signals, reducing reliance on invasive biopsies. AI-driven image analysis accelerates read turnaround, allowing real-time dose-escalation decisions in adaptive study designs. Together, these developments will enlarge the proportion of early-phase resources devoted to imaging and bolster innovation across the clinical trial imaging market.
Geography Analysis
North America Clinical Trial Imaging Market
North America retained 38.10% of global revenue in 2025 on the strength of mature reimbursement systems, a dense network of academic-industrial partnerships, and clear FDA guidance governing imaging endpoints. The United States also hosts many of the top 20 pharma sponsors, amplifying domestic demand for high-throughput core labs that can scale across therapeutic franchises. Private-equity investments and acquisitions—RadNet spent USD 54 million on targets in 2024—are consolidating imaging capacity and integrating AI platforms, deepening the region’s competitive moat.
APAC Clinical Trial Imaging Market
Asia-Pacific is projected to deliver the highest regional CAGR at 8.55% through 2031, propelled by streamlined ethics approvals and attractive cost structures. Regulatory agencies in Japan, South Korea, and Singapore routinely finalize clinical trial applications within six months, shortening study start-up compared with legacy markets. Local CROs such as Wuxi AppTec have scaled imaging units that serve domestic and Western sponsors alike, leveraging broad site networks and government incentives to host multinational programs. The growing popularity of decentralized trials, tele-radiology, and bring-your-own-device imaging apps augments APAC’s role in the clinical trial imaging market.
Europe Clinical Trial Imaging Market
Europe sits between these poles as it transitions to the EU CTR, which mandates full use of the Clinical Trials Information System by January 2025. The unified portal promises consistent application reviews across 30 countries and should lower administrative overhead on cross-border imaging protocols. Yet divergent rules governing radiopharmaceutical handling and data privacy remain obstacles, particularly in Germany and France. Efforts by the EMA to publish an AI reflection paper and clarify validation expectations indicate that Europe aims to retain a leadership position in governance even as operational execution evolves.
Regulatory Landscape
Clinical trial imaging operations sit at the intersection of clinical trial GCP, data integrity requirements, and imaging-specific technical standards. In the United States, FDA guidance on Digital Health Technologies for remote data acquisition in clinical investigations (2024) raises the bar on fit-for-purpose validation. It emphasizes that digitally captured endpoints and associated workflows support interpretability for product evaluation, which affects decentralized imaging capture, QC, and audit readiness.
In Europe, the EU Clinical Trials Regulation (EU CTR) continues to harmonize trial authorization and oversight through the Clinical Trials Information System (CTIS). At the same time, the EMA maintains pathways for qualification of digital technology-based methodologies used in evidence generation. Imaging interoperability and documentation expectations are also being reinforced through standards activity, including ISO 12052:2026 (DICOM) published in February 2026 for imaging exchange and information management, and ISO 14155:2026 published in March 2026 updating GCP requirements for clinical investigations of medical devices. Separately, the US ONC issued a diagnostic imaging technical standards RFI in early 2026, signaling continued policy focus on interoperable imaging exchange and how trial imaging data can feed into broader certified health IT ecosystems.
Competitive Landscape
The clinical trial imaging market features moderate fragmentation, with the top five suppliers controlling an estimated 45-50% of global revenue. Competitive intensity is rising as equipment manufacturers move upstream into software and analytics, while CROs push downstream into modality ownership to secure margin and lock in clients. Clario, ICON Medical Imaging, and IXICO are global benchmarks thanks to therapeutic breadth, proprietary platforms, and geographic reach. Their differentiation hinges on integrated AI algorithms that normalize data from disparate scanners and automate volumetric reads across oncology, neurology, and cardiology domains.
Strategic M&A is reshaping the field. GE HealthCare’s acquisition of MIM Software adds AI-powered 3D segmentation and dosimetry tools to its platform, enabling seamless workflows from scanner to analytics. RadNet’s USD 103 million iCAD deal deepens breast-imaging AI capability and illustrates a broader pattern of modality specialists acquiring algorithm developers to protect future revenue streams. Clario’s purchase of NeuroRx sharpens its focus on neurodegenerative research by absorbing advanced fMRI and PET infrastructure, while ONRAD’s takeover of Direct Radiology creates the largest independent teleradiology network in the United States, a boon for remote trial oversight.
White-space opportunities lie in blockchain-secured image repositories, which promise tamper-proof audit trails suited to regulatory audits, and in end-to-end decentralized imaging kits that pair portable scanners with cloud-native AI readers. Vendors able to wrap these capabilities into flexible, region-compliant service offerings stand to capture premium contracts as sponsors demand turnkey solutions throughout the clinical trial imaging market.
Clinical Trial Imaging Industry Leaders
-
Clario
-
Icon plc
-
Parexel International Corp.
-
Medpace Holdings, Inc.
-
Siemens Healthineers AG
- *Disclaimer: Major Players sorted in no particular order
Clinical Trial Imaging Market Companies Covered in this Report
- Clario
- Icon plc
- IXICO
- Parexel International Corp.
- Medpace Holdings, Inc.
- Navitas Clinical Research
- WorldCare Clinical LLC
- Radiant Sage
- Resonance Health
- WCG (WIRB-Copernicus Group)
- Siemens Healthineers
- GE HealthCare Technologies Inc.
- Calyx
- Signant Health
- Imaging Endpoints
- Perspectum Diagnostics
- BioClinica Inc.
- Collective Minds Research (CMRAD)
Market Opportunities and Future Outlook
Operational whitespace is widening around making imaging data as traceable and inspection-ready as other clinical data streams under modern GCP expectations, including ICH E6(R3) interpretations that stress audit trails and contemporaneous oversight. That framing increases demand for platforms that unify image acquisition metadata, chain-of-custody, anonymization, and read outputs with clinical trial systems, rather than treating imaging as a parallel workflow. Providers that can package validated remote acquisition controls (aligned with FDA 2024 DHT guidance) with standardized DICOM-based data handling (ISO 12052:2026) have a clearer path to enterprise deployments across hybrid and decentralized trial designs.
AI-enabled response assessment and automated QC are also emerging as practical opportunities where workflow gains are already being tracked through literature and commercial product roadmaps. In May 2026, Medidata announced an enhanced AI-powered imaging capability within its Medidata Data Experience to automate image analysis and better integrate imaging outputs into trial data flows, reinforcing a platform-led buying pattern among sponsors and CROs. Academic work in 2026 also highlights performance improvements from fully automated CT deep-learning pipelines for earlier efficacy signal detection in simulated oncology trial settings, supporting continued investment in standardized, validated automation for RECIST and neuro-oncology response frameworks. At the same time, cross-jurisdiction requirements for AI software governance and data privacy are pushing vendors toward privacy-preserving and federated learning architectures that can scale model development without breaching data residency constraints.
Recent Industry Developments in Clinical Trial Imaging Market
- March 2026: Thermo Fisher Scientific completed its acquisition of Clario Holdings, Inc. for USD 8.875 billion in cash, with potential earn-out payments tied to 2026 and 2027 performance. The acquisition brings a scaled imaging core lab and endpoint capabilities into Thermo Fisher’s broader clinical research services footprint, which supports more bundled, end-to-end offerings for sponsors and CROs.
- March 2026: ICON plc partnered with Advarra to introduce a research-ready, connected site network model that links ICON’s trial execution capabilities with Advarra’s site-based technologies such as CTMS, eISF, and eSource. Connecting sponsors, CRO operations, and sites through a standardized technology layer supports consistency for imaging-related workflows that rely on clean documentation, rapid startup, and protocol adherence across multi-site programs.
- March 2025: Clario acquired NeuroRx to expand neuroimaging capabilities supporting Alzheimer’s and Parkinson’s research programs. The acquisition deepened therapeutic specialization and reinforces consolidation among imaging core labs as sponsors seek integrated imaging operations, advanced analytics, and modality expertise under fewer vendor relationships.
Clinical Trial Imaging Market Report Scope and Research Methodology
Market Definition and Coverage
This market covers outsourced services and software used to plan, acquire, manage, and interpret medical images within human drug and device clinical trials, where imaging is used to generate endpoints and patient-level trial data.
Scope exclusions: It excludes routine diagnostic imaging delivered as standard clinical care, capital purchases of imaging scanners, and preclinical animal imaging work.
Segments Covered in This Report
- By Product & Service
- Trial Design Consulting Services
- Read Analysis Services
- Operational Imaging Services
- Imaging Software
- Imaging Data-management Services
- Imaging Biomarker Development Services
- By Modality
- Magnetic Resonance Imaging
- Computed Tomography
- Positron Emission Tomography
- Ultrasound
- Echocardiography
- Other Modalities
- By End-User
- Pharmaceutical & Biotechnology Companies
- Contract Research Organizations
- Medical Device Manufacturers
- Academic & Government Research Institutes
- By Therapeutic Area
- Oncology
- Neurology
- Cardiology
- Endocrinology & Metabolic Disorders
- Rare Diseases
- Other Therapeutic Areas
- By Phase of Clinical Trial
- Phase I
- Phase II
- Phase III
- Phase IV
- Geography
- North America
- United States
- Canada
- Mexico
- Europe
- Germany
- United Kingdom
- France
- Italy
- Spain
- Rest of Europe
- Asia-Pacific
- China
- Japan
- India
- Australia
- South Korea
- Rest of Asia-Pacific
- Middle East & Africa
- GCC
- South Africa
- Rest of Middle East & Africa
- South America
- Brazil
- Argentina
- Rest of South America
- North America
Data Sources, Market Sizing, and Validation
Desk Research
Desk work starts with clarifying how imaging shows up inside trial budgets, and where the spend sits across sponsors, CRO workflows, and imaging core lab activities. We referenced public sources such as ClinicalTrials.gov for trial volumes and study types, the US FDA for trial and imaging-related guidance touchpoints, the National Institutes of Health for research activity context, and OECD health statistics to keep healthcare and R and D baselines consistent.
To ground adoption patterns, we also checked materials from radiology and imaging societies such as RSNA, along with peer-reviewed journals that report imaging endpoints, modalities, and reading practices in trials. Company filings, investor presentations, and reputable press were used to understand service mix and operating models, and we complemented that with paid subscriptions that compile company financials and corporate actions, plus a patent database to spot where imaging analytics and biomarkers are getting investment. These examples are not exhaustive, and many other public sources were also used for collection, cross-checking, and clarification.
Primary Interviews and Surveys
Primary work was used to confirm what is actually purchased for a trial (central reads, site support, imaging charter work, data management, and analytics) and how pricing tends to move by modality and trial complexity. We spoke with sponsor-side study operations stakeholders, CRO delivery teams, imaging operations leads, and imaging physicians and readers across Americas, EMEA, and APAC, so regional practice differences and ramp-up timing were reflected in the model.
Distribution of primary research fieldwork respondents
| Company type | Respondent position | Region |
|---|---|---|
| Top tier: 27% | CXOs: 16% | APAC: 38% |
| Mid tier: 52% | Functional/Unit leaders: 28% | EMEA: 37% |
| Smaller Players: 21% | Managers: 56% | Americas: 25% |
Market-Sizing & Forecasting
Sizing is built using a top-down approach where trial activity and imaging intensity are reconstructed into an addressable spend pool before being translated into revenue for imaging services and software. In practice, we start from the active clinical trial universe, apply imaging utilization by trial type, and then map it to typical per-trial imaging workflow costs (from chartering through reads and data handling).
Key inputs that shape the totals include the number of imaging-heavy trials, the modality mix used in endpoints (for example MRI, CT, PET, and ultrasound), average reads per patient and per timepoint, protocol complexity that drives site support needs, and the share of centralized versus local reads. To keep the numbers realistic, selective bottom-up approximations are used as checks, such as sampling price ranges for central reads and project management, and then validating against supplier revenue disclosures and channel feedback. When coverage gaps exist in smaller regions or niche modalities, assumptions are filled using the closest comparable trial programs, and then adjusted through interview feedback.
For forecasting, scenario analysis is used because growth depends on a few practical drivers that can move up or down, such as oncology trial volume, decentralized and hybrid trial execution, and how frequently imaging is used as a primary or secondary endpoint. These scenarios are aligned to expert expectations on utilization and pricing, and the final forecast is presented as a balanced path rather than an aggressive stretch case.
Data Validation & Update Cycle
Outputs are checked against independent signals such as clinical trial counts, therapeutic mix shifts, and the observed intensity of imaging endpoints, and then variance flags are reviewed before results are finalized. Where a number looks out of pattern, the underlying driver is revisited, followed by a second pass using alternate parameter choices so that the direction of change can be explained.
A multi-step review is completed internally, and we re-contact selected primary sources when a key input changes or when desk indicators move sharply. The report is refreshed annually, and interim updates are made when material events occur, after which a final pre-release review is done so clients receive an up-to-date view.
Mordor Intelligence's Clinical Trial Imaging Market Sizing Compared With Other Published Estimates
Published estimates for clinical trial imaging often do not line up because the market boundary is not always treated the same way, and pricing and trial activity inputs can be taken from different points in time. Differences also show up when one study counts only outsourced imaging core lab revenue, while another adds broader clinical research services around it.
By tracking trial volumes, modality level imaging intensity, and read workflow pricing updates, Mordor Intelligence keeps the 2026 value tied to imaging work that is directly purchased for human clinical trials, which is then stress-tested against supplier revenue signals and interview-based utilization checks.
Benchmark comparison
| Source | Market Size | Gaps in Research Methodology |
|---|---|---|
| Mordor Intelligence | USD 1.42 B (2026) | |
| Global Consultancy A | USD 1.23 B (2024) | Uses an earlier base year and may apply a broader segment structure that blends service and software revenue without fully normalizing trial pipeline timing, which can shift the implied growth path versus a 2026 anchored model. |
| Industry Research Group B | USD 1.53 B (2025) | Appears to extend scope into adjacent clinical research support activities and uses a longer forecast window, where small differences in assumed utilization and price progression can inflate the near-term market size. |
The spread in the table is mostly explained by base-year choice and what is counted as imaging versus wider trial operations support. When scope is kept tight to imaging chartering, acquisition support, data handling, and centralized reads, and when activity and pricing inputs are refreshed to the same timing, the market total becomes easier to trace and repeat from the same steps.
Key Questions Answered in the Report
What is the current size of the clinical trial imaging market?
The clinical trial imaging market is valued at USD 1.42 billion in 2026 and is forecast to grow to USD 2.04 billion by 2031 at a 7.47% CAGR.
Which product segment leads the market?
Imaging software holds the largest share at 31.85% because it underpins standardized data capture, QC, and AI analytics across global sites.
Why is Asia-Pacific the fastest-growing region?
Streamlined ethics approvals, lower study costs, and strong government support are driving an 8.55% CAGR in Asia-Pacific through 2031.
How is AI influencing clinical trial imaging?
Asia Pacific is estimated to grow at the highest CAGR over the forecast period (2026-2031).
Which modality is expanding the fastest?
Positron emission tomography is set to grow at a 9.29% CAGR due to novel radiotracers and total-body scanner adoption that improve sensitivity and lower radiation dose.
What is the main restraint facing the market?
High capital and operational costs of advanced imaging equipment, especially PET-MRI and photon-counting CT systems, limit entry for smaller centers and raise overall trial expenses.