
Cleanroom Consumables Market Size and Share
Market Overview
| Study Period | 2020 - 2031 |
|---|---|
| Market Size (2026) | USD 6.01 Billion |
| Market Size (2031) | USD 8.51 Billion |
| Growth Rate (2026 - 2031) | 7.18% CAGR |
| Fastest Growing Market | Asia Pacific |
| Largest Market | Asia Pacific |
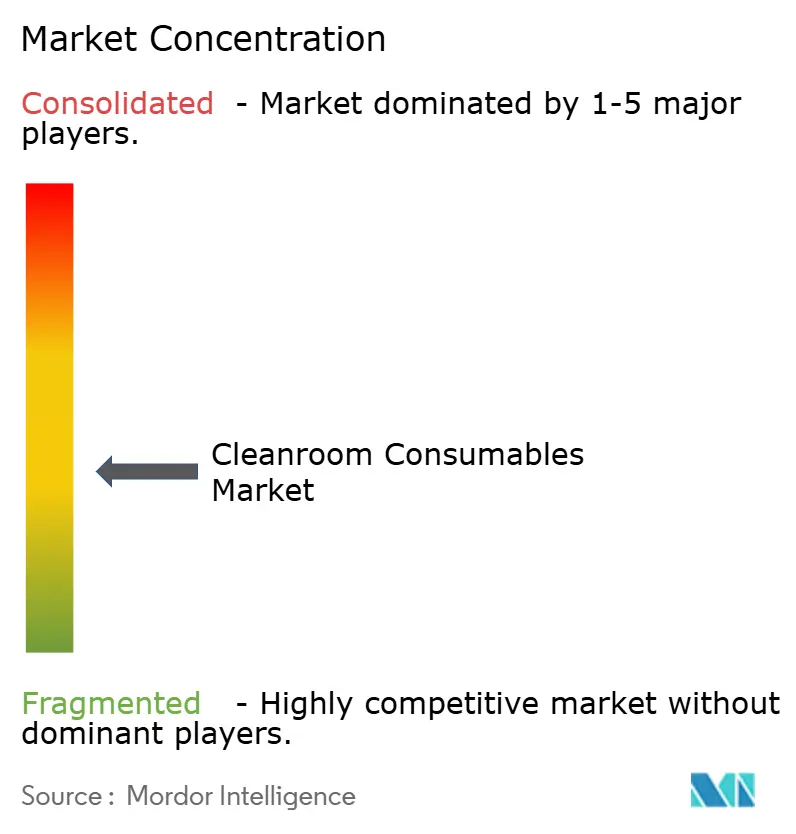
| Market Concentration | Medium |
Major Players *Disclaimer: Major Players sorted in no particular order Image © Mordor Intelligence. Reuse requires attribution under CC BY 4.0. | |
Cleanroom Consumables Market Analysis by Mordor Intelligence
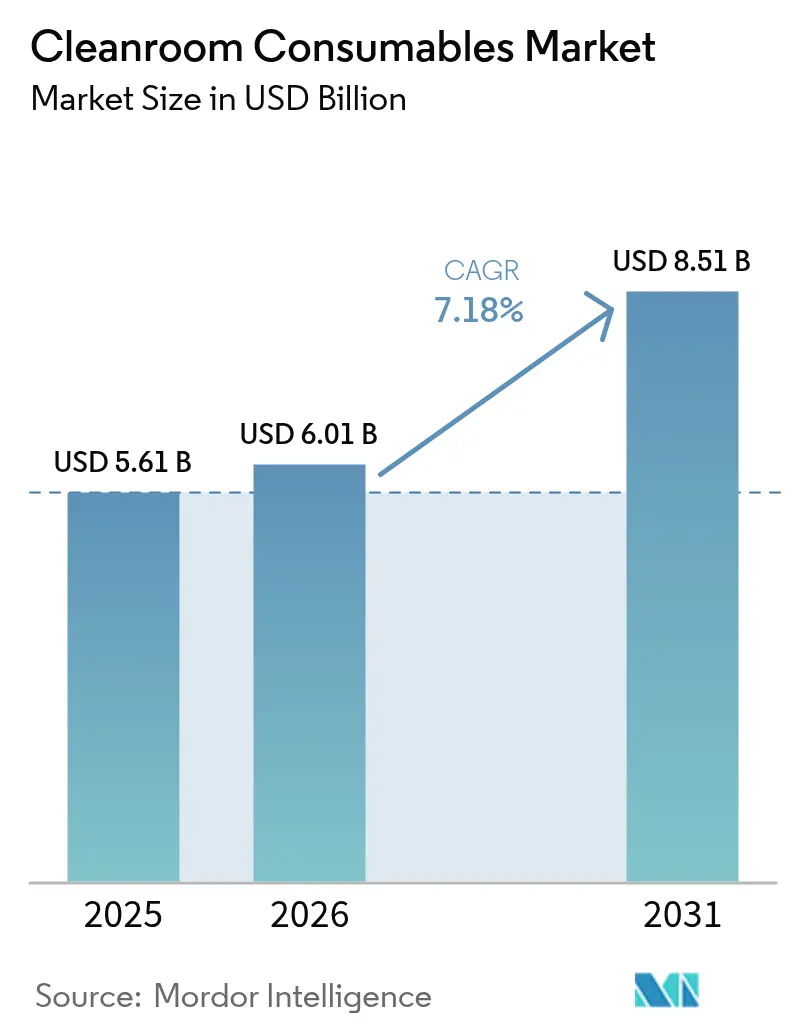
The cleanroom consumables market size was valued at USD 5.61 billion in 2025 and estimated to grow from USD 6.01 billion in 2026 to reach USD 8.51 billion by 2031, at a CAGR of 7.18% during the forecast period (2026-2031). Robust investment in advanced semiconductor fabs, stricter sterile-drug rules, and electrified vehicle battery plants collectively sustain this growth trajectory. The cleanroom consumables market benefits from rising 300 mm fab equipment outlays, escalating demand for single-use apparel under the revised EU GMP Annex 1, and widening adoption of specialized wipes within cell and gene therapy suites. Energy considerations also play a role, as facilities move from energy-intensive reusable garments toward validated disposables that cut laundering loads. Competitive intensity has sharpened after high-profile acquisitions that bolster product breadth and manufacturing scale, while regional incentives accelerate domestic supply chains for critical contamination-control items.
Key Report Takeaways
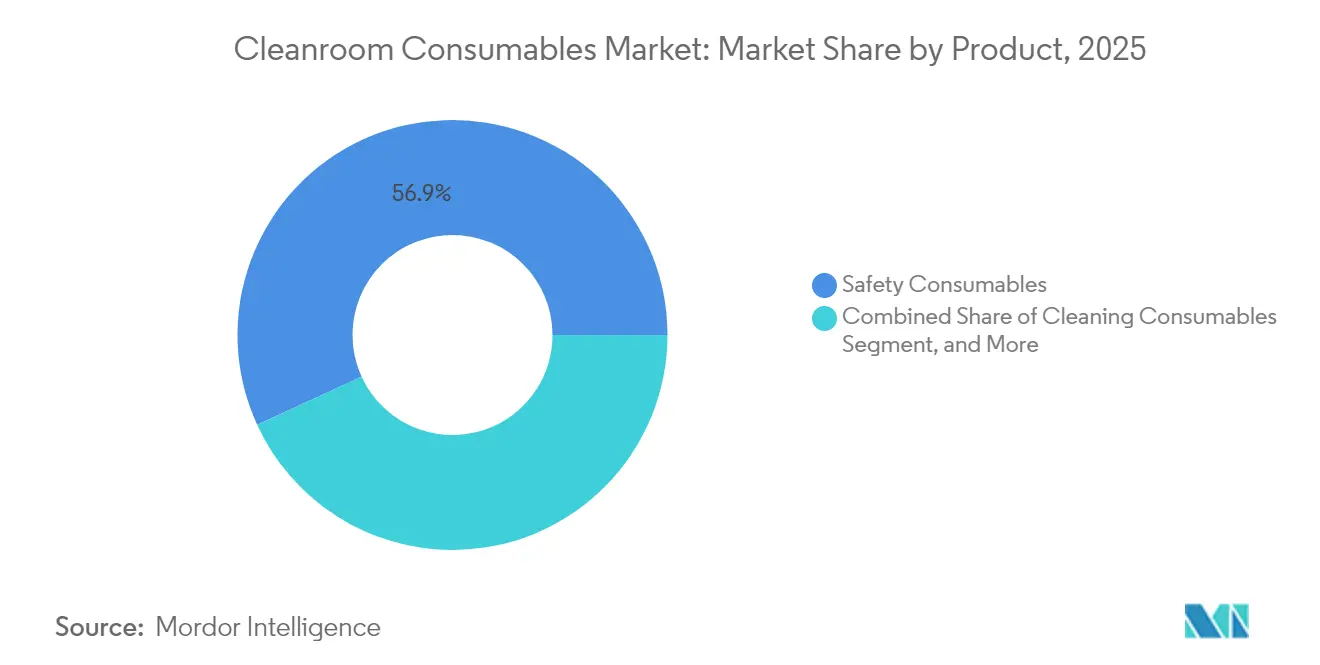
- By product category, safety consumables held 56.85% of the cleanroom consumables market share in 2025, while cleaning consumables are forecast to expand at an 8.29% CAGR through 2031.
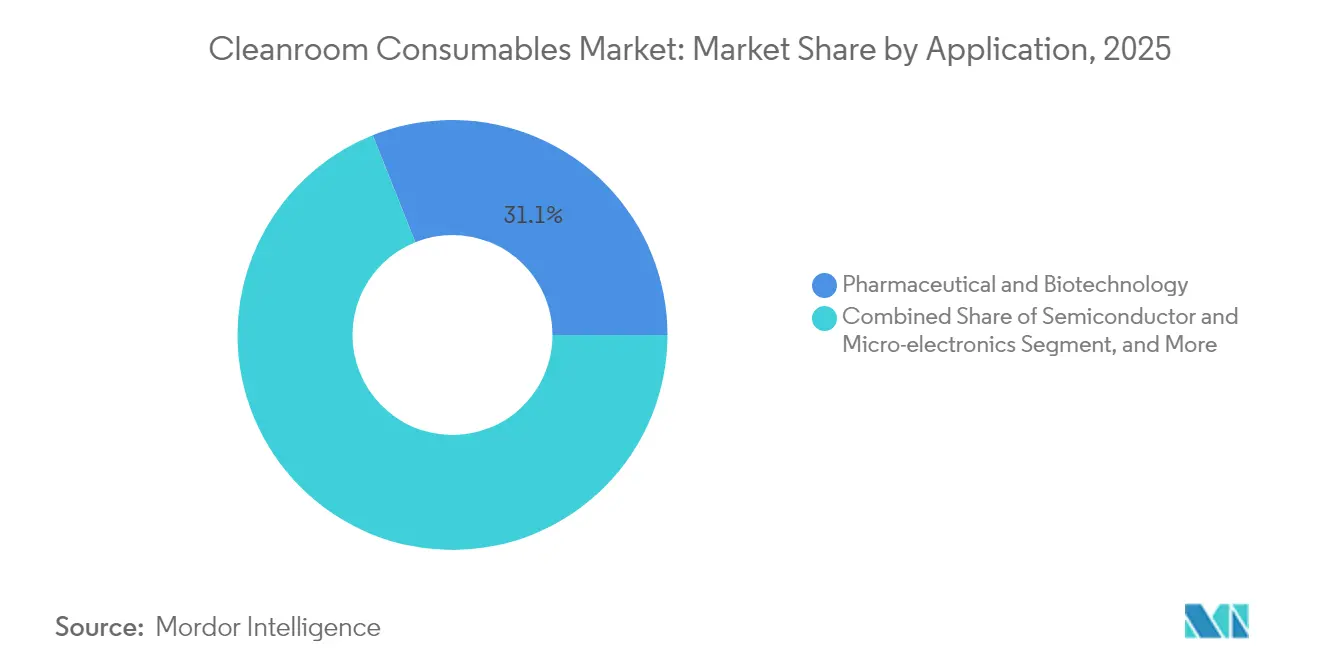
- By application, the pharmaceutical and biotechnology segment accounted for 31.05% of the cleanroom consumables market size in 2025, whereas automotive and battery manufacturing is projected to register the fastest 7.73% CAGR to 2031.
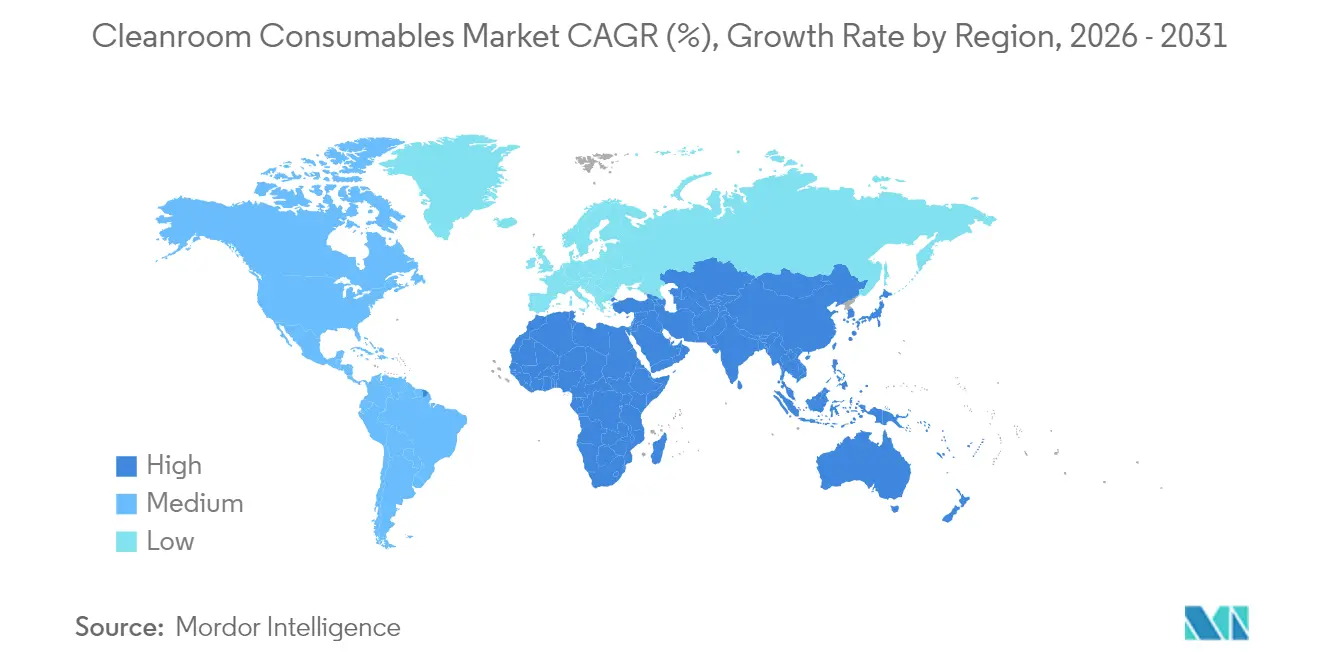
- By geography, Asia-Pacific commanded 41.35% revenue share in 2025, and South America is expected to post the highest 8.49% CAGR during the forecast period.
Note: Market size and forecast figures in this report are generated using Mordor Intelligence’s proprietary estimation framework, updated with the latest available data and insights as of 2026.
Global Cleanroom Consumables Market Trends and Insights
Drivers Impact Analysis*
| Driver | (~) % Impact on CAGR Forecast | Geographic Relevance | Impact Timeline |
|---|---|---|---|
| Semiconductor capacity expansion in Asia | +1.8% | Asia-Pacific core, spill-over to North America | Medium term (2-4 years) |
| Stringent EU GMP Annex 1 revisions | +1.5% | Europe primary, global adoption | Short term (≤ 2 years) |
| Ramp-up of cell and gene therapy suites | +1.2% | North America, expanding to Europe | Medium term (2-4 years) |
| Fast-track COVID-19 vaccine facilities | +0.9% | Emerging markets globally | Short term (≤ 2 years) |
| Electrification of automotive industry | +1.1% | Europe primary, China secondary | Long term (≥ 4 years) |
| Rising outsourced fill-finish services | +1.0% | Global, concentrated in CDMO hubs | Medium term (2-4 years) |
| Source: Mordor Intelligence | |||
Semiconductor capacity expansion in Asia driving ultra-low-particulate consumable demand
Global wafer-fab capacity is set to rise 6% in 2024 and 7% in 2025, hitting 33.7 million wafers per month, and advanced 5 nm nodes alone are on track for 13% growth in 2024. Asia-Pacific fabs require ISO Class 1-3 environments, amplifying demand for gloves, garments, and wipes engineered for sub-micron particulate removal. Chinese capacity is forecast to climb 14% by 2025, while Taiwan and South Korea boost leading-edge lines. Memory makers scaling high-bandwidth DRAM for AI workloads reinforce a steady pull for barrier-grade consumables across the cleanroom consumables market.
Stringent EU GMP Annex 1 revisions elevating sterile-grade apparel adoption
The 59-page revision, effective August 2023, mandates contamination-control strategies, zero bioburden in Grade A areas, and wider use of RABS isolators.[1]European Commission, “Guidelines for Good Manufacturing Practice for Medicinal Products for Human and Veterinary Use,” health.ec.europa.eu EU guidance prompts pharmaceutical sites worldwide to upgrade to validated disposable coveralls and aseptic wipes that meet microbial and particulate thresholds, shortening changeover times and easing documentation. Compliance timelines of one to two years have already catalyzed bulk orders for single-use gowns and pre-saturated wipers, reinforcing momentum within the cleanroom consumables market.
Ramp-up of cell and gene therapy suites requiring single-use wipes in North America
CDMO plant pipelines for viral-vector and autologous cell therapies, valued at USD 31.92 billion by 2032, rely on Grade C/D suites with rigorous segregation.[2]BioSpace, “Biopharmaceuticals Contract Manufacturing Market Size To Hit USD 31.92 Bn By 2032,” biospace.com Single-use polyester-cellulose wipes minimize cross-product carryover in multimodal facilities, while accelerated batch cycles raise consumption intensity per square foot. Such dynamics translate into structurally higher per-site spending on consumables, supporting the cleanroom consumables market expansion.
Electrification of automotive industry spurring battery cleanrooms in Europe
Gigafactory projects targeting lithium-ion pack output for electric vehicles call for ISO Class 5-8 cells and sub-1% relative humidity dry rooms. Battery plants from Spain to Scandinavia specify specialty gloves, antistatic mats, and ionic-extract-controlled wipes. With 4.5 million ft² under construction at Canada’s NextStar facility alone, European and North American vendors of contamination-control products are scaling output to meet emerging cleanroom consumables market demand.
Restraints Impact Analysis*
| Restraint | (∼) % Impact on CAGR Forecast | Geographic Relevance | Impact Timeline |
|---|---|---|---|
| Volatility in nitrile and latex raw-material prices | −0.8% | Global, acute in Asia-Pacific | Short term (≤ 2 years) |
| Energy-intensive laundering costs for reusable garments | −0.6% | Developed markets primarily | Medium term (2-4 years) |
| Complex multi-jurisdictional ISO 14644 certification for SMEs | −0.4% | Global, pronounced in emerging markets | Long term (≥ 4 years) |
| Limited availability of Class 1 laundry services in Africa and Oceania | −0.3% | Africa and Oceania | Long term (≥ 4 years) |
| Source: Mordor Intelligence | |||
Volatility in nitrile and latex raw-material prices impacting glove margins
Nitrile butadiene rubber (NBR) shortages led the U.S. government to issue supply waivers for federal glove purchases, confirming domestic supply gaps lasting until late 2025. Price spikes - Top Glove’s average selling price hit USD 70 per 1,000 pieces in 2024 - compress margins for distributors, complicating budgeting for high-volume semiconductor and pharma facilities. This uncertainty tempers order visibility within portions of the cleanroom consumables market.
Energy-intensive laundering costs curtailing reusable garment adoption
Life-cycle assessments show reusable coveralls demand 34% more process energy than HDPE disposables and 59% more than SMS polypropylene equivalents. A typical Class 1 laundry consumes high-pressure air showers, sterile packaging labor, and compliance audits, elevating the total cost of ownership. While CO₂ wash systems lower electricity and gas use by up to 60%, upfront capital outlays restrict uptake. These economics pivot many operators toward single-use garments, bolstering the cleanroom consumables market yet introducing waste-management challenges.
*Our forecasts treat driver/restraint impacts as directional, not additive. The impact forecasts reflect baseline growth, mix effects, and variable interactions.
Segment Analysis
By Product: Safety Consumables Lead Through Regulatory Compliance
Safety consumables delivered 56.85% revenue in 2025 and will grow at 7.21% CAGR through 2031. Gloves alone represented 39.35% of the safety segment and are on track for 7.42% CAGR, reflecting strict particulate limits in advanced nodes and aseptic suites. At the segment level, safety commanded 56.85% of the cleanroom consumables market size in 2025, while adhesive mats are forecast to widen their presence within cleaning consumables, expanding at 8.29% CAGR as entry-point contamination controls harden.
Disposable nitrile glove demand continues to outstrip NBR supply, as U.S. federal orders for 55.5 million boxes highlight persistent shortages. Coveralls and frocks benefit from Annex 1’s heightened barrier provisions that discourage textile permeation. Cleaning consumables account for roughly 35.00% of the cleanroom consumables market, with pre-saturated wipes holding a 42.30% share in that subset. Their convenience and cross-contamination safeguards resonate in cell-therapy work cells that require validated residue profiles. Niche stationery, such as ion-controlled journals and ESD-safe pens, safeguards lithography steppers and wafer-inspection stations from electrostatic excursions.


By Application: Pharmaceutical Dominance Amid Automotive Emergence
Pharmaceutical and biotechnology producers contributed 31.05% of 2025 revenue and maintain volume leadership thanks to Annex 1’s rigorous contamination-risk mandates. The sterile-manufacturing niche is progressing at a double-digit pace, and CDMOs scale single-use filling lines that trim turnaround times. Ready-to-use containers streamline small-batch biologics, boosting cleanroom consumables market penetration across supplier frameworks.
Automotive and battery operations record the quickest 7.73% CAGR, mirroring rapid EV adoption. Dry-room glove and wipe specifications focus on very-low outgassing and lithium-compatible material chemistries, prompting suppliers to introduce novel nitrile blends with reduced ionic extractables. Semiconductor fabrication holds a stable share, grounded in 6-7% annual wafer-fab capacity expansion and a record USD 137 billion in 300 mm equipment outlays by 2027. Medical-device lines adopt ISO 14644-5 gowning modules, widening demand for disposable head-to-toe ensembles that meet dual particulate and microbial limits.
Geography Analysis
Asia-Pacific contributed 41.35% of 2025 turnover, sustained by Chinese, Taiwanese, and Korean fabs that together represent the bulk of leading-edge capacity. China alone is slated for 14% capacity growth in 2025. Government incentives under India’s semiconductor mission funnel investment into new ISO Class 3 process halls, expanding the cleanroom consumables market footprint. Battery gigafactory roll-outs across Japan and Indonesia further thicken regional order pipelines for antistatic garments and ionic-filtered wipes.
North America ranks second, strengthening via domestic chip capacity gains funded through the CHIPS Act. Entegris’ planned Colorado Springs FOUP factory illustrates vertical integration investments that secure contamination-control supply chains. The region’s maturing cell-therapy cluster intensifies the flow of single-use gowns, gloves, and pre-saturated alcohol wipes that mitigate cross-batch vectors. A resilient regulatory environment inflates demand for third-party validated consumables that facilitate U.S. FDA and Health Canada inspections.
South America, though smaller, records the highest 8.49% CAGR to 2031 as Brazilian and Argentinian pharma plants align with WHO PIC/S guidance and EU authorizations. Cleanroom upgrades for biosimilar filling lines, alongside growing local semiconductor packaging interests, lift shipments of disposable coveralls and modular sticky mats. Europe sustains mid-single-digit growth, propelled by Annex 1 compliance and battery gigafactory programs in Germany, Spain, and Scandinavia. The Middle East and Africa exhibit gradual momentum hindered by scarce ISO Class 1 laundry capacity, pushing many operators toward imports of disposable kits and limiting local value capture in the cleanroom consumables market.

Regulatory Landscape
Cleanroom consumables demand is shaped by globally adopted cleanliness and contamination-control standards, led by the ISO 14644 series. ISO 14644-18:2023 formalizes assessment guidance for cleanroom consumables across particles, chemicals, and biocontamination, tightening qualification and documentation requirements for wipes, garments, gloves, and packaging that must support audits in regulated environments.
In 2026, additional standards and policy actions increased compliance complexity for electronics-led cleanrooms. ISO published ISO 14644-14:2026 (February 2026) for assessing equipment suitability by airborne particle concentration and ISO 14644-15:2026 (May 2026) for suitability by airborne chemical concentration, shifting more emphasis toward chemical cleanliness evidence for materials used in critical environments. Alongside these updates, European actions including Commission Implementing Regulation (EU) 2026/286 (February 2026) on exemptions tied to semiconductor manufacturing chillers using high-GWP fluorinated gases, and Ireland’s S.I. No. 110/2026 (April 2026) updating RoHS restrictions and exemptions for electrical and electronic equipment, add environmental and substance-compliance layers that affect material selection, labeling, and supplier qualification for cleanroom consumables used in semiconductor and electronics manufacturing.
Value Chain Analysis
The value chain starts with upstream petrochemical and specialty-material inputs, including nitrile butadiene rubber (for gloves), and polyester, polyethylene, and polypropylene (for wipes, garments, and packaging), along with adhesives, elastics, and ESD-control additives. Manufacturers then convert these into cleanroom-grade consumables through controlled-environment production, followed by sterilization or cleaning (as required), lot-level testing and documentation (CoA, particulate and extractables profiles), and clean packaging. Distribution is typically organized through direct OEM supply to large fabs and pharma or biotech manufacturers, supported by contamination-control specialists and industrial distributors that manage multi-site programs and qualification support.
Current chain dynamics show both scale-up and constraint points. Semiconductor ecosystem investment, including Applied Materials’ June 2026 announcement of a USD 500 million Singapore expansion to more than double local advanced cleanroom capacity, highlights how broader cleanroom infrastructure build-outs pull qualified consumables into the same qualification and supplier-audit cycles. At the same time, tightness in key high-purity inputs (for example, industry-reported high-purity CO2 shortages affecting inventories at major chipmakers) and geopolitical pressure on petroleum-derived polymer costs increase variability in lead times and landed costs for wipes, apparel, and packaging, which pushes buyers toward dual sourcing, regional manufacturing footprints, and tighter tier-2 visibility.
Competitive Landscape
The market shows moderate concentration. The top five vendors collectively represent an estimated 55-60% of global revenue, enabling price leverage but leaving room for niche specialists. Ansell’s USD 640 million purchase of Kimberly-Clark’s PPE unit augmented its Kimtech and KleenGuard brands, expanding portfolio coverage from ISO Class 3 critical gloves to Class 8 single-use apparel. Thermo Fisher’s USD 4.1 billion addition of Solventum’s purification arm bolsters filtration and single-use flow-path capacity, targeting biologics workflows.
Suppliers pursue material science differentiation; sub-0.5 µm-rated wipes with validated low NVR extractables answer EU and FDA scrutiny. Environmental metrics form a new battleground: several vendors now publish cradle-to-gate CO₂-equivalent footprints, appealing to sustainability scorecards. Regional manufacturing expansion continues, with glove-dipping lines under construction in Mexico to sidestep import tariffs and freight volatility. Digital traceability solutions - embedding QR-coded lot numbers on packaging - gain favor as regulators demand tighter chain-of-custody records within the cleanroom consumables market.
Cleanroom Consumables Industry Leaders
Kimberly-Clark Corporation
The Texwipe Company, LLC (Illinois Tool Works, Inc.)
Nitritex Ltd. (Ansell Limited)
Valutek Inc.
Azbil Corporation
- *Disclaimer: Major Players sorted in no particular order

Market Opportunities and Future Outlook
Standards-driven tightening of airborne molecular contamination (AMC) control and material suitability testing is creating opportunity for suppliers that can provide validated, low-extractables consumables with stronger documentation packages. In May 2026, SEMI released the F72-0526 revision for performance testing of AMC filtration units, specifying a minimum dynamic adsorption decay rate of 92% and setting an effective date of October 1, 2026. Taken with ISO 14644-14:2026 (February 2026) and ISO 14644-15:2026 (May 2026), this raises the bar for chemical cleanliness verification and traceability in cleanrooms, supporting differentiated offerings such as low-NVR wipes, low-ionic gloves for battery dry rooms, and packaging or labels built for chain-of-custody control.
Fab and advanced manufacturing expansions support higher consumption intensity across gloves, garments, wipes, and cleaning accessories, particularly where ISO Class 1-3 and humidity-controlled dry-room environments are in place. This investment cycle is visible in SK hynix’s February 2026 announcement of a 21.6 trillion KRW investment for the Yongin Semiconductor Cluster, with the first cleanroom opening moved up to February 2027, Applied Materials’ June 2026 USD 500 million Singapore expansion tied to advanced cleanroom capacity, and Intel’s July 2026 announcement of a 5 billion euro investment at its Leixlip campus in Ireland to expand manufacturing using existing cleanroom space for Intel 3 production. These projects expand the pull for qualified local supply, vendor-managed inventory programs, and sustainability-linked solutions (including recycling programs for selected PPE) as buyers weigh contamination performance, audit readiness, and waste-management requirements.
Recent Industry Developments
- June 2026: Applied Materials announced a USD 500 million investment in Singapore to expand manufacturing and R&D, more than doubling its local advanced cleanroom capacity. The added cleanroom footprint increases demand for qualified contamination-control materials used during build-out, tool installation, and ongoing operations. It also reinforces supplier focus on regional availability and lot-traceable consumables to support high-throughput equipment production.
- March 2025: Ansell commenced direct commercial management of Kimtech orders across North America and Europe, integrating contamination-control capabilities and programs linked to the acquired KCPPE portfolio. The move consolidated customer-facing supply, pricing, and service processes for a major cleanroom PPE brand. It strengthened bundle-based selling across gloves, apparel, and associated contamination-control services for regulated and high-specification cleanroom users.
- June 2024: Kimberly-Clark Professional launched the Kimtech Polaris nitrile exam glove for cleanroom and laboratory environments, highlighting a proprietary nitrile formulation and positioning it within the RightCycle program where available. The launch expanded differentiated glove options aimed at users balancing performance specifications with sustainability and waste-handling constraints. It also increased competitive pressure on suppliers to pair product performance claims with traceable program infrastructure and documentation.


Research Methodology Framework and Report Scope
Market Definition and Coverage
For this report, the cleanroom consumables market covers recurring-use items that help prevent contamination inside controlled environments, and the market sizing is based on revenue from product sales to end users.
Scope exclusions: it does not count cleanroom construction, HVAC and filtration equipment, monitoring instruments, or facility validation services.
Segmentation Overview
- By Product
- Safety Consumables
- Gloves
- Coveralls and Frocks
- Boot and Shoe Covers
- Bouffants and Hoods
- Face Masks and Goggles
- Other Safety Consumables
- Cleaning Consumables
- Pre-Saturated Wipes
- Dry Wipes
- Mops and Mop Buckets
- Squeegees and Wringers
- Validation Swabs
- Adhesive Mats
- Other Cleaning Consumables
- Cleanroom Stationery and Miscellaneous
- Papers and Notebooks
- Labels and Adhesive Pads
- Binders and Clipboards
- ESD-Safe Pens and Markers
- Other Stationery
- Safety Consumables
- By Application
- Semiconductor and Micro-electronics
- Pharmaceutical and Biotechnology Manufacturing
- Medical Device Production
- Food and Beverage Processing
- Aerospace and Defense Laboratories
- Automotive and Battery Manufacturing
- University and Government Research Labs
- By Geography
- North America
- United States
- Canada
- Mexico
- Europe
- Germany
- United Kingdom
- France
- Italy
- Spain
- Russia
- Rest of Europe
- Asia-Pacific
- China
- Japan
- South Korea
- India
- ASEAN
- Rest of Asia-Pacific
- South America
- Brazil
- Argentina
- Rest of South America
- Middle East
- Saudi Arabia
- United Arab Emirates
- Turkey
- Rest of Middle East
- Africa
- South Africa
- Rest of Africa
- North America
Data Sources, Market Sizing, and Validation
Desk Research
Desk research was used to set market boundaries, build early demand signals, and sanity-check regional splits before we spoke with industry participants. We leaned on public sources that describe contamination control requirements and regulated manufacturing activity, including FDA and EMA guidance for sterile production, ISO publications around cleanroom classes, and USP chapters that influence gowning and cleaning practices. We also reviewed trade and production signals using sources such as UN Comtrade for relevant imports and exports, plus OECD and World Bank indicators for manufacturing output and health spending context.
To keep the model grounded in what companies can actually supply, we reviewed company annual reports, investor presentations, product catalogs, and press releases for pricing cues and portfolio coverage. In a few places, paid subscriptions were used only for company financials and historical news screening, and patent databases were checked to understand material and fabric innovation trends that can shift average selling prices. The desk sources named above are illustrative, and many other public documents and datasets were also referenced for data collection, validation, and research clarification.
Primary Interviews and Surveys
Primary interviews and surveys focused on validating which consumables are purchased routinely, how usage intensity changes by cleanroom class, and what pricing patterns look like across industries such as pharmaceuticals, biotech, and electronics. We spoke with a mix of manufacturers, distributors, and end-user procurement and quality leaders across major regions, so the desk research assumptions could be adjusted based on real purchasing behavior and then confirmed. When gaps showed up, respondents were re-contacted to determine whether the change reflected a genuine shift, for example from reusable to disposable apparel, or just a short-term buying cycle effect.
Distribution of primary research fieldwork respondents
| Company type | Respondent position | Region |
|---|---|---|
| Top tier: 39% | CXOs: 14% | APAC: 48% |
| Mid tier: 44% | Functional/Unit leaders: 34% | EMEA: 29% |
| Smaller Players: 17% | Managers: 52% | Americas: 23% |
Market-Sizing & Forecasting
The core model used a top-down and bottom-up combination approach. We reconstructed regulated manufacturing output and cleanroom footprint indicators by region, then translated those into annual consumable demand using usage rates and replacement cycles. We corroborated totals with targeted bottom-up checks, including sampled price-per-unit for key items multiplied by estimated consumption volumes, followed by distributor channel checks to keep the totals realistic.
The inputs that mattered most were cleanroom class mix, production intensity in pharmaceuticals and biotechnology, semiconductor and electronics fab activity, the balance of sterile versus non-sterile processes, and average selling price movement for high-run items such as wipes, gloves, masks, and sterile apparel. When data was thin, we used a proxy and then tightened assumptions using interview feedback, rather than forcing false precision.
For forecasting, we used scenario analysis so the outlook could flex with variables experts highlighted, including capacity additions in regulated manufacturing, shifts in single-use adoption, and changes in compliance expectations that raise consumption per cleanroom worker. We applied consistent currency timing and inflation assumptions to keep year-to-year comparisons consistent.
Data Validation & Update Cycle
Outputs were checked in several ways before sign-off, including variance checks across regions, cross-validation against independent activity indicators, and logical tests on implied spend per cleanroom employee and per facility footprint. If a result appeared unusual, we traced the issue back to the input level and reviewed assumptions again with the notes from the primary discussions.
The work is reviewed in steps, starting with analyst peer review and followed by a final model and narrative check to confirm that the sizing story matches the evidence. Reports are refreshed annually, and interim updates are made when material events occur that can shift demand or pricing. Before delivery, a final review pass is completed so clients receive the latest updated view.
Mordor Intelligence's Cleanroom Consumables Market Size Versus Other Published Estimates
Published market sizes for cleanroom consumables often differ because the boundary around what counts as a consumable can change, and because the assumed end-user mix varies by study. Differences also come from how pricing is handled, since some models hold older average prices while others assume a faster shift toward sterile and single-use items.
By tracking cleanroom class-driven usage rates and refreshing average selling price ladders using interview-validated ranges, Mordor Intelligence keeps the total tied to recurring purchases like wipes, gloves, masks, and sterile apparel, rather than mixing in cleanroom technology spending.
Benchmark comparison
| Source | Market Size | Gaps in Research Methodology |
|---|---|---|
| Mordor Intelligence | USD 6.01 B (2026) | |
| Trade Journal A | USD 7.50 B (2023) | Uses a broader scope labeled as cleanroom products, which can pull in non-consumable items and raises the total. It also mixes a different base year and does not clearly separate sterile from non-sterile purchasing patterns. |
| Regional Consultancy B | USD 13.75 B (2024) | Appears to apply a wider end-user and product list with less visible checks on per-worker usage intensity, which can inflate demand. The jump is also influenced by a later reference year and a faster assumed price progression for disposable items. |
The table shows that the spread is mostly explained by scope choices and by how usage and prices are refreshed over time. When the same cleanroom-only boundary is applied and inputs like class mix, replacement cycles, and price ranges are kept consistent, the resulting number becomes easier to trace and repeat.


Key Questions Answered in the Report
What is the current value of the cleanroom consumables market?
The market is valued at USD 6.01 billion in 2026 and is forecast to reach USD 8.51 billion by 2031, growing at a 7.18% CAGR.
Which product category leads global demand?
Safety consumables, especially gloves and coveralls, accounted for 56.85% revenue in 2025 and remain the largest category.
Why is Asia-Pacific the largest regional market?
High-density semiconductor fabs and expanding battery gigafactories underpin Asia-Pacific’s 41.35% share, while government incentives accelerate local supply chains.
How have EU GMP Annex 1 revisions affected purchasing patterns?
The August 2023 revision compels pharmaceutical producers to switch to sterile-grade, single-use apparel and wipes, boosting global demand for validated disposables.
What is the biggest restraint on market growth?
Volatile prices for nitrile and latex feedstocks compress glove margins and create budgeting uncertainty, particularly in Asia-Pacific where most gloves are produced.
Which application segment is growing fastest?
Automotive and battery manufacturing cleanrooms exhibit a 7.73% CAGR as global EV demand drives new lithium-ion cell plants requiring stringent contamination control.
Page last updated on:






