
Cleaning Robot Market Size and Share
Market Overview
| Study Period | 2020 - 2031 |
|---|---|
| Market Size (2026) | USD 19.98 Billion |
| Market Size (2031) | USD 38.52 Billion |
| Growth Rate (2026 - 2031) | 14.38% CAGR |
| Fastest Growing Market | North America |
| Largest Market | Asia Pacific |
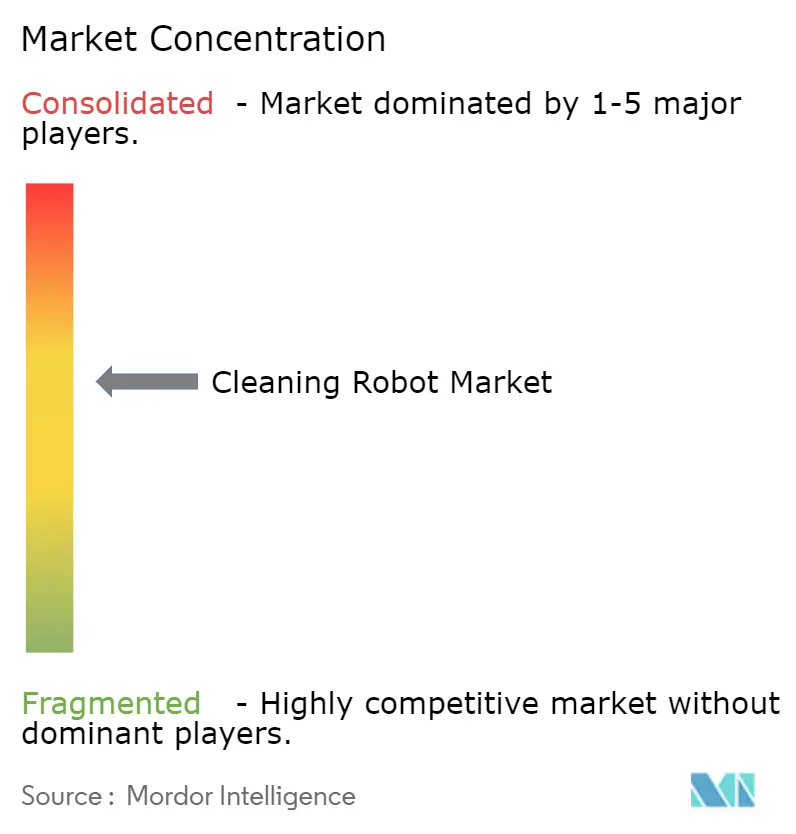
| Market Concentration | Medium |
Major Players *Disclaimer: Major Players sorted in no particular order Image © Mordor Intelligence. Reuse requires attribution under CC BY 4.0. | |
Cleaning Robot Market Analysis by Mordor Intelligence
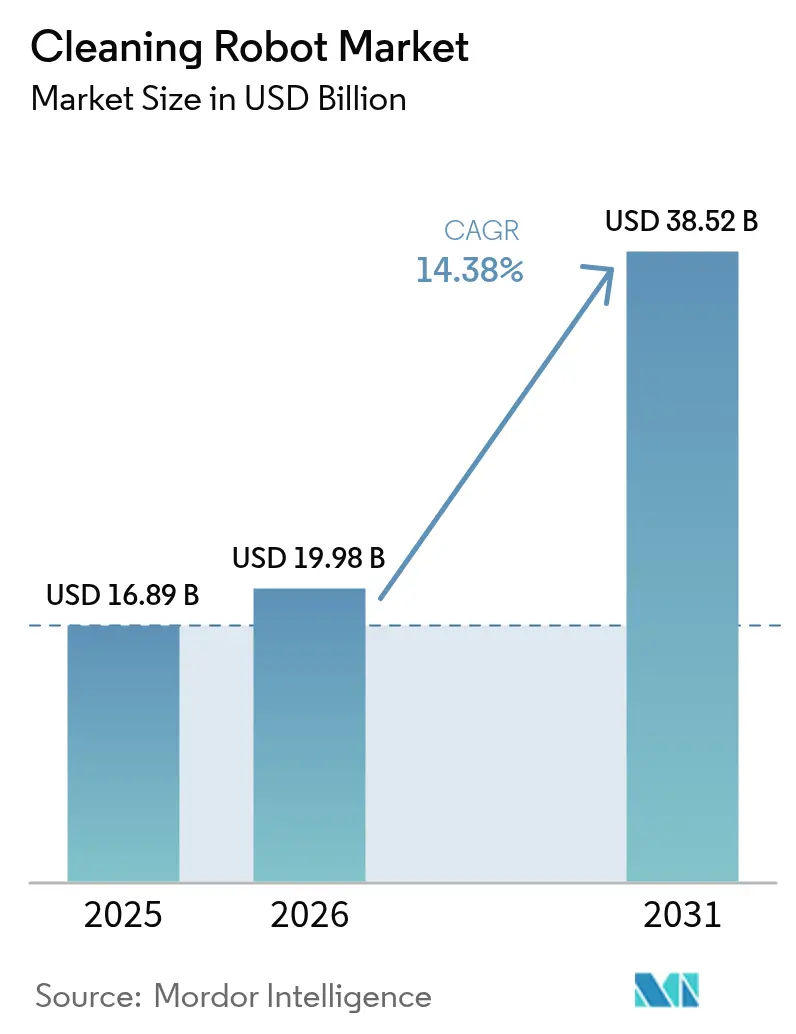
The cleaning robot market size is projected to be USD 16.89 billion in 2025, USD 19.68 billion in 2026, and reach USD 38.52 billion by 2031, growing at a CAGR of 14.38% from 2026 to 2031. Structural labor shortages, post-pandemic hygiene mandates, and rapid smart-home adoption keep demand elevated for both residential and professional robots. Falling LiDAR and vision-sensor average selling prices compress bill-of-materials costs, enabling mid-tier models to offer premium navigation features and drawing price-sensitive buyers into the cleaning robot market. Facility-management firms are turning to robots-as-a-service to reclassify janitorial spending as an operating lease, unlocking budget headroom for autonomous systems. Competitive intensity is increasing as vertically integrated Chinese manufacturers undercut incumbents on price while matching feature parity, placing sustained pressure on gross margins throughout the cleaning robot market.
Key Report Takeaways
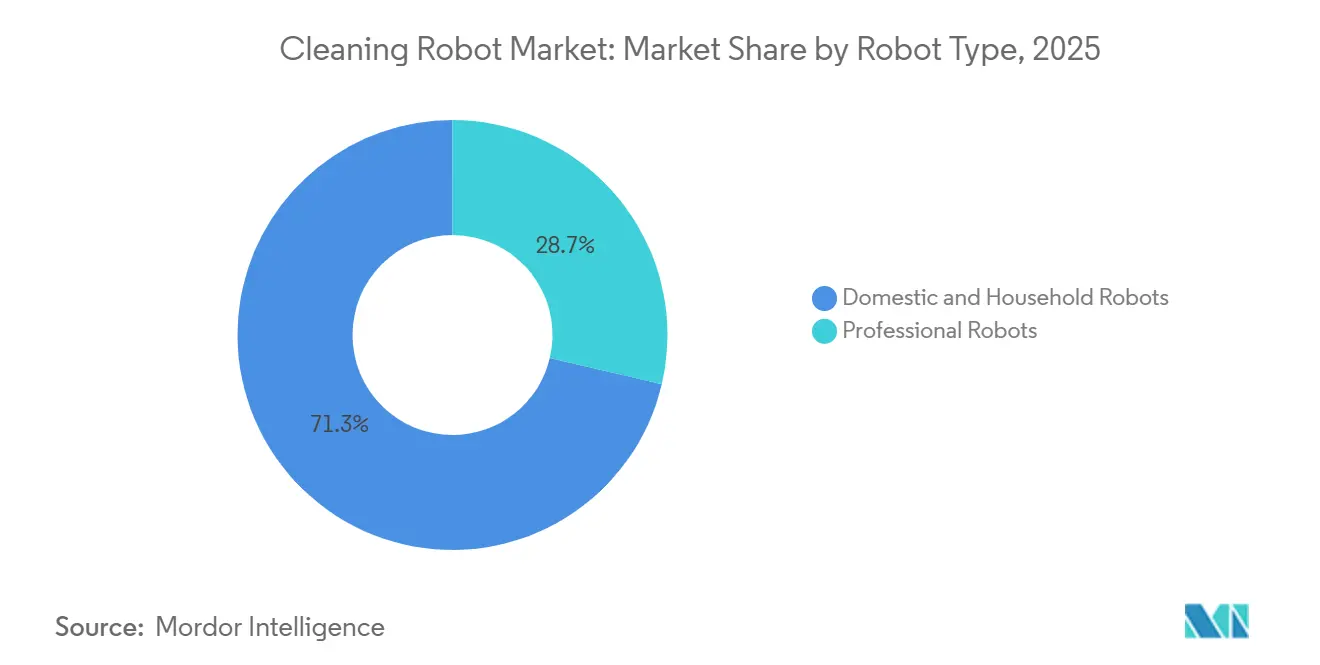
- By robot type, household units led with 71.32% of the cleaning robot market share in 2025, while professional robots are forecast to advance at a 15.23% CAGR through 2031.
- By end-user, the residential segment accounted for a 57.46% share of the cleaning robot market size in 2025, whereas the commercial segment is projected to expand at a 14.87% CAGR over 2026-2031.
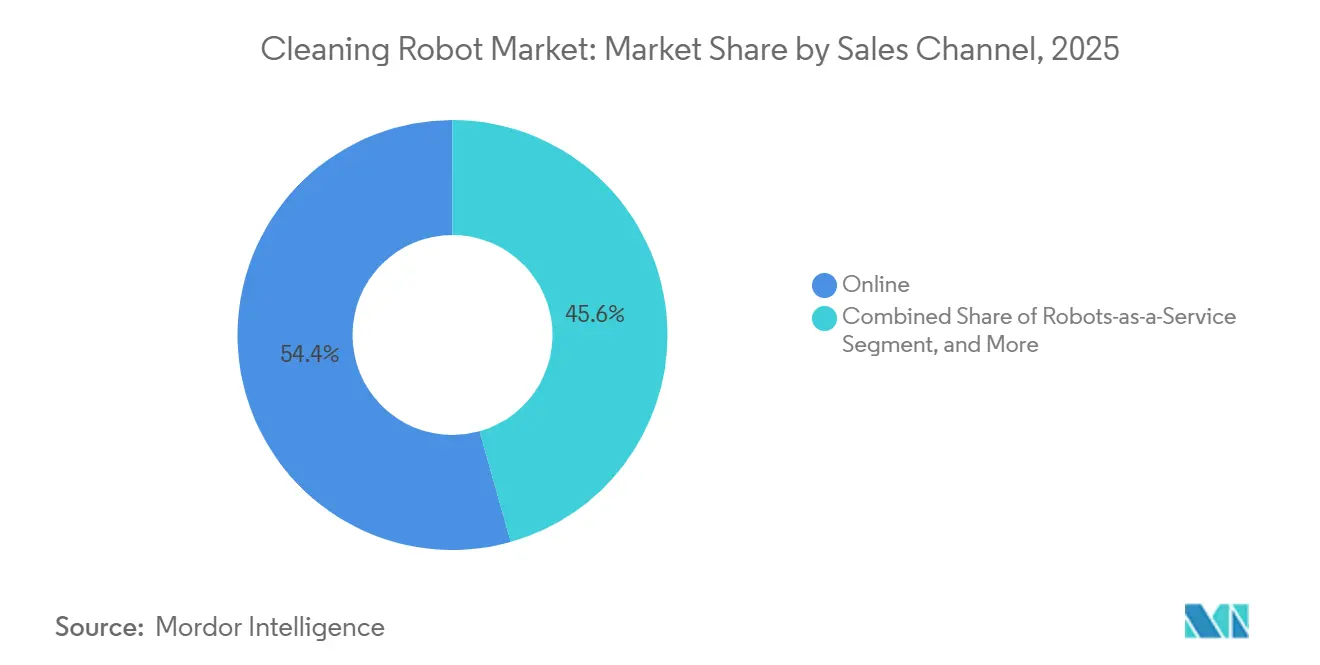
- By sales channel, online outlets captured 54.37% revenue share in 2025; robots-as-a-service is the fastest-growing channel at a 15.76% CAGR during the forecast period.
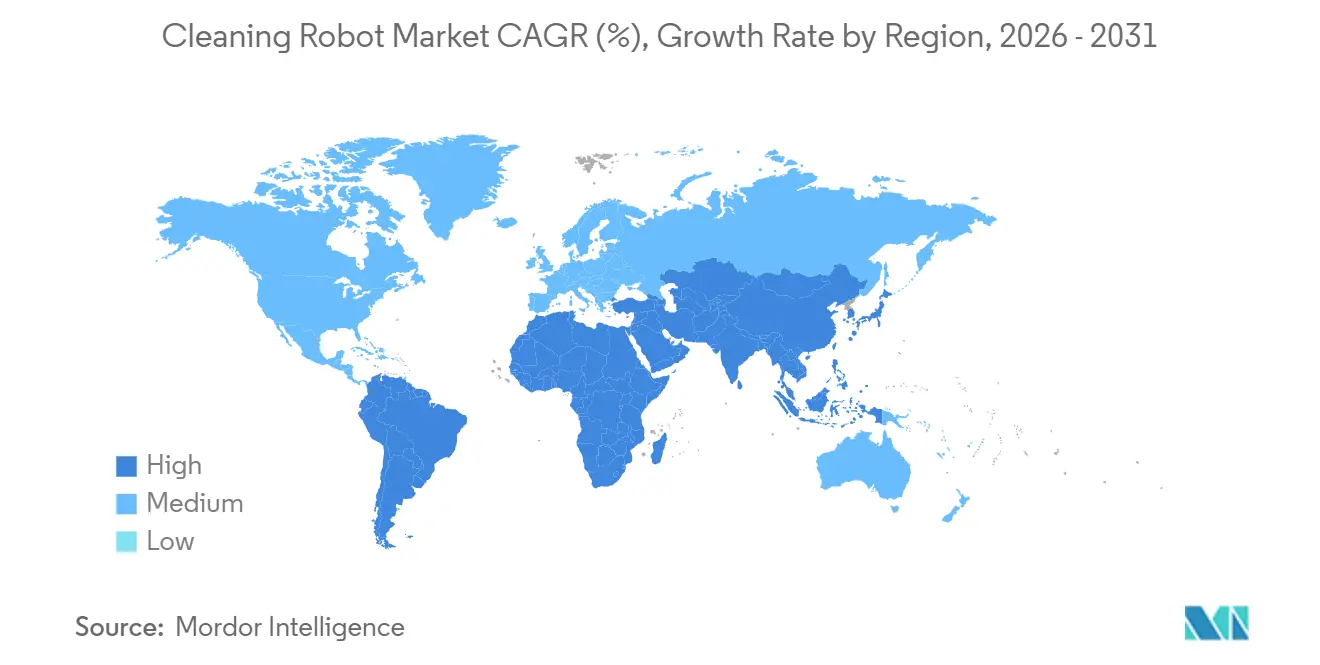
- By geography, North America held a 39.41% revenue share in 2025, yet Asia-Pacific is expected to post the highest regional CAGR at 15.07% to 2031.
Note: Market size and forecast figures in this report are generated using Mordor Intelligence’s proprietary estimation framework, updated with the latest available data and insights as of 2026.
Global Cleaning Robot Market Trends and Insights
Drivers Impact Analysis*
| Driver | (~) % Impact on CAGR Forecast | Geographic Relevance | Impact Timeline |
|---|---|---|---|
| Rising Post-Pandemic Hygiene Standards In Commercial Spaces | +3.2% | Global, most visible in North America, Europe, and Asia-Pacific healthcare and hospitality properties | Medium term (2-4 years) |
| Rapid Smart-Home Penetration And Disposable-Income Growth | +2.8% | North America and Europe mature markets, Asia-Pacific emerging middle class | Long term (≥ 4 years) |
| Falling LiDAR And Sensor-Suite ASPs Reduce BOM Cost | +2.5% | Global, with manufacturing concentration in China | Short term (≤ 2 years) |
| Facility-Management Contracts Shifting To Robots-As-A-Service | +2.1% | North America and Europe commercial real estate, extending to Middle East and Asia-Pacific | Medium term (2-4 years) |
| E-Commerce Channel Scaling Accelerates Global Reach | +1.9% | Global, highest penetration in urban North America, Europe, and Asia-Pacific | Medium term (2-4 years) |
| Government Procurement Of UV-Disinfection Robots For Public Infrastructure | +1.3% | Asia-Pacific (Singapore, Japan, South Korea) and Middle East | Short term (≤ 2 years) |
| Source: Mordor Intelligence | |||


Rising Post-Pandemic Hygiene Standards in Commercial Spaces
Airports, hotels, and hospitals now treat continuous, highly visible cleaning as a non-negotiable amenity. At London Heathrow Airport, 50 autonomous scrubbers deployed in 2025 delivered a 40% reduction in labor hours while enabling 24/7 floor sanitization.[1]Mitie Group, “Mitie Deploys Autonomous Cleaning Robots at Heathrow Airport,” mitie.com Facility managers view audit-ready disinfection logs and pathogen-removal metrics as differentiators when bidding for corporate tenants. The premium commanded by professional cleaning robots, typically priced between USD 30,000 and USD 120,000, is increasingly justified by payback periods of under 18 months in high-traffic venues. Heightened infection-control standards lock in recurring demand for UV-C and electrostatic-spray variants, ensuring sustained growth in the cleaning robot market. Vendors that integrate compliance reporting directly into the fleet-management dashboard strengthen their value proposition to risk-averse operators.
Rapid Smart-Home Penetration and Disposable-Income Growth
Robot vacuums have graduated from novelty to necessity in North American and Western European households, a shift mirrored by rising ownership in Chinese and Southeast Asian urban centers. At IFA 2025, 94% of new smart-home cleaning launches were robotic vacuums.[2]IFA Berlin, “IFA 2025 Smart Home Product Launches,” ifa-berlin.com Parks Associates reported that 42% of U.S. homes owned at least one smart-home device in 2024, with robot vacuums ranking third in adoption. Feature innovation, AI obstacle avoidance, self-emptying docks, and combined vacuum-mop capability, encourages replacement purchases every three to four years. Disposable-income gains in Asia-Pacific expand the buyer pool, with units priced between USD 300 and USD 800 now within reach of the growing middle class. This demographic tailwind sustains double-digit unit growth for the cleaning robot market even as mature regions plateau.
Falling LiDAR and Sensor ASPs Reduce Bill of Materials Cost
Automotive investment in solid-state LiDAR has collapsed component pricing for adjacent robotics applications. Hesai Technology cut LiDAR costs by 99.5% in eight years, targeting USD 200 per module by late 2025. IEEE research demonstrated low-cost LiDAR SLAM capable of sub-USD 50 bill-of-materials.[3]IEEE, “Low-Cost LiDAR SLAM for Mobile Robotics,” ieeexplore.ieee.org These savings allow sub-USD 500 home robots to incorporate mapping-grade sensors once reserved for premium SKUs, leveling the competitive playing field. For professional models, the same cost curve enables dual-LiDAR plus vision stacks that navigate large-format retail and warehouse spaces without costly infrastructure modifications. Reduced hardware differentials shift competition toward software intelligence and after-sales service, intensifying the race for proprietary AI navigation algorithms within the cleaning robot market.
Facility-Management Contracts Shifting to Robots-As-A-Service
Enterprises increasingly treat cleaning as a subscription rather than a capital purchase. In 2025, SoftBank Robotics and HITEK AI launched Middle East leasing packages starting at USD 1,200 per month, covering hardware, maintenance, and performance guarantees.[4]SoftBank Robotics, “Robots-as-a-Service Launch in UAE and Saudi Arabia,” softbankrobotics.com Australian provider Intelliclean disclosed that 35% of new contracts in 2024 included robots-as-a-service clauses, nearly triple the 2022 level.[5]Intelliclean, “RaaS Contract Growth in Australian Facilities,” intelliclean.com.au The model unlocks adoption among small and medium-sized enterprises that lack upfront budgets, thereby expanding the addressable cleaning robot market. Predictable operating expenses appeal to publicly traded real-estate investment trusts eager to shield EBITDA from wage inflation. Manufacturers benefit from recurring software fees, boosting lifetime customer value and smoothing revenue cyclicality.
Restraints Impact Analysis*
| Restraint | (~) % Impact on CAGR Forecast | Geographic Relevance | Impact Timeline |
|---|---|---|---|
| High Upfront Cost Versus Conventional Equipment | -1.8% | Global, particularly price-sensitive South America, Africa, and Southeast Asia | Short term (≤ 2 years) |
| Data-Privacy Concerns Over Camera/VSLAM Mapping | -0.9% | Europe, North America, select Asia-Pacific markets | Medium term (2-4 years) |
| Supply-Chain Fragility For Solid-State LiDAR Components | -0.6% | Global, concentration in Taiwan and South Korea fabs | Short term (≤ 2 years) |
| Emerging Trade Tariffs On Chinese Robot Exports | -1.1% | North America and Europe import markets | Medium term (2-4 years) |
| Source: Mordor Intelligence | |||
High Upfront Cost Versus Conventional Equipment
Professional robots often carry price tags ten to forty times higher than manual scrubbers, creating sticker shock for budget-constrained operators. While robots-as-a-service spreads payments over time, hidden expenses, consumables, software subscriptions, and periodic recalibration, add up to 25% per year to total cost of ownership. The hurdle is most acute in South America and Africa, where household and enterprise purchasing power lags developed regions. Vendors bundle financing and predictive-maintenance guarantees to soften the blow, yet many facilities delay adoption until component costs fall further, tempering near-term growth in the cleaning robot market.
Data-Privacy Concerns Over Camera/VSLAM Mapping
Vision-based mapping raises regulatory red flags in jurisdictions with strict privacy regimes. Brain Corp’s 2024 whitepaper described edge anonymization to comply with GDPR, but many competitors still transmit raw video to the cloud.[6]Brain Corp, “GDPR Compliance for Autonomous Mobile Robots,” braincorp.com The U.K. Information Commissioner’s Office clarified in 2025 that camera-equipped robot vacuums fall under surveillance regulations, requiring explicit consent. A 2024 data breach involving leaked interior images eroded consumer trust and triggered a class-action settlement. Manufacturers now tout LiDAR-only designs or on-device processing as privacy-centric differentiators, yet added engineering complexity can raise bill-of-materials cost, constraining margins within the cleaning robot market.
*Our forecasts treat driver/restraint impacts as directional, not additive. The impact forecasts reflect baseline growth, mix effects, and variable interactions.
Segment Analysis
By Robot Type: Household Dominance Masks Professional Surge
Domestic robots accounted for 71.32% of revenue in 2025, reflecting their entrenched status as smart-home staples, but professional units are forecast to outpace them at a 15.23% CAGR to 2031. The vacuum sub-segment remains the cornerstone, benefiting from self-emptying docks and AI obstacle avoidance that spur upgrade cycles. Pool cleaners form a high-margin niche as solar-powered designs slash electricity use by up to 80%. ECOVACS has sold 1.5 million window-cleaning units cumulatively and holds 278 patents in suction and edge detection. Lawn-mowing robots equipped with RTK-GPS are scaling in suburban markets, with commercial models such as Husqvarna CEORA priced at EUR 15,000-20,000 (USD 16,950-22,600).
Professional robots, though smaller in unit volume, deliver higher revenue per device and deeper workflow integration. Floor-scrubber fleets connect to facility dashboards, covering 20,000 square feet per charge and sending real-time utilization metrics. UV-C disinfection units, now routine in Japanese and South Korean hospitals, achieve 99.9% pathogen reduction in 15-minute cycles. Tank-cleaning robots priced between USD 50,000 and USD 200,000 minimize confined-space entry risks in oil, chemical, and water utilities. Subscription models are accelerating adoption: the International Federation of Robotics recorded a 31% jump in robots-as-a-service fleets in 2024, underscoring the structural shift toward pay-per-use economics.

By End-User: Commercial Velocity Challenges Residential Incumbency
Residential buyers held 57.46% of the cleaning robot market in 2025, buoyed by North American and European penetration, but commercial demand is set to climb quickly at a 14.87% CAGR through 2031. Hotels pilot corridor-cleaning robots that trimmed labor hours by 30% while boosting guest satisfaction, according to field trials by Marriott International. Retail malls deploy overnight scrubbers to maintain glossy surfaces linked to higher shopper dwell time. Healthcare facilities integrate UV-C robots into terminal-cleaning protocols, cutting hospital-acquired infections by 22% in controlled studies.
Airports such as Heathrow now run fleets around the clock, capitalizing on multi-sensor navigation that avoids passengers and trolleys. Corporate offices accelerated adoption as cleaning-staff vacancies reached 20-30% in major metro areas, compelling facilities to fill gaps with automation. Industrial plants deploy ruggedized units that integrate with warehouse-management systems to steer clear of forklifts and autonomous mobile robots, creating a cooperative multi-robot environment. On the residential side, next-generation products unveiled at CES 2026, Roborock Saros 20 with a retractable arm and Dreame X60 Max Ultra with stair-climbing ability, target specific pain points, sustaining replacement cycles even as first-time purchase growth moderates.
By Sales Channel: Online Supremacy Meets Robots-as-a-Service (RaaS)Disruption
E-commerce captured 54.37% of 2025 revenue as buyers gravitated toward price transparency and door-step fulfillment. Parks Associates found that 70% of U.S. robot vacuum purchases occurred online in 2024. Direct-to-consumer brands leverage video explainers and influencer reviews to compress the sales funnel, while Chinese platforms offer same-day delivery and installment plans that democratize access to mid-tier models. Offline big-box retailers still matter for hands-on demos but surrendered three percentage points of share between 2023 and 2025.
Robots-as-a-service is the fastest-growing channel, rising at a 15.76% CAGR as enterprises convert capex into opex. SoftBank Robotics and HITEK AI’s Middle East launch illustrates regional appetite for bundled performance guarantees. Intelliclean tripled its RaaS contract mix in two years, evidencing momentum in developed Asia-Pacific. Manufacturers monetize recurring software subscriptions for fleet management and predictive maintenance, elevating lifetime gross margin beyond one-time hardware sales. For professional buyers, distributors such as Tennant and Nilfisk continue to add value through on-site integration, operator training, and 24/7 technical support.

Geography Analysis
North America generated 39.41% of 2025 revenue, underpinned by early smart-home adoption and stringent workplace-safety codes. The United States leads, with 42% household smart-home penetration in 2024 and robot vacuums ranking third in ownership, while Canada’s infection-control building codes spur UV-robot uptake. Mexico’s export-oriented manufacturing sector installs autonomous scrubbers to meet ISO 14001 compliance. Yet escalating tariffs on Chinese robots inflate retail prices, pressuring elasticity and nudging some buyers toward refurbished units or subscription models.
Asia-Pacific is expected to record the fastest 15.07% CAGR, fueled by urbanization and rising disposable incomes. Chinese giants Ecovacs and Roborock posted combined 2024 revenue exceeding USD 1.09 billion at prevailing exchange rates, underscoring domestic scale. Japan earmarked JPY 5 billion (USD 45.5 million) in subsidies for hospital UV-robot purchases in 2025. India’s e-commerce growth opens tier-2 cities, while Singapore’s ROBIN program showed a 60% pathogen-count reduction in public transport hubs. South Korea and Australia boast high per-capita ownership, aided by compact living spaces and tech-savvy consumers.
Europe, South America, Middle East, and Africa round out the cleaning robot market. Europe’s GDPR drives demand for on-device mapping, a boon for hybrid LiDAR-plus-vision systems from regional leaders. The United Kingdom’s window-robot segment reached GBP 64.21 million (USD 73.2 million) in 2025. German and French automakers deploy shop-floor robots for occupational safety compliance. South America remains highly price-sensitive, leading distributors to import mid-tier Chinese models with installment financing. Middle Eastern sovereign funds finance public-space fleets, while Africa’s nascent adoption is visible in South African malls and Nigerian airports despite infrastructural challenges.

Regulatory Landscape
Cleaning robots sit at the intersection of machinery requirements and AI-related governance, which is pushing vendors toward dual compliance in major markets. In the European Union, the EU AI Act (Regulation (EU) 2024/1689) and machinery-safety conformity pathways introduce requirements around risk management, documentation, and controls for autonomous behavior, particularly where camera and sensor-fusion navigation are used in public or workplace settings. Safety standards for consumer and service robots are also tightening, including ANSI/CAN/UL 3300:2024 (published in May 2024) and household-robot performance and safety specifications such as EN IEC/ASTM 62885-7:2021/A1:2023.
In the United States, product safety enforcement and standard-setting activity has increased focus on battery and physical-interaction hazards in robotic products. The U.S. Consumer Product Safety Commission (CPSC) has issued recalls of cordless robotic pool vacuums linked to overheating and fire risks, including Wybotics in April 2026 and Aiper in March 2025, underscoring the need for stronger battery management, charging controls, and traceability. China continues to advance domestic standardization for service robots through GB/T requirements, supporting procurement readiness and pushing manufacturers to align documentation, testing, and cybersecurity practices for regulated commercial deployments.
Value Chain Analysis
The value chain spans component suppliers (LiDAR and vision sensors, BLDC motors, batteries/BMS, wheels and drive trains, pumps and fluidics for mopping, and embedded compute), ODM/OEM manufacturing and final assembly, software layers (navigation, obstacle avoidance, fleet management, cybersecurity), and downstream channels including online D2C, offline retail and distributors, and robots-as-a-service providers for commercial fleets. Cost and availability of sensor suites and battery subsystems materially influence bill-of-materials and reliability, while recurring software and service contracts (fleet dashboards, disinfection logs, predictive maintenance, and remote support) are increasingly central to lifetime economics in professional robots.
Manufacturing and sourcing are highly concentrated in Chinese industrial clusters, with the Suzhou-Shenzhen-Shanghai corridor supporting fast iteration cycles and scale output. At the same time, this concentration increases exposure to tariffs and specific component bottlenecks, such as solid-state LiDAR. Distribution for professional units often runs through established cleaning-equipment ecosystems for training, integration, and service coverage, while residential volumes move heavily through e-commerce with rapid model refreshes. On the vendor side, restructuring among incumbents has shifted supplier and channel dynamics, highlighted by iRobot filing for Chapter 11 protection in December 2025, while Chinese brands continue to rely on vertically integrated supply chains that compress time-to-market and price points.
Competitive Landscape
The top five vendors, iRobot, Ecovacs, Roborock, Dreame, and SharkNinja, command roughly 60% of the domestic cleaning robot market, indicating moderate concentration. iRobot’s aborted sale to Amazon in 2024 triggered restructuring, workforce cuts, and a 20% revenue slide, highlighting exposure to mature Western demand. Chinese challengers exploit vertical integration, from LiDAR fabrication to AI chipset design, to compress price points and erode incumbent margins. Roborock’s Q3 2024 revenue grew 26% year-over-year as it diversified into lawn-mowing and window-cleaning categories.
Innovation is tilting toward software differentiation. Narwal’s Flow 2 rotates fresh water every 10 minutes, solving hygiene complaints about stagnant mop reservoirs. Dreame’s X60 Max Ultra adds stair-climbing to address multi-level residences. Friendly Robots introduced a USD 29-per-month subscription, swapping units every two years to keep features current, a model targeting price-sensitive consumers.
Enterprise clients increasingly demand ISO 27001 certification and GDPR compliance, narrowing the vendor shortlist to companies with robust cybersecurity. Regional specialists such as Avidbots and Gaussian Robotics capture vertical niches, airport concourses, large-format retail, by bundling site surveys and integration services. Mergers and partnerships are accelerating as players seek scale and data to refine navigation algorithms, setting the stage for further consolidation within the cleaning robot market.
Cleaning Robot Industry Leaders
iRobot Corporation
Ecovacs Robotics Co., Ltd.
Roborock Technology Co., Ltd.
Neato Robotics Inc.
SharkNinja Operating LLC
- *Disclaimer: Major Players sorted in no particular order

Market Opportunities and Future Outlook
Commercial cleaning robots are moving toward higher autonomy and lower-touch operation, creating whitespace in software-defined performance and fleet optimization rather than pure hardware differentiation. Brain Corp releasing BrainOS Clean 2.0 with SelfPath AI (March 2026) for Tennant Company floor-cleaning robots points to demand for systems that generate routes autonomously and reduce manual setup, especially in dynamic environments such as retail and transportation hubs. Tennant expanding autonomous portfolios with the X16 SWEEP (April 2026) reinforces opportunities around multi-shift industrial sweeping, automated docking, and analytics that translate cleaning into measurable operational outcomes.
In residential and light commercial, product roadmaps are broadening beyond basic vacuuming into integrated wet-and-dry and stain-treatment workflows, supporting premiumization and new category entry. Dyson entering wet-and-dry robotic floor cleaning with Spot+Scrub Ai (March 2026) and ECOVACS introducing DEEBOT X12 OmniCyclone with FocusJet stain pre-dissolving and an OMNI station (April 2026) show active investment in end-to-end maintenance automation and specialized cleaning performance. Additional whitespace is visible in purpose-built automation for high-frequency hygiene areas, exemplified by Primech Holdings preparing Hytron for mass production after CES 2026 demonstrations and securing a 200-unit fleet commitment for Hong Kong and Macau, which supports demand for dedicated restroom-cleaning robots paired with deployable service models.
Recent Industry Developments
- July 2026: iRobot announced the Roomba Electro Plus 5-in-1 disinfecting hard floor cleaner alongside a new generation of Roomba robots. The launch broadened iRobot's floor-care ecosystem beyond robot-only offerings and increased emphasis on bundled cleaning workflows and consumable-compatible disinfection in the home segment.
- May 2026: ECOVACS expanded into pool care with the ULTRAMARINE P1 robotic pool cleaner. This extended the company's addressable cleaning footprint beyond indoor floor care and deepened its multi-category portfolio strategy across household cleaning applications.
- February 2026: iRobot announced a strategic distribution partnership with a major retailer to expand Roomba and Braava adoption in North America and Europe, enabling tighter after-sales service and integrated bundles. The arrangement strengthens channel reach and accelerates rollout of connected cleaning ecosystems.


Research Methodology Framework and Report Scope
Market Definition and Coverage
This market covers revenue generated from cleaning robots that automate cleaning tasks with limited human input across home, commercial, and industrial settings. It includes products used for floors, pools, windows, lawns, and specialized professional cleaning where the robot is the cleaning device being sold or delivered as a service.
Scope exclusions: We exclude general-purpose robots and non-robotic cleaning equipment, along with spare parts sold separately and unrelated facility services where no cleaning robot is deployed.
Segmentation Overview
- By Robot Type
- Domestic and Household Robots
- Vacuum Floor Cleaner
- Pool Cleaning
- Window Cleaning
- Lawn Cleaning
- Other Domestic and Household Cleaning
- Professional Robots
- Floor Cleaning
- Tank, Tube and Pipe Cleaning
- Disinfection Robots
- Other Professional Cleaning
- Domestic and Household Robots
- By End-User
- Residential
- Commercial
- Hospitality
- Retail and Shopping Centres
- Healthcare Facilities
- Airports and Transportation Hubs
- Office and Corporate Facilities
- Other Commercial Facilities
- Industrial (Manufacturing and Warehousing)
- By Sales Channel
- Online
- Offline
- Robots-as-a-Service
- By Geography
- North America
- United States
- Canada
- Mexico
- South America
- Brazil
- Argentina
- Rest of South America
- Europe
- Germany
- United Kingdom
- France
- Italy
- Spain
- Rest of Europe
- Asia-Pacific
- China
- Japan
- India
- Singapore
- South Korea
- Australia
- Rest of Asia-Pacific
- Middle East
- Saudi Arabia
- United Arab Emirates
- Turkey
- Rest of Middle East
- Africa
- South Africa
- Nigeria
- Rest of Africa
- North America
Data Sources, Market Sizing, and Validation
Desk Research
Desk research was used to build the basic demand and supply picture before any modeling was locked. We pulled context from public sources such as International Federation of Robotics releases, International Trade Administration materials, and selected national statistics portals (for example, US Census Bureau and Eurostat) for household and business spending signals that link to automated cleaning adoption.
We also reviewed product and safety standards references (such as ISO and IEC pages), customs and trade statistics where relevant, and peer-reviewed robotics and automation journals to understand technology direction and typical price movement. On top of that, we used company filings, investor presentations, earnings transcripts, and trusted business press to map channel shifts like online sales and Robots as a Service. Some company financials and patent-intelligence subscriptions were used for cross-checking revenue exposure and innovation activity. These sources are illustrative only, and we used additional public references to collect, validate, and clarify data points.
Primary Interviews and Surveys
Primary work focused on interviews and structured surveys with manufacturers, component and software ecosystem participants, distributors, service providers, and large users across residential, commercial facilities, and industrial sites. Input from APAC, EMEA, and the Americas was used to cross-check unit shipment assumptions, average selling prices, service fees, and adoption timing against what buyers and sellers described, then adjust the model where gaps appeared.
Distribution of primary research fieldwork respondents
| Company type | Respondent position | Region |
|---|---|---|
| Top tier: 32% | CXOs: 12% | APAC: 49% |
| Mid tier: 54% | Functional/Unit leaders: 41% | EMEA: 32% |
| Smaller Players: 14% | Managers: 47% | Americas: 19% |
Market-Sizing & Forecasting
For sizing, we start with a top-down build where overall robotics and automation spend, category penetration by end-user setting, and channel-level sales signals are used to reconstruct the cleaning-robot revenue pool. Once that total is formed, it is stress-tested with selective bottom-up approximations, mainly sampled unit shipments by robot type multiplied by observed average selling price ranges, followed by channel checks for online, offline, and Robots as a Service revenue splits.
Key inputs were used to keep the model grounded, including the mix shift between household and professional robots, adoption pace across residential, commercial facilities, and industrial sites, average selling price progression for key robot categories, and service contract and subscription attach rates in Robots as a Service. Regional demand indicators were also tied to labor constraints and facility automation budgets. Where small-player volume could not be seen clearly in public sources, we used range-based assumptions anchored to distributor feedback and import-export patterns, then reviewed the impact on the totals.
Forecasts were developed using scenario analysis supported by a light multivariate regression on a few stable drivers, such as installed base growth, price trend direction, and end-user adoption timing. Scenario outputs were then aligned to expert views gathered in primary discussions. Where a driver behaved unusually by region, scenario weights were adjusted so the results matched real purchase cycles and channel stocking behavior.
Data Validation & Update Cycle
Outputs are validated through triangulation across independent signals, including shipment direction, pricing checks, end-user adoption feedback, and company-reported exposure to cleaning robotics. Variances are investigated using step-by-step checks on scope mapping, unit assumptions, currency conversions, and year alignment, then reviewed internally before sign-off.
The report is refreshed annually, and interim updates are triggered when material events occur, such as major product cycle shifts, meaningful pricing resets, or regulation changes that affect deployment in public facilities. Before delivery, a final analyst pass is completed so the numbers and narrative reflect the most recent verified inputs.
Mordor Intelligence's Cleaning Robot Market Estimate Compared With Other Published Estimates
Published market values for cleaning robots can look far apart even when the topic name is the same, because included robot types, sales channels, and end-user settings are not always counted consistently. Differences also appear when one estimate anchors on a single base-year snapshot, while another rolls forward using faster adoption assumptions or a different approach to price changes.
The main gap drivers in this market usually come from whether Robots as a Service revenue is included, how professional disinfection and industrial cleaning robots are treated, and whether adjacent domestic service robots are mixed in. Another common source of spread is the way ASP movement is modeled across robot categories, since entry models and premium models do not decline at the same rate, and currency timing can shift the final USD value when regional shares are large.
Benchmark comparison
| Source | Market Size | Gaps in Research Methodology |
|---|---|---|
| Mordor Intelligence | USD 16.89 B (2025) | |
| Global Consultancy A | USD 5.98 B (2024) | Uses an earlier base year and a shorter horizon, and the published framing appears to lean more on a narrower counted revenue pool in that year, which can understate professional and service-led revenue that scales later. |
| Industry Research Group B | USD 18.17 B (2025) | Shows a higher 2025 value that can result when a broader set of cleaning-robot applications is rolled together and when faster price and adoption progression is applied uniformly across robot types. |
The table shows that most of the difference comes from base-year selection and what gets counted as cleaning-robot revenue, especially around professional cleaning and Robots as a Service. By separating household and professional robot demand and only counting service revenue when a robot deployment contract is in place, the estimate stays traceable to clear variables, a choice applied by Mordor Intelligence.


Key Questions Answered in the Report
How large will the cleaning robot market be by 2031?
It is projected to reach USD 38.52 billion by 2031, reflecting a 14.38% CAGR from 2026-2031.
Which region is expected to grow the fastest?
Asia-Pacific is forecast to post the highest CAGR at 15.07% thanks to urbanization, income growth, and local manufacturing scale.
What drives commercial adoption of cleaning robots?
Tight labor markets, post-pandemic hygiene standards, and the shift toward robots-as-a-service subscriptions accelerate uptake in hotels, airports, and hospitals.
Why are LiDAR prices important to the cleaning robot sector?
A 99.5% cost decline in solid-state LiDAR enables advanced navigation features in sub-USD 500 units, broadening affordability and intensifying competition.
How significant is privacy regulation for camera-equipped robots?
GDPR and similar rules require explicit consent and data minimization, prompting many manufacturers to adopt LiDAR-only or edge-processing designs to avoid compliance risks.
What is robots-as-a-service and why is it growing?
Robots-as-a-service lets enterprises lease autonomous cleaners with bundled maintenance and software updates, converting capex into predictable opex and lowering adoption barriers.
Page last updated on:






