
Citric Acid Market Size and Share
Market Overview
| Study Period | 2021 - 2031 |
|---|---|
| Market Size (2026) | USD 3.93 Billion |
| Market Size (2031) | USD 4.81 Billion |
| Growth Rate (2026 - 2031) | 4.12 % |
| Fastest Growing Market | Middle East and Africa |
| Largest Market | Asia Pacific |
| Market Concentration | Medium |
Major Players *Disclaimer: Major Players sorted in no particular order Image © Mordor Intelligence. Reuse requires attribution under CC BY 4.0. | |
Citric Acid Market Analysis by Mordor Intelligence
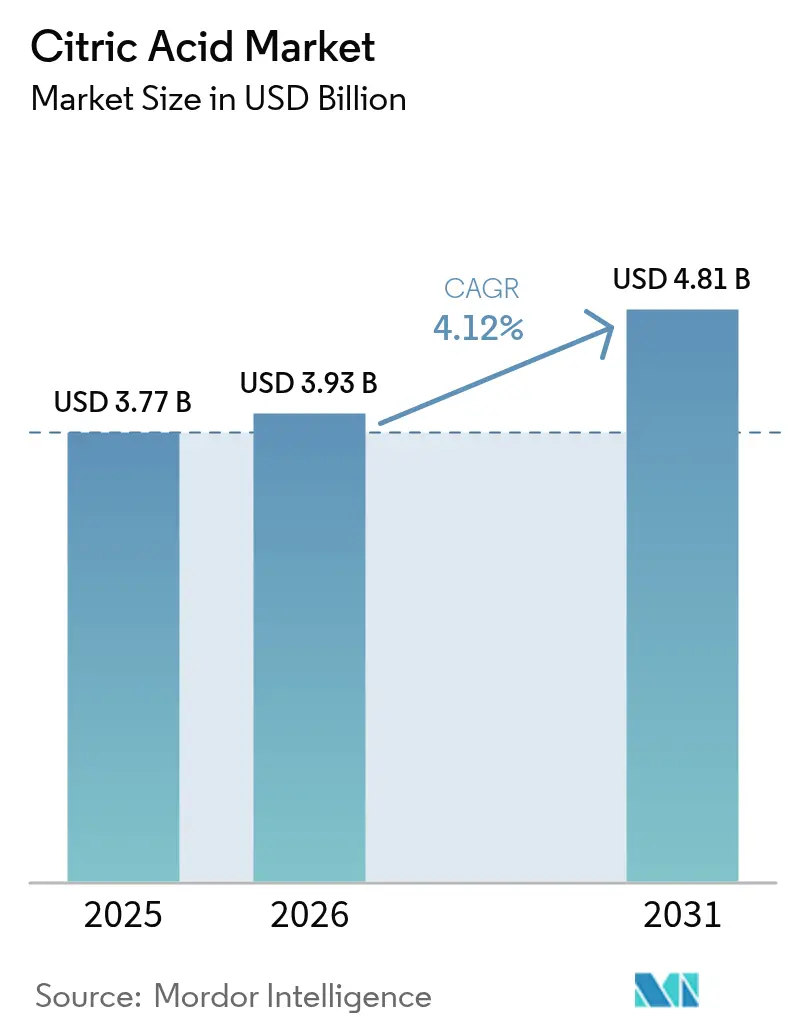
The citric acid market size is expected to grow from USD 3.77 billion in 2025 to USD 3.93 billion in 2026, and reach USD 4.81 billion by 2031, growing at a CAGR of 4.12% from 2026 to 2031. Global adoption of clean-label food formulations, widening phosphate restrictions in detergent chemistry, and the roll-out of cost-efficient Asian fermentation capacity are combining to keep demand on an upward path. Food and beverage producers accounted for 49.74% of 2025 consumption as bakery, beverage, and dairy brands switched out synthetic preservatives in favor of citric acid that carries explicit approvals under FDA 21 CFR 184.1033 and EFSA E330[1]. At the same time, phosphate bans anchored in EU Regulation 648/2004 pushed household-cleaner formulators toward biodegradable citrate builders, generating the fastest-growing application pool. Asia-Pacific’s 35.43% share in 2025 reflected China’s 1.067 million-kilogram export machine and India’s new molasses-sourced plants, while the Middle East and Africa emerged as the highest-growth territory on the back of beverage and confectionery investment pipelines.
Key Report Takeaways
- By form, anhydrous grade captured 55.62% of volume in 2025; liquid citric acid is forecast to expand at a 5.80% CAGR through 2031.
- By Application, food and beverages led with 49.74% revenue share in 2025; detergents and household cleaners are advancing at a 6.03% CAGR through 2031.
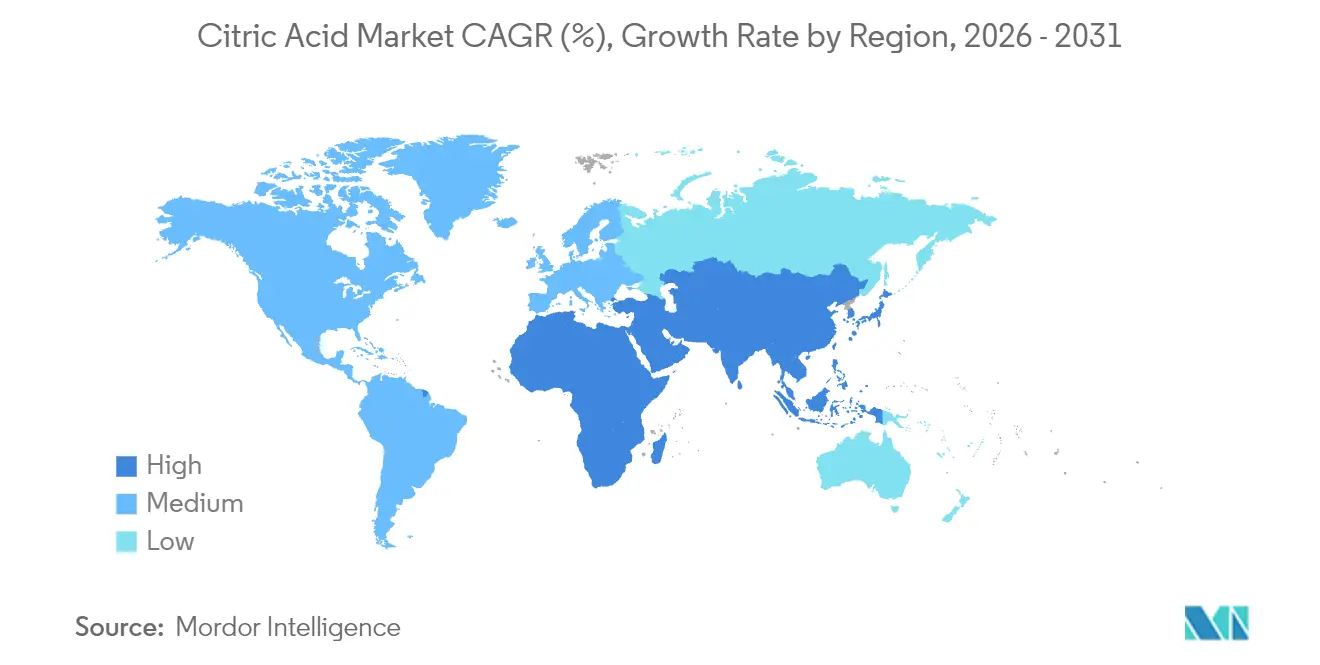
- By geography, Asia-Pacific held 35.43% of the citric acid market share in 2025; the Middle East and Africa are set to post a 6.56% CAGR over 2026-2031.
Note: Market size and forecast figures in this report are generated using Mordor Intelligence’s proprietary estimation framework, updated with the latest available data and insights as of 2026.
Market Trends and Insights
Drivers Impact Analysis of Citric Acid Market*
| Driver | (~) % Impact on CAGR Forecast | Geographic Relevance | Impact Timeline |
|---|---|---|---|
| Clean-label demand surge in processed foods and beverages | +1.2% | Global, with North America and Europe leading the reformulation | Medium term (2-4 years) |
| Phosphate bans boosting citrate use in detergents | +0.9% | Europe (primary), North America (emerging), Asia-Pacific (selective) | Short term (≤ 2 years) |
| Expanding pharmaceutical excipient applications | +0.6% | North America, Europe, India (generics hub) | Long term (≥ 4 years) |
| Growth of bio-based production capacity in Asia | +0.8% | China, India, Thailand, Indonesia | Medium term (2-4 years) |
| Commercialization of Yarrowia lipolytica waste-glycerol routes | +0.4% | Europe (pilot scale), Asia-Pacific (scale-up potential) | Long term (≥ 4 years) |
| EU Green Deal incentives for biodegradable chelants | +0.5% | Europe (core), spill-over to the Middle East and North Africa | Medium term (2-4 years) |
| Source: Mordor Intelligence | |||
Clean-label demand surge in processed foods and beverages
Consumer preference for recognizable ingredients has compelled food manufacturers to replace synthetic preservatives with naturally derived alternatives, positioning citric acid as a dual-function acidulant and antimicrobial agent in bakery, confectionery, and dairy applications. FDA recognition under 21 CFR 582.1033 as a direct food substance affirmed as generally recognized as safe (GRAS) eliminates regulatory friction, enabling formulators to declare citric acid on ingredient panels without consumer skepticism. Beverage producers are leveraging citric acid's tartness to mask off-notes in reduced-sugar formulations, a trend accelerating as sugar taxes proliferate across Latin America and Southeast Asia. Bakery applications benefit from citric acid's ability to extend shelf life by lowering pH below 4.6, inhibiting Clostridium botulinum growth without imparting the metallic aftertaste associated with sorbates or benzoates. The clean-label imperative is further amplified by retailer mandates; major European grocery chains now require suppliers to eliminate E-number additives from private-label lines, driving reformulation cycles that favor citric acid over calcium propionate or sodium benzoate.
Phosphate bans boosting citrate use in detergents
Regulatory restrictions on phosphates in household detergents, codified in EU Regulation (EC) 648/2004 and reinforced by amendments limiting phosphorus content to 0.3 grams per standard dose, have catalyzed substitution with citric acid and its sodium salts as builders and chelating agents[2]. Citric acid sequesters calcium and magnesium ions in hard water, preventing scale deposition on fabrics and washing-machine components, while its biodegradability under OECD 301B protocols satisfies environmental criteria that phosphates fail. European consumption of household cleaning products reached approximately 100,000 tonnes in 2025, with Germany, France, and the United Kingdom accounting for the majority of uptake. North American jurisdictions are following suit; several U.S. states have enacted phosphate bans in automatic dishwasher detergents, and Canadian provinces are considering similar measures. The detergent segment's 6.03% CAGR through 2031 reflects not only regulatory push but also formulator recognition that citric acid enables concentrated liquid formats by maintaining stability at lower pH, reducing packaging weight and transport emissions, a dual benefit as brands pursue sustainability claims.
Expanding pharmaceutical excipient applications
Citric acid's role as a buffering agent, effervescent component, and taste-masking excipient in pharmaceutical formulations is broadening as generic-drug manufacturers in India and China scale production of orally disintegrating tablets and pediatric suspensions. Compliance with United States Pharmacopeia (USP) and European Pharmacopoeia (EP) monographs ensures batch-to-batch consistency, a non-negotiable requirement for regulatory approval by the FDA and European Medicines Agency. Effervescent tablets, widely used for analgesics, vitamins, and electrolyte replacements, rely on citric acid reacting with sodium bicarbonate to generate carbon dioxide, enhancing dissolution and patient compliance. The shift toward patient-centric dosage forms, particularly in geriatric and pediatric populations, is driving demand for pharmaceutical-grade citric acid that meets stringent heavy-metal limits (≤10 ppm lead, ≤5 ppm arsenic per USP standards). India's emergence as a generics powerhouse, supplying over 40% of global generic-drug demand, positions the subcontinent as a growth engine for pharmaceutical excipient consumption, with citric acid benefiting from its dual utility in both active pharmaceutical ingredient (API) synthesis and final formulation.
Growth of bio-based production capacity in Asia
Asia-Pacific's 35.43% market share in 2025 rests on integrated fermentation complexes in China, India, and Thailand that convert molasses and corn-steep liquor into citric acid via Aspergillus niger submerged fermentation, achieving yields exceeding 90% on a substrate basis. China's COFCO Biochemical, RZBC Group, and Weifang Ensign operate plants with individual capacities surpassing 100,000 tonnes per annum, leveraging proximity to sugarcane and corn-processing hubs to minimize feedstock logistics costs. India is witnessing greenfield investments; a feasibility study for a 30,000-tonne-per-annum anhydrous citric acid plant estimates total capital expenditure at INR 18.12 billion, with a projected rate of return of 47% and break-even at 45% capacity utilization. Thailand's anti-dumping duties on Chinese imports (57.79% as of January 2025) are incentivizing domestic capacity additions to serve ASEAN markets, where beverage and processed-food consumption is rising at double-digit rates Thailand Department of Foreign Trade. The region's cost advantage, molasses priced 30-40% below refined sugar on a dry-matter basis, sustains competitiveness even as Western producers pursue premium-grade segments.
Restraints Impact Analysis of Citric Acid Market*
| Restraint | (~) % Impact on CAGR Forecast | Geographic Relevance | Impact Timeline |
|---|---|---|---|
| Corn and sugar price volatility | -0.7% | Global, with acute exposure in North America (corn) and Brazil (sugar) | Short term (≤ 2 years) |
| Margin pressure from the Chinese overcapacity and anti-dumping duties | -0.9% | Asia-Pacific (export-dependent), North America and Europe (import-competing) | Medium term (2-4 years) |
| Surge in gypsum-waste disposal compliance costs | -0.4% | North America, Europe (stringent landfill regulations) | Long term (≥ 4 years) |
| Substitution threat from emerging multi-acid blends | -0.5% | Global, concentrated in premium food and personal-care segments | Medium term (2-4 years) |
| Source: Mordor Intelligence | |||
Corn and sugar price volatility
Citric acid production economics hinge on feedstock costs, with molasses, corn-steep liquor, and refined sugar accounting for 40-50% of total manufacturing expenses in fermentation-based processes. Sugar production in the 2023/24 crop year totaled 179.4 million tonnes globally, with Brazil exporting 34 million tonnes, yet prices remain susceptible to weather anomalies. El Niño-induced droughts in Thailand and India curtailed 2024 cane yields, tightening molasses availability and elevating spot prices by 18-22% year-over-year[3]. Corn prices, critical for U.S. and European producers, oscillate with biofuel mandates; the U.S. Renewable Fuel Standard's requirement for 15 billion gallons of corn ethanol annually diverts feedstock, creating competition that spikes during short-crop years. Fertilizer cost collapses, from USD 815 per tonne in April 2022 to USD 327 per tonne in April 2024, providing temporary relief, yet freight-rate volatility linked to container-shipping disruptions (Red Sea diversions, Panama Canal draft restrictions) has inflated import bills for molasses and raw sugar by 12-15% in 2025. Producers lacking vertical integration into sugar refining or corn wet-milling face margin compression when feedstock inflation outpaces their ability to pass costs downstream, particularly in price-sensitive food-grade segments where buyers resist mid-contract adjustments.
Margin pressure from Chinese overcapacity and anti-dumping duties
In recent years, China's citric acid exports reached 1,067 million kilograms, showcasing a domestic capacity three times higher than local consumption. About 300,000 tonnes are consumed domestically, with the rest allocated for exports, as reported by the U.S. Environmental Protection Agency. This oversupply has triggered anti-dumping duties globally. In January 2025, Thailand imposed a 57.79% duty after its fifth sunset review. U.S. duties range from 0.48% to 156.45%, depending on the producer, while the European Union has implemented similar measures, according to the Thailand Department of Foreign Trade. These trade barriers have fragmented the global market, forcing Chinese producers to absorb duties or redirect exports to less-regulated markets in Africa and Latin America, where infrastructure and purchasing power constraints limit pricing. Western producers benefit from import protection but face retaliation risks. China's Ministry of Commerce has launched countervailing-duty investigations on U.S. and European specialty chemicals, creating uncertainty for diversified firms. The result is margin volatility: Chinese exporters operate on thin spreads (often under 5% EBITDA margins) to maintain market share, while North American and European producers struggle to justify capacity investments amid periodic dumping in spot markets.
*Our forecasts treat driver/restraint impacts as directional, not additive. The impact forecasts reflect baseline growth, mix effects, and variable interactions.
Citric Acid Market Segment Analysis
By Form:
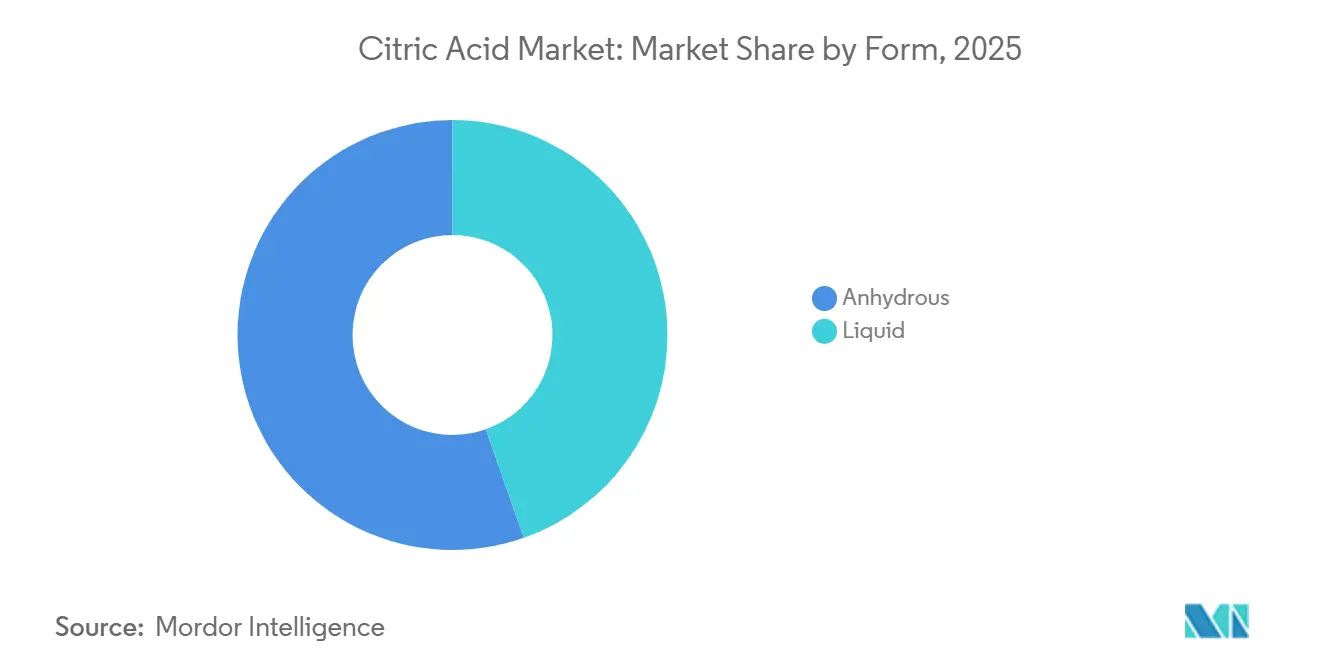
Anhydrous Dominance Anchored in Dry-Mix StabilityIn 2025, anhydrous citric acid dominated the market with a 55.62% share, solidifying its role in dry-blend applications sensitive to moisture. Its crystalline stability is crucial for powdered beverage mixes, effervescent tablets, and bakery enhancers, preventing premature reactions with bicarbonates and hygroscopic ingredients. Liquid citric acid, projected to grow at a 5.80% CAGR through 2031, is gaining traction in pharmaceutical and personal-care products, where precise pH control in aqueous systems and ease of handling are prioritized. The pharmaceutical industry's shift to liquid orally disintegrating films and pediatric syrups is driving liquid citric acid adoption, avoiding dust and static-electricity issues in cleanrooms. Food-service operators are also favoring liquid formats for beverage dispensing and dressing preparation, as pre-dissolved citric acid eliminates mixing and reduces labor costs. While anhydrous citric acid benefits from lower production costs due to crystallization and drying, liquid suppliers are closing the gap by co-locating with fermentation plants to reduce water transport costs.
Both forms of citric acid comply with ISO 9001 and HACCP protocols. However, anhydrous citric acid, classified as a non-hazardous solid under UN transport regulations, simplifies logistics compared to liquid citric acid, labeled as corrosive (UN 1760, Class 8), which requires specialized containers and handling. Innovations in spray-drying and fluidized-bed granulation are enabling anhydrous producers to customize particle sizes for specific uses, such as coarse granules (40-100 mesh) for tableting and fine powders (200+ mesh) for beverage clouding. These tailored products command a 10-15% premium over standard anhydrous citric acid. Liquid citric acid suppliers are countering with stabilized formulations, removing chelated trace metals to sub-ppm levels to meet stringent cosmetic and injectable-pharmaceutical standards, where even minor iron or copper contamination can cause discoloration or oxidation.

By Application:
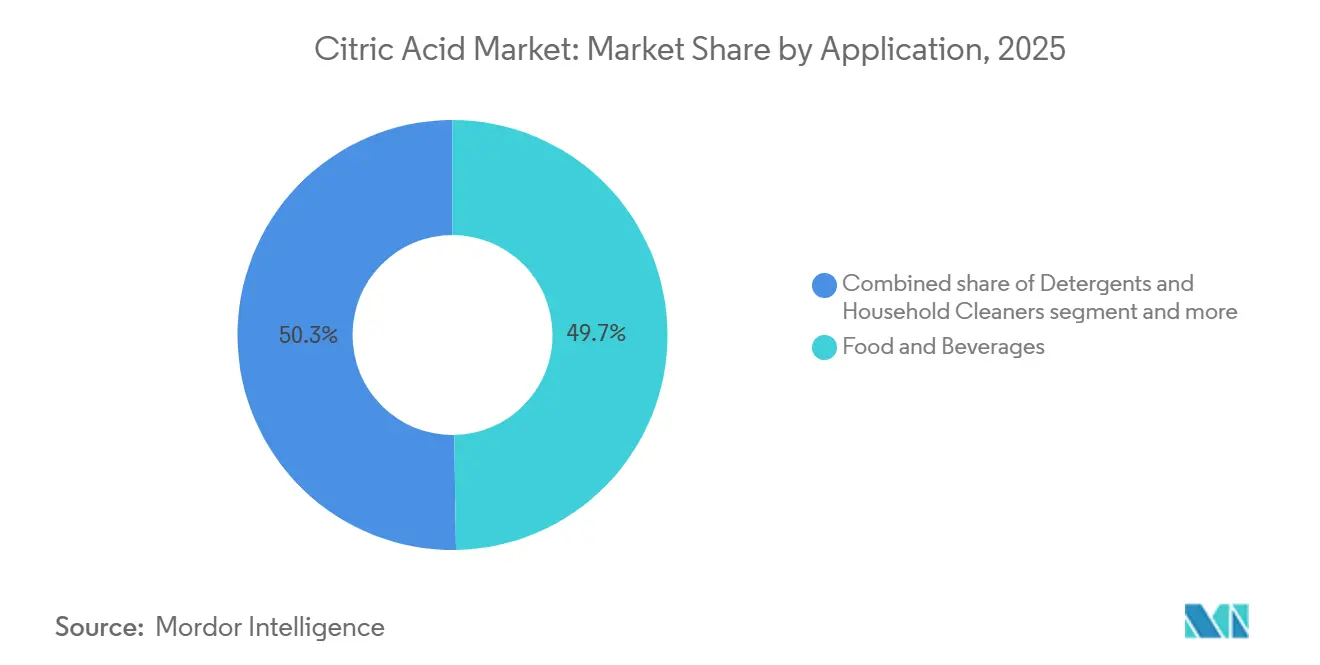
Food and Beverages Lead, Detergents AccelerateIn 2025, food and beverages held a 49.74% market share, while detergents and household cleaners were the fastest-growing application with a 6.03% CAGR projected through 2031. This reflects the dual forces driving citric acid demand: clean-label reformulations in edibles and phosphate-replacement mandates in cleaning products. Beverages dominate the food and beverage sector, using citric acid's tartness to balance sweetness in carbonated drinks, energy drinks, and teas. Coca-Cola and PepsiCo typically use 0.05-0.15% citric acid, achieving a pH of 2.5-3.5 to curb microbial growth and enhance flavor. In bakeries, citric acid extends the shelf life of breads and cakes by 20-30% by chelating metal ions. Dairy processors use it in processed cheese to emulsify fats and adjust pH for optimal protein solubility, critical for cheese-sauce and spread formulations. Confectionery producers use citric acid to prevent sugar crystallization in hard candies and add sour notes in gummies, with usage rates of 2-3% in extreme-sour variants. Savory snacks are increasingly coated with citric acid to enhance tanginess and flavor, driven by demand for bold, global flavors.
In pharmaceuticals, citric acid acts as an effervescent agent and buffer, benefiting from India's generics boom, where over 40% of U.S. FDA-approved generic-drug facilities are located. In personal care, citric acid adjusts pH in shampoos and conditioners (pH 4.5-5.5) and serves as an alpha-hydroxy acid in anti-aging serums, promoting exfoliation and collagen synthesis. The "Others" category includes industrial applications, metal cleaning, textile processing, and concrete admixtures, where citric acid's chelating properties remove rust and scale. However, these segments face substitution pressures from cheaper alternatives like EDTA and gluconic acid. Detergents' growth is driven by phosphate bans and the rise of concentrated liquid formats, where citric acid ensures stability at pH 3-4, preventing precipitation of surfactants and enzymes. Growth is uneven geographically; European detergent consumption rose 8% year-over-year in 2025, while North America lagged at 4% due to slower regulatory adoption and a preference for powder formats that tolerate higher pH levels.
Geography Analysis
APAC Citric Acid Market
In 2025, Asia-Pacific commands a 35.43% market share, largely due to China's robust production capabilities and its surging domestic appetite in food processing and industrial sectors. The region's advantages include a well-established fermentation infrastructure, competitive production costs, and close access to vital raw materials like corn and sugarcane derivatives. Yet, trade tensions and anti-dumping measures are altering the regional landscape. Countries like India, Thailand, and other Southeast Asian nations are ramping up production capacities to cater to both local and export demands. Japan's sophisticated pharmaceutical and food processing sectors present lucrative market prospects, while Australia's burgeoning beverage industry bolsters regional consumption.
North America and EMEA Citric Acid Market
The Middle East and Africa are the regions to watch, boasting a 6.56% CAGR through 2031. This growth is largely attributed to the burgeoning food processing sectors and infrastructural investments in nations such as Saudi Arabia and the UAE. Government initiatives in the region, aimed at bolstering food security and diversifying industries, are birthing new demand hubs for citric acid. NEOM's collaboration with Liberation Labs to set up precision fermentation facilities underscores the region's ambition in advanced biomanufacturing. Meanwhile, North America and Europe, with their entrenched food and pharmaceutical sectors, offer stable demand, albeit with tempered growth rates due to market saturation and regulatory consistency.
Europe and the Americas Citric Acid Market
Europe, with its robust demand from the food, beverage, and personal care sectors, remains a stable player, bolstered by stringent quality standards and established processing facilities. North America's growth is steady, driven by a surge in ready-to-drink beverages, convenience foods, and pharmaceuticals. Consumers here increasingly lean towards clean-label ingredients, using citric acid as a natural preservative and flavor enhancer. South America, particularly in nations like Brazil and Argentina, is on the rise, thanks to its expanding food processing sectors and a growing appetite for packaged foods. South American manufacturers enjoy the dual advantage of abundant agricultural feedstocks for citric acid production and a reduced reliance on imports. Across Europe, North America, and South America, regulatory frameworks that favor natural additives further enhance citric acid's market potential, presenting opportunities for both global giants and local players.
Regulatory Landscape
Citric acid maintains broad food-additive clearances in key consuming regions, supporting its role as a clean-label acidulant and preservative. In the United States, citric acid is affirmed as GRAS for direct addition to food under 21 CFR 184.1033, with use limited by current good manufacturing practice. This regulatory anchor is frequently referenced by multinational food and beverage formulators.
In the European Union, citric acid is authorized as food additive E 330 under Regulation (EC) No 1333/2008, and it remains within EFSA's ongoing additive re-evaluation and monitoring framework. In March 2026, EFSA issued an open call for analytical data and use levels for citric acid (E 330), with its Data Collection Framework opening for reporting on 1 April 2026. That timing elevates the importance of traceable use-level documentation and analytical readiness for suppliers serving EU customers.
Value Chain Analysis
Citric acid value creation starts with carbohydrate feedstocks (molasses, sugar, and corn-derived streams such as corn-steep liquor), followed by submerged fermentation, purification, crystallization, and conversion into downstream citrate salts. Submerged fermentation using Aspergillus niger is the dominant production route (about 80% of global output). Some European producers use surface fermentation, but the supply base remains heavily concentrated in China (about 60% to 70% of global capacity), which shapes pricing and trade flows across food, beverages, detergents, and pharma excipients.
Downstream, producers sell food-grade and pharma-grade citric acid directly to large formulators and through distributors. Citrate salts and tailored specifications are also commonly routed via specialty ingredient channels for beverages, supplements, and pharmaceutical applications. The chain is sensitive to feedstock volatility and cross-border logistics, which is pronounced in import-dependent regions; many buyers use dual-sourcing strategies that combine Chinese and Western-origin material to manage continuity risks. In April 2026, Thailand-based Xitrical issued updated technical guidance and specifications for potassium citrate and tripotassium citrate monohydrate used in food and beverage formulations, highlighting the role of technical service and specification management beyond commodity-grade supply.
Competitive Landscape
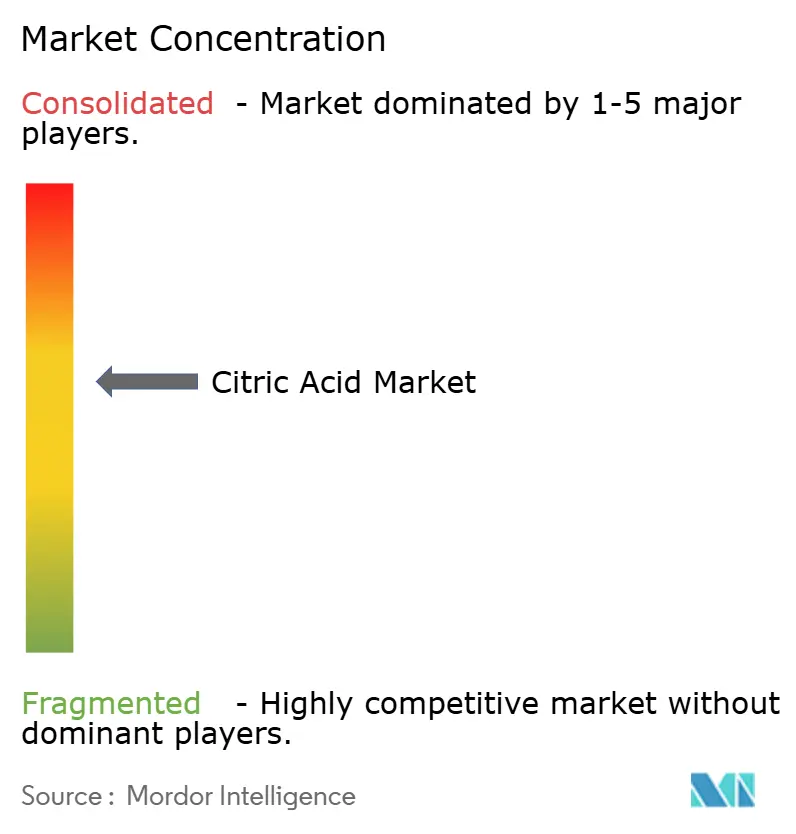
The citric acid market is moderately consolidated, with a few dominant multinational players, including Cargill Incorporated, Shandong Ensign Industry Co., Ltd., Jungbunzlauer Suisse AG, COFCO Corporation, and RZBC Group Co., Ltd. These companies hold significant market shares due to their extensive production capacities and well-established global distribution networks. This market concentration enables these leaders to achieve economies of scale and exert strong bargaining power over both raw material suppliers and downstream buyers. However, the presence of numerous regional and niche manufacturers prevents the market from becoming fully consolidated. These smaller players effectively address localized demand by offering flexible pricing and customized solutions.
Competition in the market is further driven by advancements in bio-based production technologies and the increasing demand for citric acid across diverse applications, such as food preservation, pharmaceuticals, and personal care products. The competitive landscape reflects a balance between the dominance of global leaders and the adaptability of regional players, resulting in a moderately consolidated market structure. Emerging markets present significant growth opportunities, as local production capabilities often lag behind rising consumption levels. This import dependency creates a favorable environment for established players to expand through greenfield investments or strategic partnerships.
Technological advancements play a critical role in shaping the competitive dynamics of the market. Companies with expertise in advanced fermentation processes and process optimization are better positioned to gain a competitive edge. Additionally, the regulatory complexities associated with pharmaceutical applications create barriers to entry, favoring suppliers with the necessary certifications and robust quality management systems. While the market's moderate fragmentation allows niche players to compete effectively in specialized applications, achieving scale becomes increasingly important in commodity-grade segments, where pricing pressures are more pronounced.
Citric Acid Industry Leaders
-
Cargill, Incorporated
-
Shandong Ensign Industry Co. Ltd
-
COFCO Corporation
-
RZBC Group Co., Ltd.
-
Jungbunzlauer Suisse AG
- *Disclaimer: Major Players sorted in no particular order
Citric Acid Market Companies Covered in this Report
- Archer Daniels Midland Company
- Cargill Incorporated
- Jungbunzlauer Suisse AG
- Weifang Ensign Industry Co. Ltd.
- RZBC Group Co. Ltd.
- Tate & Lyle PLC
- COFCO Biochemical (Anhui) Co. Ltd.
- Gadot Biochemical Industries Ltd.
- Citrique Belge N.V.
- Huangshi Xinghua Biochemical Co. Ltd.
- TTCA Co. Ltd.
- Jiangsu Guoxin Union Energy Co. Ltd.
- Laiwu Taihe Biochemistry Co. Ltd.
- BBCA Group
- Pfizer Inc.
- Kenko Corporation
- Natural Biological Group
- S.A. Citrique Belge N.V.
- Shandong Ensign Industry Co., Ltd.
- Foodchem International Corporation
Market Opportunities and Future Outlook
Trade defense actions and regional supply diversification are creating space for non-China aligned sourcing strategies across food, beverage, and industrial citrate applications. A concrete catalyst is the May 2026 U.S. notice confirming the continuation of antidumping and countervailing duty orders on citric acid and certain citrate salts from China, which reinforces the value of compliant, alternative supply options for importers and downstream formulators managing duty exposure and supply continuity.
New capacity and process innovation are also opening pathways to reduce logistics risk and improve production economics. In Africa and the Middle East, projects such as Cairo 3A's plan to establish Egypt's first citric acid plant (35,000 tonnes per year as part of a USD 150 million, three-year investment program) connect directly to regional beverage and confectionery build-outs and import substitution needs. On technology, commercialization narratives around continuous fermentation and membrane separation approaches, along with energy-transition actions such as Citribel's 2025 sustainability-linked planning for solar installations and Jungbunzlauer's renewable-power integration at its production site, support opportunities for suppliers that can combine competitive cost with lower-carbon and audit-ready supply for food and pharmaceutical customers.
Recent Industry Developments in Citric Acid Market
- May 2026: The United States published a notice confirming the continuation of antidumping and countervailing duty orders on citric acid and certain citrate salts from China, reinforcing existing trade defenses. The action keeps duty-related compliance and landed-cost differentials central to sourcing decisions for U.S.-bound supply. It also supports procurement diversification toward alternative origins and domestic or regionally aligned suppliers.
- January 2025: Brenntag Pharma extended its distribution partnership with Citribel for citric acids and citrate pharma excipients to include Israel, Turkey, and South Africa. The expanded footprint increases local availability of pharma-grade citrate inputs across additional markets and strengthens service levels for regulated end uses. It also raises competitive pressure on regional distributors that rely on narrower supplier portfolios.
- March 2024: Jungbunzlauer started up Austria's largest photovoltaic power station, a 56 MWp installation generating more than 60 GWh of renewable electricity annually and feeding directly into its production site's private grid. The project reduces exposure to external energy-price volatility and supports lower-carbon manufacturing credentials for citric acid and related ingredients. This type of on-site renewable integration aligns with customer audits and sustainability-driven supplier qualification in food and pharmaceutical value chains.
Citric Acid Market Report Scope and Research Methodology
Market Definition and Coverage
For this study, the market covers revenues generated from selling citric acid as an ingredient across industrial end users, tracked across major forms and end-use applications, and then summed to a global total.
Scope exclusions: It does not count downstream packaged products where citric acid is only one input (for example finished foods, detergents, or cosmetics).
Segments Covered in This Report
- Form
- Anhydrous
- Liquid
- Application
- Food and Beverages
- Bakery
- Confectionery
- Dairy
- Beverages
- Savory and Snacks
- Other Foods and Beverages
- Pharmaceuticals
- Personal Care and Cosmetics
- Detergents and Household Cleaners
- Others
- Food and Beverages
- Geography
- North America
- United States
- Canada
- Mexico
- Rest of North America
- Europe
- United Kingdom
- Germany
- France
- Italy
- Spain
- Sweden
- Belgium
- Poland
- Netherlands
- Rest of Europe
- Asia-Pacific
- China
- Japan
- India
- Thailand
- Singapore
- South Korea
- Australia
- New Zealand
- Rest of Asia Pacific
- South America
- Brazil
- Argentina
- Colombia
- Chile
- Peru
- Rest of South America
- Middle East and Africa
- United Arab Emirates
- Saudi Arabia
- Qatar
- Turkey
- South Africa
- Nigeria
- Egypt
- Morocco
- Rest of Middle East and Africa
- North America
Data Sources, Market Sizing, and Validation
Desk Research
Desk work starts by mapping supply and demand signals that can be checked in public records, then tying them back to what is actually used and traded. We mainly use sources such as UN Comtrade trade statistics, the US International Trade Commission DataWeb, Eurostat, and national statistical offices to understand import, export, and unit-value movements by region.
To avoid building the model on trade alone, we also review sources such as the FAO for upstream crop and starch feedstock context, the US FDA and EFSA for food additive and labeling references, and peer-reviewed journals that discuss fermentation yields and purity requirements. Company annual reports, investor presentations, and reputable industry news are used to validate capacity additions, plant restarts, and application demand commentary. Where needed, we supplement public information with paid subscriptions for company financials and intelligence, patent databases, and shipment-level trade databases to cross-check volumes and pricing direction. These examples are not exhaustive, and many other public sources were also used for data collection, validation, and clarification.
Primary Interviews and Surveys
Primary work is used to pressure-test assumptions that desk research cannot settle, like typical contract pricing logic, grade mix shifts, and how demand changes across beverage, pharma, and cleaners. Interviews and surveys covered manufacturers, distributors, and large end users across key producing and consuming regions, so the estimates could be adjusted where reported capacities or trade flows did not match how volumes are actually purchased and allocated.
Distribution of primary research fieldwork respondents
| Company type | Respondent position | Region |
|---|---|---|
| Top tier: 27% | CXOs: 14% | APAC: 39% |
| Mid tier: 58% | Functional/Unit leaders: 30% | EMEA: 36% |
| Smaller Players: 15% | Managers: 56% | Americas: 25% |
Market-Sizing & Forecasting
Sizing is built using both top-down and bottom-up checks so the totals stay realistic. From the top-down side, production and trade indicators are used to reconstruct the available supply pool by region, which is then adjusted for likely internal consumption, re-exports, and application pull.
Those totals are then corroborated using selective bottom-up approximations, such as sampling supplier revenues where financials are visible, applying volume by form to typical regional price bands, and running channel checks with distributors to avoid double counting. Key inputs we track include fermentation capacity additions and utilization direction, import and export trends with unit values, food and beverage processing output signals, detergent formulation shifts linked to phosphate restrictions, and the form mix between anhydrous and liquid that changes average selling prices.
For the forecast, scenario analysis is used, supported by expert views on capacity ramp-ups, feedstock cost cycles, and demand resilience in major end uses. When bottom-up gaps show up (for example limited disclosure from private producers), the missing share is filled using regional supply balance logic and then rechecked against pricing and trade consistency before finalizing the series.
Data Validation & Update Cycle
Before results are signed off, outputs are triangulated against independent signals like trade balances, implied regional consumption, and price direction, so the market does not grow faster than its demand drivers can support. Large variances trigger a second pass where assumptions are revisited, and follow-up calls are done when a capacity event, a policy change, or a sharp pricing move can materially shift the outlook.
Each estimate goes through multi-step analyst review that includes unit checks, currency consistency checks, and year-on-year reasonableness tests at both regional and global levels. Reports are refreshed annually, and interim updates are made when material events occur, followed by a final freshness check right before delivery so clients receive the latest updated view.
Mordor Intelligence's Citric Acid Market Estimate Compared With Other Published Estimates
It is common to see different market sizes for citric acid because authors do not always match on what they count and when they count it. Differences usually come from product scope choices, the year selected as the base, and how prices are converted and averaged across grades and regions.
In this study, the main gap driver is whether related citrate derivatives or extra forms are blended into the total, and whether pricing is modeled using spot-like assumptions versus contract-heavy averages. Another source of spread is refresh cadence, since new fermentation capacity and trade shifts can change the near-term market quickly, which then affects the starting point for a long forecast.
Benchmark comparison
| Source | Market Size | Gaps in Research Methodology |
|---|---|---|
| Mordor Intelligence | USD 3.77 B (2025) | |
| Regional Consultancy A | USD 3.79 B (2025) | Uses a shorter application split and tends to lean on a base-year revenue snapshot without clearly showing how regional price averages and grade mix are normalized. |
| Industry Publisher B | USD 3.30 B (2026) | Runs a different starting year and a broader form list, and it can also dampen the total by using conservative pricing and longer-cycle demand assumptions across end uses. |
The table shows that most of the spread is explained by timing and scope, not by a single arithmetic mistake. By separating citric acid ingredient sales from adjacent citrate categories, and by keeping price inputs tied to region-level trade and interview checks, the estimate stays traceable to a repeatable demand pool, which is then refreshed with material capacity and policy changes, a modeling choice applied by Mordor Intelligence.
Key Questions Answered in the Report
How large is the citric acid market expected to be by 2031?
Forecasts indicate that the citric acid market will reach USD 4.81 billion by 2031, with a 4.12% CAGR from 2026 to 2031.
Which application category currently uses the most citric acid?
Food and beverages account for 49.74% of global demand thanks to clean-label reformulation across bakery, beverage, and dairy items.
Why are detergents a high-growth outlet for citric acid?
Phosphate bans in Europe and several U.S. states push cleaners toward biodegradable citrate builders, driving a 6.03% CAGR in detergent applications.
Which region is growing fastest for citric acid consumption?
The Middle East and Africa are projected to expand at a 6.56% CAGR through 2031 as local beverage and confectionery capacity scales up.