
Circular Polymers Market Size and Share
Market Overview
| Study Period | 2020 - 2031 |
|---|---|
| Market Volume (2026) | 21.58 Million tons |
| Market Volume (2031) | 30.86 Million tons |
| Growth Rate (2026 - 2031) | 7.42 % |
| Fastest Growing Market | Asia-Pacific |
| Largest Market | Europe |
| Market Concentration | Medium |
Major Players *Disclaimer: Major Players sorted in no particular order Image © Mordor Intelligence. Reuse requires attribution under CC BY 4.0. | |
Circular Polymers Market Analysis by Mordor Intelligence
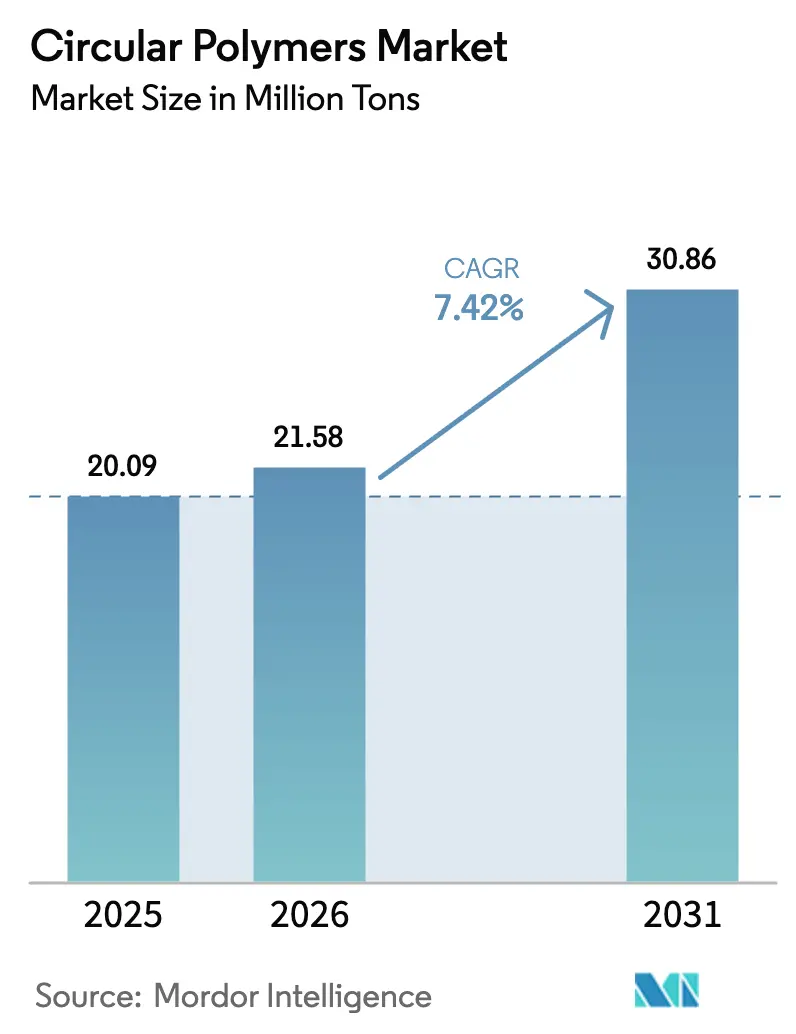
The circular polymers market size is expected to grow from 20.09 million tons in 2025 to 21.58 million tons in 2026 and is forecast to reach 30.86 million tons by 2031 at 7.42% CAGR over 2026-2031. The expansion reflects a global pivot from linear disposal models toward closed-loop value chains that reclaim polymers through mechanical and chemical recycling. Mandatory recycled-content thresholds, especially the European Union requirement for 30% recycled PET in beverage bottles by 2030, are reshaping procurement strategies. Advanced recycling that converts previously non-recyclable streams into near-virgin feedstock is narrowing the cost gap with primary resins. Investment surges, such as TotalEnergies’ Grandpuits platform and LyondellBasell’s Knapsack hub, signal mounting confidence in the circular polymers market. Asia-Pacific’s accelerating capacity build-out complements Europe’s mature infrastructure, ensuring feedstock availability and diversified growth pathways for the circular polymers market.
Key Report Takeaways
- By polymer, PET led with 41.62% of the circular polymers market share in 2025, while Nylon-6 is projected to expand at an 8.37% CAGR to 2031.
- By recycling technology, mechanical recycling held 64.35% of the circular polymers market share in 2025, whereas chemical recycling is forecast to rise at an 8.29% CAGR to 2031.
- By end-user industry, packaging commanded 60.78% share of the circular polymers market size in 2025; the other end-user industries cluster is advancing at a 8.61% CAGR through 2031.
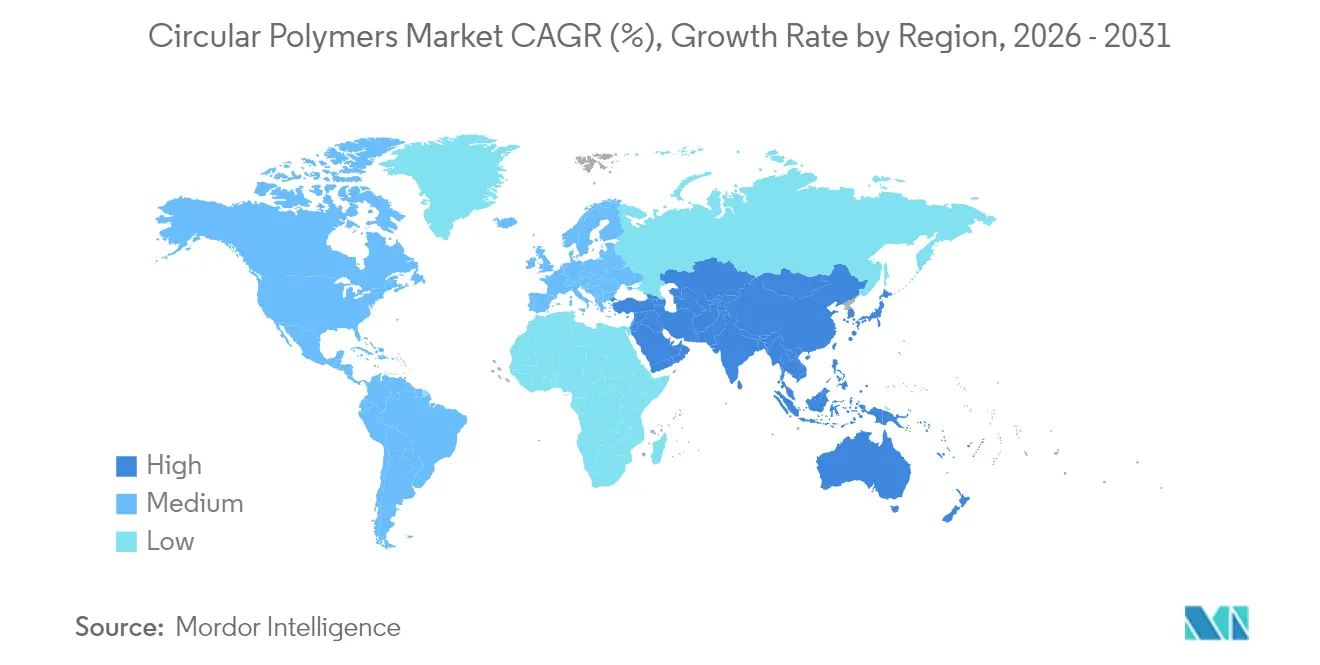
- By region, Europe accounted for 31.22% of the circular polymers market size in 2025; Asia-Pacific records the fastest regional CAGR at 8.46% through 2031.
Note: Market size and forecast figures in this report are generated using Mordor Intelligence’s proprietary estimation framework, updated with the latest available data and insights as of 2026.
Market Trends and Insights
Drivers Impact Analysis of Circular Polymers Market*
| Driver | (~) % Impact on CAGR Forecast | Geographic Relevance | Impact Timeline |
|---|---|---|---|
| Increasing Use of Recycled Polymers in Packaging Application | +2.1% | Global, with EU and North America leading adoption | Medium term (2-4 years) |
| The Growing Awareness and Regulations Promoting Circular Economy Practices | +1.8% | EU core, expanding to APAC and North America | Long term (≥ 4 years) |
| Massive investments in recycling infrastructure | +1.5% | Asia-Pacific core, spill-over to MEA and South America | Medium term (2-4 years) |
| Growing demand from the automotive sector | +1.2% | Global, with APAC and Europe leading | Medium term (2-4 years) |
| Increasing demand in construction sector for insulation, wires and carpeting | +0.9% | North America & EU, expanding to APAC | Long term (≥ 4 years) |
| Source: Mordor Intelligence | |||
Increasing Use of Recycled Polymers in Packaging Application
Brand-owner commitments to 50% recycled content in packaging are amplifying demand, while the EU Decision 2023/2683 enforces 25% recycled plastic in PET bottles by 2025 and 30% in all beverage bottles by 2030[1]. Companies such as Berry Global reported a 43% jump in post-consumer resin consumption under its Impact 2025 roadmap. Digital watermarks and AI-enabled sorters are improving bale purity, helping converters meet food-grade safety criteria. Mono-material flexible packs further unlock mechanical routes that were previously uneconomic. These developments enhance volume certainty for the circular polymers market and nurture long-range contracts between waste managers and resin buyers.
The Growing Awareness and Regulations Promoting Circular Economy Practices
Extended producer responsibility schemes and recycled-content mandates are embedding circularity into procurement decisions. The European Regulation (EU) 2025/351 tightens purity limits and introduces traceability protocols for recycled food-contact plastics. China’s National Center for Food Safety Risk Assessment is driving regulatory convergence with US and EU standards, paving the way for formal food-contact rules in 2025. In the United States, H.R. 9676 proposes national recycling standards targeting 50% plastics recycling by 2030[2]. Such harmonization provides clearer incentives for capital allocation into next-generation recycling assets.
Massive Investments in Recycling Infrastructure
Global recycling-infrastructure investment totaled USD 160 billion between 2018 and mid-2023, focusing on collection, sorting, and advanced recycling capacity. LyondellBasell’s integrated hub in Knapsack and its EUR 40 million chemical recycling plant in Germany exemplify large-scale European projects. TotalEnergies transformed Grandpuits into France’s first zero-crude platform, complete with a 15 kiloton-per-year advanced recycling unit. Indorama Ventures’ joint ventures in India add 100 kilotons of rPET capacity annually. These projects collectively broaden feedstock coverage and underpin forecast growth in the circular polymers market.
Growing Demand from the Automotive Sector
Automakers embed secondary polymers to reduce weight and meet carbon goals. BMW plans up to 50% secondary content in its Neue Klasse vehicles while its Munich site moves to all-EV production by 2027. RadiciGroup produced an air-intake manifold from 100% recycled polyamide, cutting lifecycle CO₂ by 70%. Ford integrates post-consumer plastics into interior parts as part of its closed-loop strategy. The revised 2023 EU End-of-Life Vehicles Directive embeds recycled-plastic thresholds, supporting polymer demand beyond packaging.
Restraints Impact Analysis of Circular Polymers Market*
| Restraint | (~) % Impact on CAGR Forecast | Geographic Relevance | Impact Timeline |
|---|---|---|---|
| Feed-stock contamination variability | -1.4% | Global, particularly affecting food-grade applications | Short term (≤ 2 years) |
| Low-oil-price cost disadvantage | -0.8% | Global, with higher impact in cost-sensitive markets | Short term (≤ 2 years) |
| High initial capital expenditure (CAPEX) | -0.6% | Emerging markets and smaller players | Medium term (2-4 years) |
| Source: Mordor Intelligence | |||
Feedstock Contamination Variability
Analytical studies found 191 pesticides and 107 pharmaceuticals in recycled pellets from multiple countries, underscoring persistent contamination risks that can breach food-contact limits. Separate collection of HDPE milk bottles mitigates cross-contamination, yet seven contamination pathways remain during mechanical reprocessing. AI-enabled sorters and digital watermarks improve homogeneity but raise CAPEX for small recyclers. These challenges add qualification costs for converters pursuing food-grade approvals, tempering near-term growth in the circular polymers market.
Low-Oil-Price Cost Disadvantage
Virgin-polymer spot prices periodically undercut recycled resin when crude prices decline, eroding recycling margins. Pyrolysis oil trades at USD 600-900 per ton while syngas delivers lower revenue streams, making profitability sensitive to fossil-fuel benchmarks. The Institute for Energy Economics and Financial Analysis reported that US virgin polypropylene prices were below recycled equivalents during most of 2024[3]. Policy options such as production caps on virgin plastics are under discussion to stabilize economics for the circular polymers market.
*Our forecasts treat driver/restraint impacts as directional, not additive. The impact forecasts reflect baseline growth, mix effects, and variable interactions.
Circular Polymers Market Segment Analysis
By Polymer:
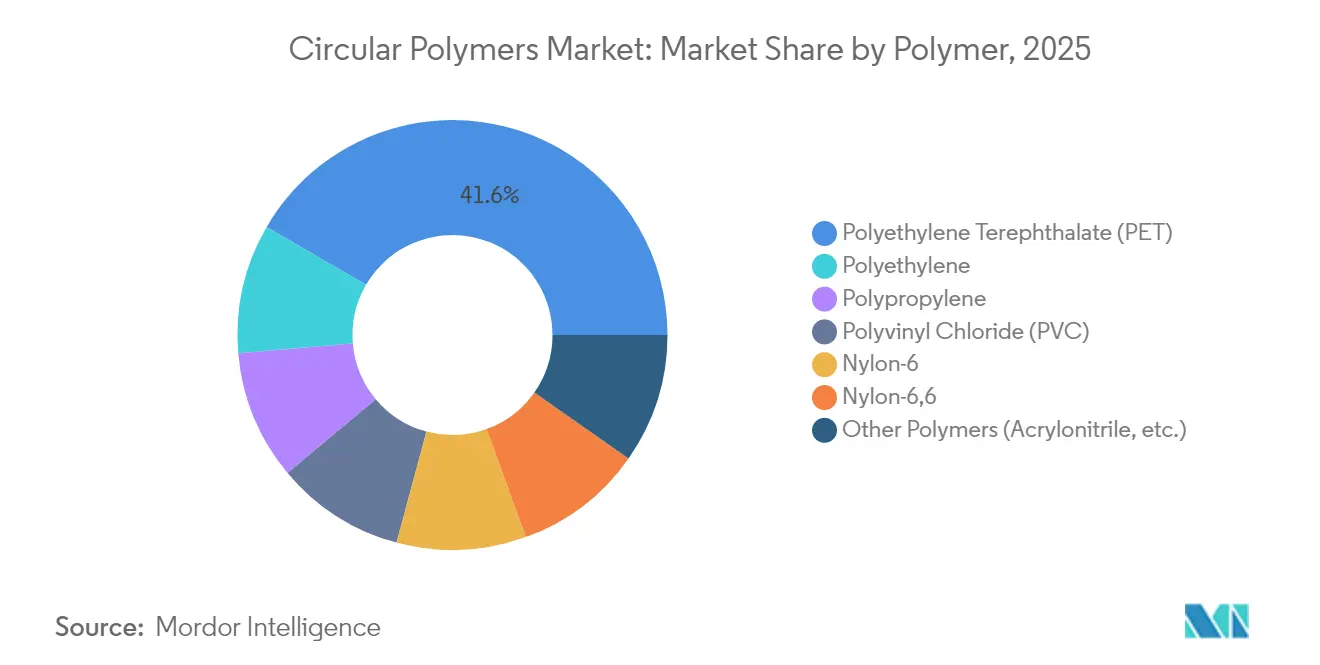
PET Dominance Meets Nylon InnovationPET accounted for 41.62% of the circular polymers market in 2025 owing to established bottle-to-bottle loops and global brand adoption. India reached a 95% PET-bottle recycling rate with 500,000 tons annual capability. PET also benefits from clear food-grade approval pathways, positioning it for incremental gains as beverage producers ramp up recycled content. Mechanical flake pricing remained within 4% of virgin resin during late 2024, narrowing the cost hurdle.
Nylon-6 represents the fastest-growing polymer at an 8.37% CAGR through 2031. Catalyst-driven depolymerization fields high-purity caprolactam in seconds without solvents and achieves over 90% monomer recovery. Automotive lightweighting and high-performance textiles favor nylon recyclates with verified mechanical parity. Continuous-loop pilot plants in Germany and Japan plan commercial output by 2026, adding depth to the circular polymers market.
Polyolefins leverage mechanical upgrades that slash mPP recyclate costs by 30%, but food-grade compliance remains challenging. Dissolution processes evacuate pigments and odorous compounds from polypropylene at 0.32 kg CO2-equivalent emissions per kg recycled PP, opening high-value packaging uses. PVC recycling requires dechlorination, elevating processing complexity. Specialty resins such as ABS and polycarbonate register slower growth yet gain traction in consumer-electronics take-back schemes.

By Recycling Technology:
Mechanical Dominance Challenged by Chemical InnovationMechanical recycling controlled 64.35% of the circular polymers market in 2025 thanks to incumbency and lower cost. Design-for-recycling guidelines and circuit-board grade sorters trimmed polypropylene recyclate production costs by nearly one-third, lifting margins. However, mechanical pathways still struggle with multilayer films and contaminated oceanside collections.
Chemical recycling expands at an 8.29% CAGR as pyrolysis, gasification, and solvent-based recovery unlock complex feedstocks. TotalEnergies’ Grandpuits unit produces 10,000 tons of pyrolysis oil yearly that is re-polymerized into certified circular polymers. Dissolution processes separate nylon from cotton in textile blends without compromising fiber strength. Energy-recovery plants with heat capture remain the lowest-value outlet, and critics argue they may divert feedstock from higher-value loops, an ongoing policy debate in the circular polymers market.
By End-user Industry:
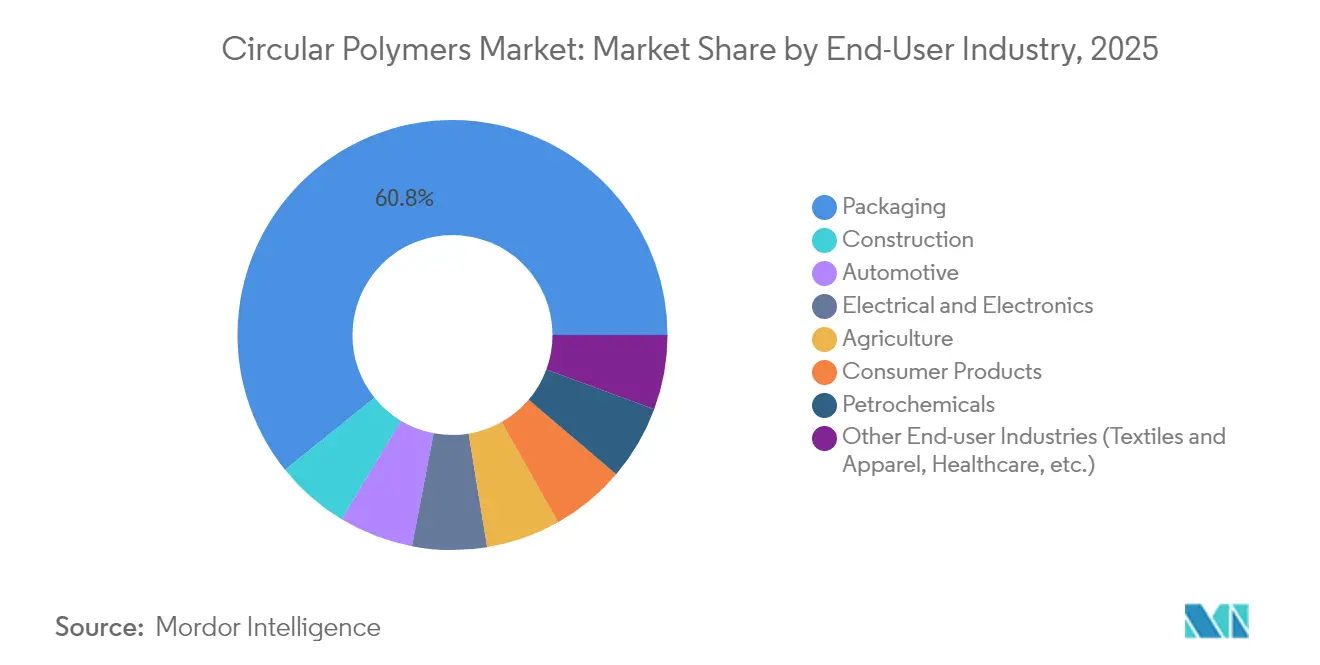
Packaging Leadership Drives InnovationPackaging retained 60.78% share of the circular polymers market in 2025 under the combined force of regulation and brand commitments. Tetra Pak and Lactalis progressed mono-material cartons, and Braskem launched bio-circular polypropylene sourced from used-cooking oil for food packaging. Sorting technologies with near-infrared spectroscopy and robotics increased food-grade yields, meeting stricter migration limits under EU Regulation 2025/351.
The other end-user industries cluster grows at a 8.61% CAGR, reflecting momentum in apparel, healthcare, and household goods. Study data show recycled-plastic concrete mixes raising compressive strength by 15% while saving embedded emissions. In mobility, fishing-net-derived PA6 composites delivered 23% higher tensile strength, aligning with automaker CO2 targets. Electrical components adopt flame-retardant recyclates that meet UL 94 V-0 standards, broadening addressable market volume.
Geography Analysis
Europe Circular Polymers Market
Europe held 31.22% of the circular polymers market share in 2025, anchored by stringent circular-economy directives and robust collection networks. The EU Packaging and Packaging Waste Regulation imposes staged recycled-content mandates, while the General Product Safety Regulation tightens product labeling and safety standards. Supply-demand imbalances for high-quality recyclate create premiums of up to USD 250 per ton over conventional grades, intensifying intra-EU trade in secondary polymers. Investments like LyondellBasell’s EUR 40 million chemical-recycling plant and Borealis’ Borcycle M compounding line in Belgium shore up local supply. Circularity gaps remain, prompting import partnerships with Asia-based suppliers.
APAC Circular Polymers Market
Asia-Pacific records a 8.46% CAGR through 2031, the fastest among regions. China achieves a 96.48% PET-bottle recycling rate, yet only 30% of an estimated 63 million tons of overall plastic waste is recycled, leaving scope for rapid growth. India mandates 30% recycled content by 2025-2026, rising to 60% by 2028-2029, catalyzing capital inflow. Indorama Ventures’ joint platform with Dhunseri and Varun Beverages adds 100 kilotons annual rPET capacity, and Ganesha Ecopet targets 42,000 tons yearly by 2026.
North America Circular Polymers Market
North America benefits from mature mechanical lines and expanding chemical-recycling pilots. The US H.R. 9676 bill seeks 50% plastics-recycling rates by 2030, establishing unified national standards that could streamline feedstock flows. Mexico and Canada adopt compatible labeling schemes, easing regional trade in recycled flakes and pellets.
South America and MEA Circular Polymers Market
South America and the Middle East & Africa form emerging growth pockets. Brazil’s PET-bottle recycling rate rose to 56.4% by 2024 under ANVISA’s food-safety oversight. Saudi Arabia’s Vision 2030 tasks the Saudi Investment Recycling Company with achieving 95% waste recycling, eyeing SAR 120 billion GDP contribution. Project pipelines across the Gulf Cooperation Council include solvent-based recovery plants positioned to serve Asian converters.
Regulatory Landscape
The regulatory landscape for circular polymers is anchored by the European Union's Packaging and Packaging Waste Regulation (PPWR), which entered into force in February 2025 and is driving harmonized recycled-content rules across member states. Implementing Decision (EU) 2026/1425, published June 30, 2026, sets out rules for calculating, verifying, and reporting recycled plastic content, including mass-balance approaches and chain-of-custody verification via schemes such as ISCC PLUS. Beyond Europe, extended producer responsibility and reporting obligations are expanding globally, but standards remain fragmented (ISO 15270, EN 15343, ASTM). The UN Global Plastics Treaty INC 5.4 is scheduled for September/October 2026, which keeps regulatory scrutiny elevated across polymer production, recycling, and packaging supply chains.
Value Chain Analysis
The circular polymers value chain runs from post-consumer collection and sorting to pre-processing, including AI-enabled sorting and digital watermark identification. Feedstocks are then converted through mechanical recycling (flakes, pellets) or chemical routes such as pyrolysis oil, depolymerized monomers, and solvent-based dissolution. The resulting intermediates are compounded and polymerized into circular grades, then distributed through converters into packaging, automotive, construction, and electrical and electronics applications. Certification and testing, including food-contact migration and traceability, act as gating steps, while mass-balance accounting enables attribution of recycled content for ISCC PLUS certification. The 19% of EU converter demand met by imports as of 2026 highlights the role of integrated ecosystems that connect waste-management partners with chemical and polymer producers, with feedstock availability, bale purity, and cross-border flows forming the most visible bottlenecks, particularly in Europe.
Competitive Landscape
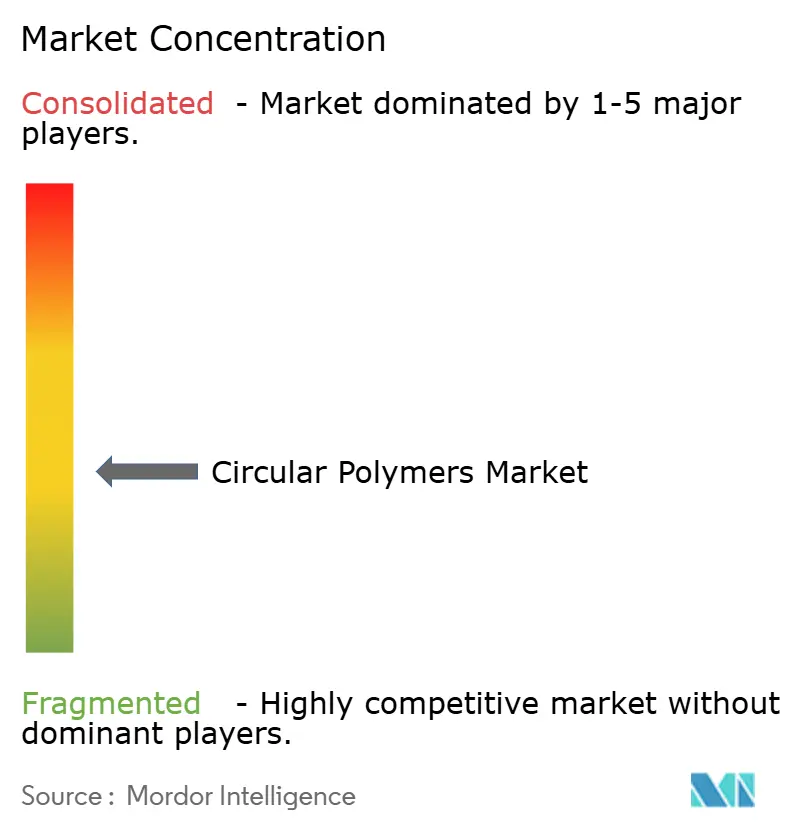
The circular polymers market is moderately fragmented, with traditional petrochemical firms leveraging scale and integrated feedstock networks, while specialist recyclers drive innovation. LyondellBasell acquired a 25% stake in the Cyclyx joint venture with Agilyx and ExxonMobil, gaining access to waste-sorting capacity and pyrolysis technology. Agilyx operates Circularity Centers with 20 patents on waste optimization and depolymerization. SABIC’s TRUCIRCLE program commercialized mixed-plastic recycling and established traceable downstream partnerships. TotalEnergies, in collaboration with Plastic Energy, targets 1 million tons of circular output by 2030. Patent filings focus on catalyst advancements and sensor-assisted sorting technologies. High CAPEX for chemical-recycling plants and stringent food-grade qualification protocols remain key entry barriers. Midsize recyclers mitigate risks through toll-processing contracts, ensuring closed-loop traceability.
Circular Polymers Industry Leaders
-
SABIC
-
Borealis GmbH
-
LyondellBasell Industries Holdings B.V.
-
Plastic Energy
-
Veolia
- *Disclaimer: Major Players sorted in no particular order
Circular Polymers Market Companies Covered in this Report
- Agilyx
- Biffa
- Borealis GmbH
- Braskem
- Chevron Phillips Chemical Company LLC.
- Eastman Chemical Company
- Enerkem
- Exxon Mobil Corporation
- Jindal Poly Films Limited (JPFL)
- KW Plastics
- Loop Industries
- LyondellBasell Industries Holdings B.V.
- Plastic Energy
- SABIC
- TotalEnergies
- Veolia
- Visy
Market Opportunities and Future Outlook
The main opportunity is scaling verified recycled-content supply for regulated packaging segments where auditable calculation methods and consistent quality are required. In the European Union, Implementing Decision 2026/1425 strengthens the business case for certified circular polymers and mass-balance offerings, supporting standardized procurement specifications across multiple countries. Outside the EU, integrated circular ecosystems are also expanding where leakage and under-collection constrain feedstock availability. Borealis and Borouge are pursuing an East Java, Indonesia feasibility study for an integrated circular polyolefin recycling ecosystem, while LyondellBasell is adding capacity with MoReTec-1 in Wesseling, Germany (target around 50,000 metric tons per year). SABIC and Plastic Energy operate SPEAR for TACOIL production from post-consumer plastic in Geleen, Netherlands, illustrating end-to-end recycling potential from waste collection through feedstock and polymer production.
Recent Industry Developments in Circular Polymers Market
- July 2026: LyondellBasell announced collaboration with Mondelez International, Amcor, and Taghleef Industries for Marabou chocolate packaging using CirculenRevive polymers with 100 percent attributed recycled content. The collaboration expands closed-loop packaging supply chains with OEM partners and highlights mass-balance recycled content validation in consumer goods.
- June 2026: LyondellBasell received a sustainability award from Toyota Motor Europe for developing post-consumer recycled polymer solutions derived from end-of-life fishing nets. The award points to progress in automotive recycling and supports policy-driven demand for recycled polymers in higher-value applications.
- March 2026: SABIC launched LNP ELCRIN SLX compounds using post-consumer recycled content and introduced KONDUIT WTF2C compound for automotive ADAS components at PIAE 2026. This extends SABIC’s recycled-polymers portfolio into functionality-critical automotive components and shows deeper integration with chemical recycling pathways.
Circular Polymers Market Report Scope and Research Methodology
Market Definition and Coverage
For this study, the circular polymers market covers polymer materials that stay in use through recycling and circular feedstock routes, where the output is sold back into manufacturing as recycled or circular-grade resin.
Scope exclusions: We exclude virgin polymer volumes that are not linked to recycled content or circular feedstock claims, and we also exclude downstream finished plastic products.
Segments Covered in This Report
- By Polymer
- Polyethylene Terephthalate (PET)
- Polyethylene
- Polypropylene
- Polyvinyl Chloride (PVC)
- Nylon-6
- Nylon-6,6
- Other Polymers (Acrylonitrile, etc.)
- By Recycling Technology
- Mechanical Recycling
- Chemical Recycling
- Dissolution / Solvent-based
- Pyrolysis & Gasification (Feedstock)
- Energy Recovery (Incineration with Heat Capture)
- By End-user Industry
- Packaging
- Construction
- Automotive
- Electrical and Electronics
- Agriculture
- Consumer Products
- Petrochemicals
- Other End-user Industries (Textiles and Apparel, Healthcare, etc.)
- By Geography
- Asia-Pacific
- China
- India
- Japan
- South Korea
- Malaysia
- Thailand
- Indonesia
- Vietnam
- Rest of Asia-Pacific
- North America
- United States
- Canada
- Mexico
- Europe
- Germany
- United Kingdom
- France
- Italy
- Spain
- Nordic Countries
- Turkey
- Russia
- Rest of Europe
- South America
- Brazil
- Argentina
- Colombia
- Rest of South America
- Middle East and Africa
- Saudi Arabia
- United Arab Emirates
- Qatar
- South Africa
- Nigeria
- Egypt
- Rest of Middle East and Africa
- Asia-Pacific
Data Sources, Market Sizing, and Validation
Desk Research
Desk research is used to set guardrails for the model, especially for polymer supply, recycling capacity additions, and policy signals that support recycled-content demand. We typically start with official statistics and open references such as OECD and UN Environment Programme publications, Eurostat waste and recycling tables, US EPA materials data, and trade data from UN Comtrade to map plastics flows.
To keep assumptions grounded by polymer family and region, we also review sources such as industry association releases on recycling rates and design-for-recycling guidance, peer-reviewed journals that track mechanical and chemical recycling yields, and company annual reports and sustainability disclosures for stated capacity, utilization, and mass-balance output. In some cases, internal paid subscriptions are used for company financials, patent lookups, and shipment-level trade checks when public data is too aggregated. These desk sources are illustrative only, and we also used other public references for cross-checks and to clarify points during the research process.
Primary Interviews and Surveys
Primary work is used to pressure-test the desk view and close gaps between nameplate recycling capacity and saleable circular resin output. We speak with a mix of resin producers, recyclers, converters, brand-side sustainability leads, and channel participants across the Americas, EMEA, and APAC so we can check pricing, quality premiums, and certification practices against how transactions work in practice. These inputs are then used to align assumptions on yields, scrap availability, and typical contract structures before totals are finalized.
Distribution of primary research fieldwork respondents
| Company type | Respondent position | Region |
|---|---|---|
| Top tier: 36% | CXOs: 19% | APAC: 37% |
| Mid tier: 42% | Functional/Unit leaders: 38% | EMEA: 37% |
| Smaller Players: 22% | Managers: 43% | Americas: 26% |
Market-Sizing & Forecasting
Market sizing uses a mixed approach that starts with a top-down reconstruction of circular polymer output by following recycling capacity, expected utilization, and process yields, then filters the results by region and polymer type. After the demand pool is formed, we corroborate it with selective bottom-up checks, such as sampling typical price ranges and volume placements by polymer family and end use, followed by channel validation on what is actually accepted and sold as circular resin.
Key inputs for this market include collected and sorted plastic waste availability, mechanical versus chemical recycling yield loss, capacity ramp-up timelines for new plants, recycled-content rules for packaging, and the price spread between circular resin and virgin resin that shifts buying behavior. Where data is missing for smaller regions or early-stage technologies, gaps are handled using conservative utilization bands and peer-region analogs, then challenged in interviews.
For forecasting, we use scenario analysis supported by short trend models, including exponential smoothing on near-term capacity ramps, so policy enforcement timing and feedstock constraints are reflected without overfitting. The final forecast is signed off only after the variable paths are agreed as reasonable by primary respondents, especially for utilization, yield improvements, and circular price premiums.
Data Validation & Update Cycle
Validation is done in layers so the outputs match independent signals such as recycling rate movement, announced capacity and commissioning dates, and regional plastics demand growth. We run variance checks to spot jumps that are not explained by changes in utilization, yield, or policy timing, and then the model is reviewed by another analyst before sign-off.
The report is refreshed annually, and interim updates are triggered when large capacity announcements, regulatory changes, or major shifts in resin pricing materially change the demand pool. Before delivery, a fresh review pass is completed so the numbers reflect the latest public releases and any new learnings from interviews.
Mordor Intelligence's Circular Polymers Market Size Compared With Other Published Estimates
Published estimates for circular polymers can differ widely because the market is defined in different ways, and some sources mix volume-based views with value-based views without clearly bridging one to the other. Differences also come from how quickly pricing assumptions are refreshed, how currencies are normalized, and whether plant ramp-ups are validated against realistic utilization.
When ASPs are updated with recent contract ranges and currency timing is kept consistent with the base-year window, the size calculation changes even if the underlying tonnage story remains similar. This refresh-led discipline is applied by Mordor Intelligence so short-term price swings do not distort the trend.
Benchmark comparison
| Source | Market Size | Gaps in Research Methodology |
|---|---|---|
| Mordor Intelligence | USD 20.09 M (2025) | |
| Trade Journal A | USD 80.05 B (2024) | Uses a value-only lens that appears to bundle adjacent recycled plastics and finished-product revenue, and it also applies broad pricing without separating circular resin ASPs by polymer type. |
| Industry Portal B | USD 72.40 B (2023) | Back-casts from long-range CAGR targets and mixes years and exchange-rate timing, which can inflate near-term totals when resin price premiums are assumed to be uniform. |
The spread is mainly explained by whether the estimate is counting circular resin volumes only or is extending into wider recycled plastics value pools with different price bases. By keeping the scope tied to saleable circular polymer output and by updating pricing and currency inputs on a consistent cadence, the final number is easier to trace back to clear levers and repeatable steps.
Key Questions Answered in the Report
What is the projected size of the circular polymers market by 2031?
The circular polymers market size is expected to reach 30.86 million tons by 2031, reflecting a 7.42% CAGR over the 2026-2031 forecast period.
Which region leads the circular polymers market today?
Europe holds the largest regional position with 31.22% of the circular polymers market share in 2025, driven by stringent recycled-content mandates.
Which polymer dominates recycled volumes?
PET leads with 41.62% share in 2025 due to well-established bottle-to-bottle loops and regulatory support for food-grade applications.
What technology currently processes most feedstock?
Mechanical recycling maintains 64.35% of circular polymers market share in 2025 thanks to mature infrastructure and favorable economics.