
Circular Dichroism Spectrometers Market Size and Share
Market Overview
| Study Period | 2020 - 2031 |
|---|---|
| Market Size (2026) | USD 39.35 Million |
| Market Size (2031) | USD 56.3 Million |
| Growth Rate (2026 - 2031) | 7.44 % |
| Fastest Growing Market | Asia Pacific |
| Largest Market | North America |
| Market Concentration | Medium |
Major Players *Disclaimer: Major Players sorted in no particular order Image © Mordor Intelligence. Reuse requires attribution under CC BY 4.0. | |
Circular Dichroism Spectrometers Market Analysis by Mordor Intelligence
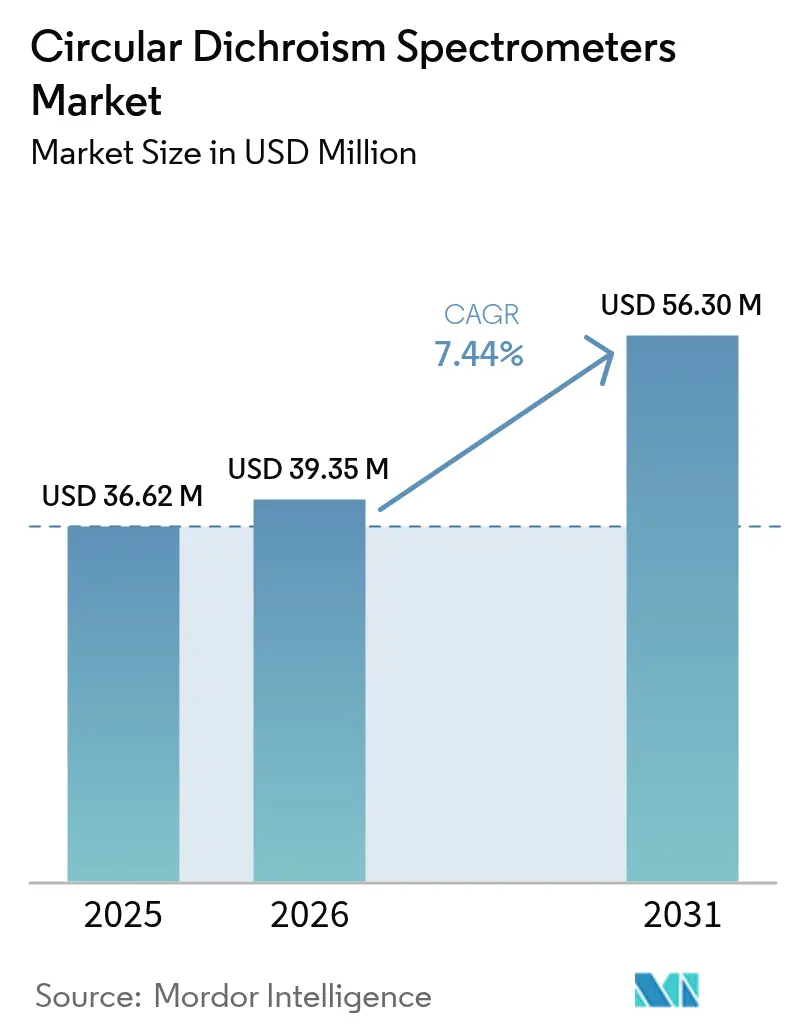
The Circular Dichroism Spectrometers market size was valued at USD 36.62 million in 2025 and estimated to grow from USD 39.35 million in 2026 to reach USD 56.3 million by 2031, at a CAGR of 7.44% during the forecast period (2026-2031). In practice, the sector’s momentum is anchored in biopharmaceutical manufacturing scale-up, rising biosimilar pipelines, and tighter FDA-EMA expectations for higher-order protein structure validation[1]. Demand is additionally supported by NIH and NSF funding streams that keep academic core facilities well capitalized. Supply-side advances—most notably benchtop automation and quantum-cascade-laser vibrational CD—lower per-sample costs and broaden usability. Meanwhile, mid-sized contract research organizations (CROs) increasingly purchase multi-user systems and convert capital outlays into fee-for-service revenues, injecting new volume into the Circular Dichroism Spectrometers market. Technology convergence around process analytical technology further insulates vendors from routine research budget swings, embedding instruments directly into continuous biologics production lines.
Key Report Takeaways
- By product type, benchtop instruments led with 44.78% of Circular Dichroism Spectrometers market share in 2025, while floor-standing systems are poised for the quickest uptake through 2031.
- By technology, electronic CD accounted for 54.88% share of the Circular Dichroism Spectrometers market size in 2025; synchrotron radiation CD is projected to log the fastest CAGR over the same horizon.
- By application, protein secondary-structure determination held 25.21% of the Circular Dichroism Spectrometers market size in 2025, whereas biosimilar comparability testing is on track for the sharpest growth to 2031.
- By end-user, pharmaceutical and biotechnology companies captured 42.15% revenue share of the Circular Dichroism Spectrometers market in 2025; CROs and CMOs are expected to grow at the highest pace.
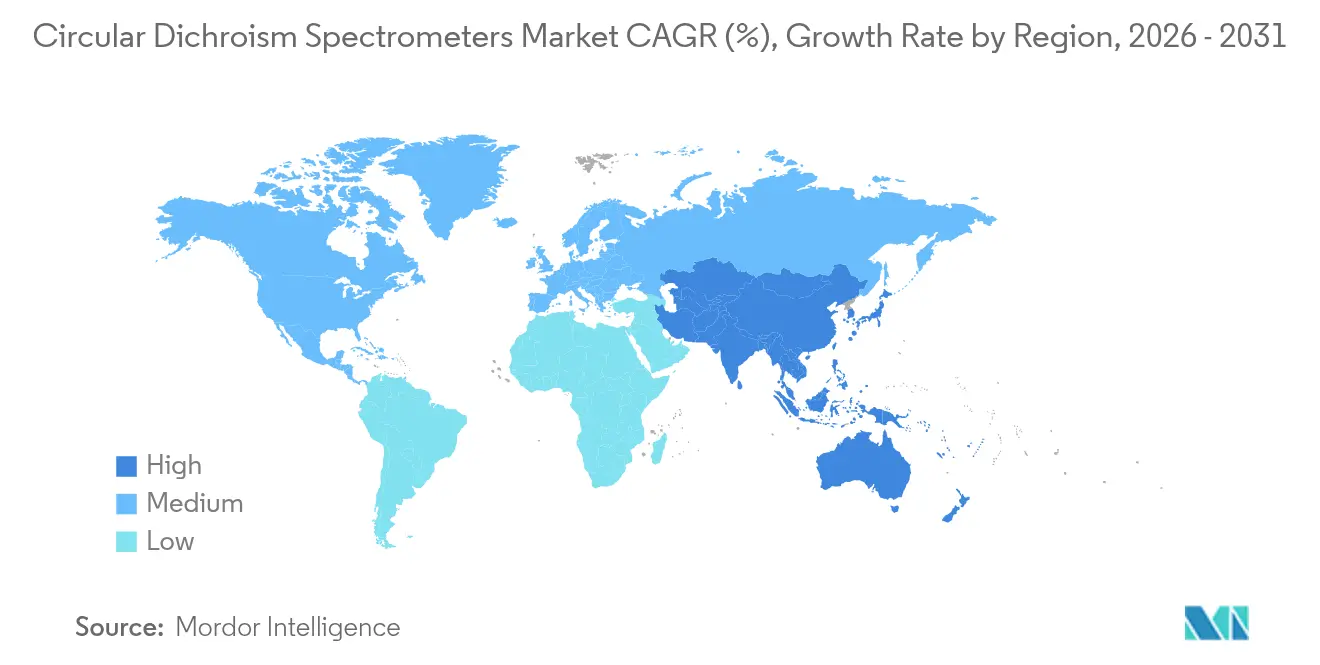
- By geography, North America retained 38.10% share of the Circular Dichroism Spectrometers market in 2025, but Asia-Pacific is expanding at an 8.41% CAGR to 2031.
Note: Market size and forecast figures in this report are generated using Mordor Intelligence’s proprietary estimation framework, updated with the latest available data and insights as of 2026.
Market Trends and Insights
Drivers Impact Analysis of Circular Dichroism Spectrometers Market*
| Driver | (~) % Impact on CAGR Forecast | Geographic Relevance | Impact Timeline |
|---|---|---|---|
| Expansion of global biopharmaceutical manufacturing | +1.8% | North America, EU, China | Medium term (2-4 years) |
| Rising R&D expenditure in life sciences instrumentation | +1.2% | North America & EU core; spill-over to APAC | Long term (≥4 years) |
| Technological innovations in circular dichroism hardware | +0.9% | Global | Short term (≤2 years) |
| Growing demand for protein structure analysis in drug discovery | +1.4% | North America, EU, China | Medium term (2-4 years) |
| Increasing academic funding for structural biology research | +0.7% | North America & EU | Long term (≥4 years) |
| Emergence of integrated spectroscopy platforms for process analytical technology | +0.6% | Global | Short term (≤2 years) |
| Source: Mordor Intelligence | |||
Expansion of Global Biopharmaceutical Manufacturing
Biologic plants shifting toward continuous production embed CD probes directly into process lines for real-time folding validation, driving higher-throughput specifications and favoring floor-standing systems. Bruker’s 2024 revenue spike of USD 3.37 billion underscores the instrumentation pull-through tied to these capital projects. Vendors now bundle automated cuvette changers and GMP-ready software, shortening operator intervention time and aligning with 21 CFR Part 11 expectations. Larger batch-release volumes encourage multi-year service contracts that lock in annuity revenue. Together, these factors add a sturdy compliance floor beneath the Circular Dichroism Spectrometers market.
Rising R&D Expenditure in Life Sciences Instrumentation
NIH’s FY 2025 request of USD 50.1 billion keeps grant-backed lab upgrades on pace, while the NSF’s USD 40 million protein-design initiative anchors demand for advanced structure-validation kits[2]. Academic consortia consolidate purchasing power, opting for benchtop instruments equipped with AI-driven spectral deconvolution that handles diverse protein libraries. Procurement cycles increasingly specify multi-detector packages, rewarding manufacturers able to ship turn-key systems. These funding dynamics promote steady instrument refresh intervals, buttressing the Circular Dichroism Spectrometers market.
Technological Innovations in Circular Dichroism Hardware
JASCO’s quantum-cascade-laser vibrational CD unit moves routine scans from minutes to seconds, letting formulators identify chiral impurities early in discovery workflows. CRAIC Technologies follows with CD microspectroscopy capable of single-cell resolution, extending utility into cell-therapy quality checks. Such premium instruments push the upper limit of average selling prices even as unit volumes stay modest. At the same time, component miniaturization filters down to entry-level benchtop systems, expanding total addressable installations. Rapid innovation reinforces vendor differentiation and sustains a healthy Circular Dichroism Spectrometers market.
Growing Demand for Protein Structure Analysis in Drug Discovery
FDA biosimilar guidance mandates higher-order structure equivalence, cementing CD as a staple assay across originator and follow-on products. Harvard Medical School’s core facility doubled CD usage hours in 2024 to validate ligand-induced conformational shifts. Fragment-based screening groups appreciate CD’s solution-state readout, which reduces crystal-formation bottlenecks. These laboratory realities translate into predictable reorder cycles for light sources, cells, and nitrogen purifiers, adding service revenue layers that enhance vendor margins inside the Circular Dichroism Spectrometers market.
Restraints Impact Analysis of Circular Dichroism Spectrometers Market*
| Restraints Impact Analysis | (~) % Impact on CAGR Forecast | Geographic Relevance | Impact Timeline |
|---|---|---|---|
| High capital and operational costs of CD systems | -1.1% | Global; most acute in emerging markets | Short term (≤2 years) |
| Limited availability of trained spectroscopy professionals | -0.8% | Global; pronounced in APAC | Medium term (2-4 years) |
| Growing preference for high-resolution alternative methods | -0.7% | North America & EU | Long term (≥4 years) |
| Regulatory validation challenges for new CD technologies | -0.4% | Global | Medium term (2-4 years) |
| Source: Mordor Intelligence | |||
High Capital and Operational Costs of CD Systems
Premium systems can exceed USD 250,000 once GMP software and service agreements are added, straining capital budgets for first-time buyers. Supply-chain tariffs risk adding 10–15% to landed costs for U.S. importers of optics sub-assemblies[3]. Operational expenses include liquid-nitrogen logistics, lamp replacements, and specialized calibrants, lifting total cost of ownership. Shared-facility models relieve part of that burden but produce reservation bottlenecks that deter time-sensitive experiments. These factors collectively temper high-growth optimism for the Circular Dichroism Spectrometers market in price-sensitive regions.
Limited Availability of Trained Spectroscopy Professionals
Undergraduate curricula seldom cover CD spectroscopy, leaving early-career chemists dependent on vendor workshops for method proficiency. Global CROs often recruit internationally to fill skill gaps, which increases onboarding costs and risks turnover. Automated analysis software helps, yet advanced troubleshooting still demands human expertise. This talent bottleneck slows instrument utilization ramp-up, creating latent capacity that masks potential demand in the Circular Dichroism Spectrometers market.
*Our forecasts treat driver/restraint impacts as directional, not additive. The impact forecasts reflect baseline growth, mix effects, and variable interactions.
Circular Dichroism Spectrometers Market Segment Analysis
By Product Type:
Benchtop Systems Drive Routine ApplicationsBenchtop units delivered a commanding 44.78% share of Circular Dichroism Spectrometers market size in 2025 by meeting everyday protein-fold screening needs of academic labs and mid-tier biotechs. Laboratories choose them for compact footprints, rapid scan modes, and optional automated plate readers. Floor-standing models, although fewer in absolute shipments, record the fastest unit growth because continuous-manufacturing lines require 24/7 reliability and higher s/n ratios. Specialty SRCD beamline configurations, housed at national light-sources, serve niche membrane-protein projects where extended wavelengths matter. The Harvard Medical School installation of dual J-1500s illustrates how benchtops remain central to high-throughput stability studies. Over the forecast, benchtops will continue to dominate replacement cycles, while floor-standing platforms capture green-field plants, keeping a balanced revenue mix inside the Circular Dichroism Spectrometers market.
In parallel, product upgrades blur lines between categories. Vendors now retrofit benchtops with robotic autosamplers once exclusive to large systems, letting smaller labs process 96-well plates overnight. Conversely, floor-standing models incorporate modular optics so users swap in UV, visible, or mid-IR heads without factory service visits. This feature parity compresses the historical price spread yet supports differentiated value propositions around throughput and robustness. Ultimately, evolving lab workflows ensure both product classes expand, reinforcing the broad opportunity base across the Circular Dichroism Spectrometers market.


By Technology:
Electronic CD Maintains Dominance Despite Emerging AlternativesElectronic CD still held 54.88% of Circular Dichroism Spectrometers market share in 2025 because its far-UV range delivers the alpha-helix and beta-sheet fingerprints prized by protein scientists. The method’s mature validation guides ease regulatory submissions, making it the default for batch-release assays. Synchrotron Radiation CD, while confined to beamline access, posts the briskest CAGR as national facilities open industrial queue time and deliver wavelengths down to 170 nm unattainable on conventional optics. Vibrational CD elbows into chiral-small-molecule QA/QC, though current users remain pharma stereochemistry groups ready to pay for quantum-cascade-laser sources. JASCO’s mid-IR quantum-cascade bench system demonstrates that VCD can migrate from niche to daily workflow by shortening acquisition times from hours to minutes.
Cross-pollination among these technologies is growing. Software packages increasingly allow spectral overlay across electronic and vibrational regimes, providing a single-view protein backbone plus side-chain chirality. Portable SRCD add-ons are under evaluation, but beamtime availability stays the gating factor. Over the outlook, Electronic CD will remain the workhorse while SRCD and VCD supply premium margins, preserving a tiered pricing architecture across the Circular Dichroism Spectrometers market.
By Application:
Biosimilar Testing Accelerates GrowthProtein secondary-structure determination represented 25.21% of Circular Dichroism Spectrometers market size in 2025 because every new biologic or vaccine candidate passes through early fold confirmation. Yet biosimilar comparability testing outpaces all other uses thanks to the ICH Q6B mandate for higher-order structure matching. CD’s speed and low sample consumption make it a frontline assay before more resource-intensive hydrogen-deuterium exchange or cryo-EM. Creative Proteomics’ expansion of far-UV CD services exemplifies how CROs monetize this regulatory need. Downstream, routine batch-release testing stays steady, and fragment-based drug-discovery screens broaden the customer base to small biotech startups.
Vaccinology projects inject further upside. mRNA platforms depend on correct folding of lipid-nanoparticle encapsulation proteins, a parameter CD reads quickly without extensive purification. Field-deployable CD modules are under pilot in GMP fill-finish suites, where operators verify protein antigens inline during lot release. Such new-use cases diversify revenue channels and support the resilient expansion of the Circular Dichroism Spectrometers market.

By End-User:
CRO Outsourcing Transforms Market DynamicsPharmaceutical and biotechnology companies together accounted for 42.15% revenue in 2025, purchasing instruments for core R&D and lot release. However, CROs and CMOs record the sharpest volume uptake because they service multiple sponsors, maximizing utilization per capital dollar. Agilent’s Life Sciences segment posted USD 647 million in Q1 2025, attributing part of its 4% rise to outsourced analytical testing growth. Academic and government labs, fueled by NIH block grants, sustain a steady refresh cadence but rarely surge beyond single-digit growth. Hospital diagnostic labs remain experimental users, piloting CD for conformational disease biomarkers, a niche that could mature post-2030.
Outsourcing momentum reorganizes the sales funnel. Vendors increasingly negotiate fleet-level agreements with CRO holding groups, bundling multi-year service plus remote calibration. This shift nudges product-mix toward high-capacity instruments with validated 21 CFR Part 11 audit trails. As these trends evolve, all customer classes benefit from economies of scale, ensuring a well-distributed demand base across the Circular Dichroism Spectrometers market.
Geography Analysis
North America Circular Dichroism Spectrometers Market
North America retained 38.10% of Circular Dichroism Spectrometers market share in 2025, buoyed by mature biologics pipelines, FDA’s rigorous analytical expectations, and a well-funded academic ecosystem. The NIH’s 2025 appropriation of USD 50.1 billion guarantees consistent instrument refresh rates at shared facilities. A possible 10-15% tariff on critical optics assemblies could lift short-term prices, but warranty discounts and lease models cushion the blow. Canada’s vaccine-manufacturing build-out amplifies regional procurement, particularly for floor-standing CD lines designed for GMP production floors.
APAC Circular Dichroism Spectrometers Market
Asia-Pacific is the fastest-expanding arena at an 8.41% CAGR through 2031, propelled by China’s modern biologic clusters, India’s aggressive biosimilar targets, and Japan’s investment in regenerative medicine quality tools. Chinese CD vendors focus on cost-optimized benches, but global players win large-capacity orders at multinational joint-ventures needing FDA-ready validation packages. India’s state-sponsored biotech parks bundle equipment financing, unlocking demand among start-ups. This regional momentum reduces historical dependency on imported second-hand gear and accelerates premium segment penetration across the Circular Dichroism Spectrometers market.
Europe, LATAM and Middle East Circular Dichroism Spectrometers Market
Europe exhibits balanced but slower growth, stabilizing around large pharma refurbishments and Horizon Europe research calls. Germany and Switzerland continue to invest in high-precision CD for membrane-protein drug work, while the UK’s post-Brexit customs shifts require longer planning windows for instrument delivery. Eastern European CROs emerge as price-competitive service hubs, purchasing mid-tier CD units to attract western sponsors. Smaller but notable gains surface in Latin America and the Middle East, where local vaccine initiatives spur pilot lab construction. However, limited spectroscopy talent and sporadic funding cycle volatility temper near-term upside in those regions.
Regulatory Landscape
Circular dichroism (CD) spectrometers are mainly regulated as laboratory analytical instruments, but they can shift toward medical device pathways when marketed for medical diagnostic use. In the United States, intended-use claims drive risk-based classification under FDA medical device regulations (including 21 CFR Part 860), along with general and special controls. Systems deployed in GMP environments also tend to align software and data-integrity features with 21 CFR Part 11 expectations already built into biopharma workflows.
In Europe, CD systems used as medical devices fall under Regulation (EU) 2017/745 (MDR), with conformity assessment requirements varying by classification and intended purpose. Standardization further affects validation practices in regulated bioanalysis, with ISO/TS 23459:2021 outlining protocols for assessing protein secondary structure using ultraviolet CD. Its confirmed status as of mid-2024 supports consistent comparability and higher-order structure workflows referenced in biosimilar and biologics development.
Competitive Landscape
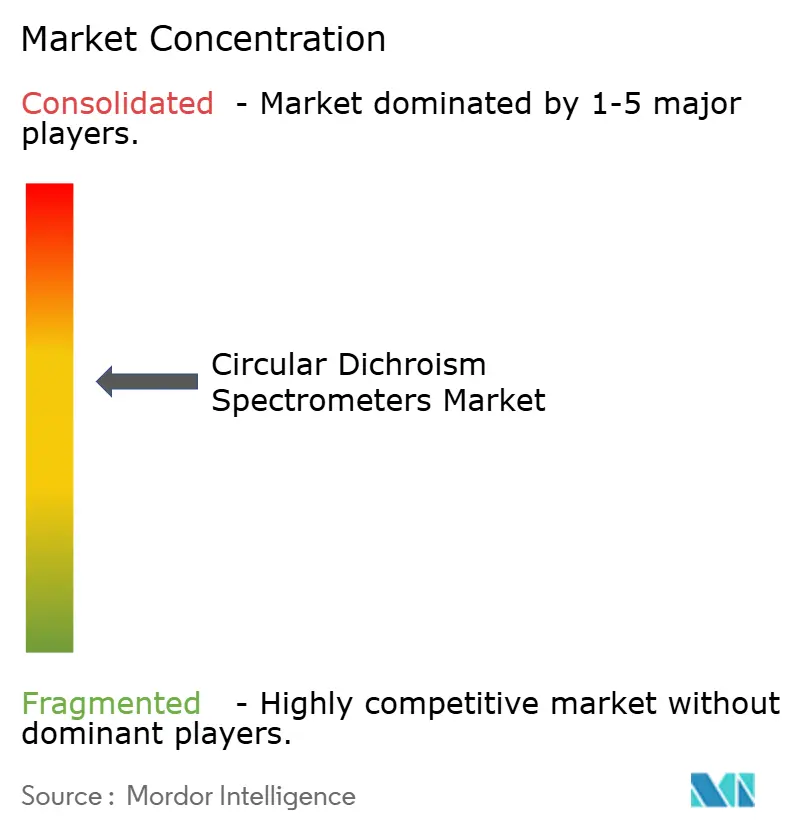
The circular dichroism spectrometers market shows moderate fragmentation. JASCO, Bruker, and Applied Photophysics hold entrenched channel relationships and comprehensive portfolios ranging from entry benches to SRCD systems. Bruker leverages its USD 3.37 billion 2024 revenue base to cross-bundle CD with NMR and FTIR packages, capturing enterprise-wide capital allocations. JASCO differentiates with rapid-scan UV-CD and turnkey pharma-compliance software suites, while Applied Photophysics champions stopped-flow CD for kinetic studies, an under-served niche.
Emerging firms inject disruptive pressure. CRAIC Technologies’ single-cell CD microscope at sub-micron resolution targets cell-therapy QC, a frontier unavailable to incumbent designs. Hinds Instruments integrates CD with plate readers, shortening lead-times for fragment library screens. Broader analytical giants, including Thermo Fisher Scientific, showcase complementary platforms at global expos, signaling potential entry via acquisition or internal R&D.
Strategic rivalry increasingly centers on software ecosystems. Vendors that furnish AI-powered spectral deconvolution and GMP-grade audit trails command higher average selling prices and lock in aftermarket revenue. Service portfolios—spanning preventive maintenance, operator certification, and 24/7 remote diagnostics—serve as tiebreakers in competitive bids. With high technical barriers but visible consolidation pathways, market players actively explore alliances to shrink development costs and broaden geographic reach, knitting an evolving yet stable environment for the circular dichroism spectrometers market.
Circular Dichroism Spectrometers Industry Leaders
-
JASCO
-
Bruker
-
Applied Photophysics
-
Bio-Logic Science Instruments
-
Hinds Instruments
- *Disclaimer: Major Players sorted in no particular order
Circular Dichroism Spectrometers Market Companies Covered in this Report
- Jasco
- Bruker
- Applied Photophysics
- Bio-Logic Science Instruments
- Hinds Instruments
- Thermo Fisher Scientific
- Agilent Technologies
- Shimadzu
- CRAIC Technologies
- Aviv Biomedical
- ISS
- Ocean Insight
- Quantum Design International
- HORIBA Scientific
- SpectroPolaritek
Market Opportunities and Future Outlook
A near-term whitespace for vendors is in regulated, high-throughput biopharma characterization where CD transitions from a single-user research tool to an automated, auditable workflow. Demand signals include the shift toward microplate-based and low-volume sampling configurations, such as 96-well high-throughput CD setups like JASCO HTCD Plus, and software stacks that center on compliant data handling (audit trails, electronic signatures) aligned with 21 CFR Part 11 practices. That combination supports differentiated offerings bundling autosamplers, validated methods, and application libraries tailored to biosimilar comparability and lot-to-lot higher-order structure checks.
A second opportunity is in process-facing deployments that tie CD measurements to Quality by Design and Process Analytical Technology programs in biologics manufacturing. This direction is reflected in the use of in-line sensors and flow cells for PAT-style monitoring during antibody processing, alongside growing reliance on multimodal characterization frameworks where CD complements orthogonal tools and computational modeling. Vendors that package CD hardware with interfaces, data pipelines, and method transfer kits for CRO and CMO environments can position for fleet purchases, since utilization and multi-sponsor service models convert capital equipment into fee-for-service throughput.
Recent Industry Developments in Circular Dichroism Spectrometers Market
- May 2026: JASCO communicated faster circular dichroism measurement settings, citing up to 20x speed improvements for protein and antibody analysis. Higher throughput strengthens CD positioning in biosimilar comparability and other higher-order structure workflows where turnaround time and repeatability affect instrument selection.
- October 2025: JASCO announced the ThermaFit3D program for its circular dichroism spectrometers to support thermal denaturation analysis using 3D CD spectra, including for complex biomolecules such as nucleic acids. Expanded analysis capabilities build on the software layer around installed instruments and help users standardize stress and stability studies without moving to alternative platforms.
- April 2024: JASCO released Spectra Manager BeStSel and BeStSel CFR software in collaboration with Eotvos Lorand University (ELTE) for offline secondary-structure estimation from CD spectra with regulatory-oriented features. This update supported more consistent, traceable secondary-structure reporting, aligning CD outputs with documentation requirements common in quality-controlled biopharma environments.
Circular Dichroism Spectrometers Market Report Scope and Research Methodology
Market Definition and Coverage
This market covers the value of new circular dichroism (CD) spectrometers sold globally, where the instrument is primarily used to measure circular dichroism signals for chiral analysis and protein secondary structure work.
Scope exclusions: We exclude software-only upgrades, service contracts, and CD add-on modules that are sold mainly as attachments to other spectroscopy platforms.
Segments Covered in This Report
- By Product Type
- Benchtop CD Spectrometers
- Floor-Standing CD Spectrometers
- SRCD Beamline Instruments
- CD Microspectrometers
- By Technology
- Electronic CD (ECD)
- Vibrational CD (VCD)
- Synchrotron Radiation CD (SRCD)
- By Application
- Protein Secondary-Structure Determination
- Vaccinology & Antigen Conformation Studies
- Biosimilar & Biologic Comparability Assessments
- Quality Control / Batch Release Testing
- Drug Discovery Screening & Hit Validation
- By End-User
- Pharmaceutical & Biotechnology Companies
- Contract Research / Manufacturing Organizations (CROs/CMOs)
- Academic & Government Research Institutes
- Hospital & Diagnostic Laboratories
- Geography
- North America
- United States
- Canada
- Mexico
- Europe
- Germany
- United Kingdom
- France
- Italy
- Spain
- Rest of Europe
- Asia-Pacific
- China
- Japan
- India
- Australia
- South Korea
- Rest of Asia-Pacific
- Middle East & Africa
- GCC
- South Africa
- Rest of Middle East & Africa
- South America
- Brazil
- Argentina
- Rest of South America
- North America
Data Sources, Market Sizing, and Validation
Desk Research
Desk work starts with pinning down what counts as a CD spectrometer and where demand shows up in the real world, before the numbers are modeled. We review public sources such as US FDA and EMA guidance for biologics characterization, NIH and NSF funding releases for structural biology research, OECD science and R&D statistics, and customs trade statistics for optical and analytical instruments where available. We also use peer-reviewed journals on CD spectroscopy applications, along with university core facility pages and lab procurement notes, to understand common instrument configurations and replacement cycles.
On the supply side, we refer to annual reports, product brochures, and publicly posted pricing sheets, along with distributor announcements and reputable press coverage, to map typical selling routes and end users. For company financial context and patent activity trends, a paid subscription database is used selectively to support sanity checks on revenue scale and innovation cadence. The sources listed here are illustrative only, and we used additional public documents and cross-checks during data collection and clarification.
Primary Interviews and Surveys
Primary work is used to validate what was learned from public information and to close gaps around pricing, shipment timing, and buyer behavior across pharma and biopharma labs, academic institutes, and contract research teams. The fieldwork also checks regional demand signals across APAC, EMEA, and the Americas, so the global totals are not driven by one geography's procurement cycle.
Distribution of primary research fieldwork respondents
| Company type | Respondent position | Region |
|---|---|---|
| Top tier: 38% | CXOs: 15% | APAC: 48% |
| Mid tier: 43% | Functional/Unit leaders: 31% | EMEA: 32% |
| Smaller Players: 19% | Managers: 54% | Americas: 20% |
Market-Sizing & Forecasting
The market is sized using a top-down approach where the addressable demand pool is reconstructed from life science R&D intensity, biologics pipeline activity, and the installed base renewal pattern for analytical instruments, then filtered to CD-specific use cases. To keep the estimate practical, we corroborate the total with selective bottom-up approximations like sampled average selling price (ASP) by configuration multiplied by implied unit volumes, plus channel checks from lab procurement cycles.
Key inputs that shape the model include the share of protein and chiral workflows that typically require CD measurements, annual lab capital equipment budgets, observed ASP ranges for benchtop versus higher performance units, lead times and replacement cycles in shared facilities, and the pace of biopharma method adoption for secondary structure and stability studies. Where unit estimates are thin in smaller countries, we use proxy indicators such as R&D spend and publication intensity, then apply an adjustment based on interview feedback.
For forecasting, we mainly use scenario analysis so growth can be tied to clear drivers like biologics development activity, research funding direction, and budgeting pressure in academia and pharma. Assumptions are checked with experts and applied consistently by region so the outlook remains traceable and easier to replicate.
Data Validation & Update Cycle
Before results are finalized, outputs are compared against independent signals such as procurement seasonality in research institutes, regional R&D funding movement, and observed ASP bands, and then large variances are investigated. A second analyst review is done to challenge the scope boundary, currency treatment, and the reasonableness of growth rates, and follow-up calls are triggered when a key assumption shifts or a respondent view conflicts with other checks.
The report is refreshed annually, and interim updates are made when material events affect demand or pricing, such as policy changes in research funding or major product refresh cycles. Right before delivery, we complete a final pass to ensure the latest public information and confirmed interview learnings are reflected in the model.
Mordor Intelligence's Circular Dichroism Spectrometers Market Sizing Compared With Other Published Estimates
It is normal to see different market size numbers for circular dichroism spectrometers because each publisher draws the boundary in its own way and uses different pricing and shipment assumptions. The biggest differences usually come from what is counted as a CD system, how new instrument revenue is separated from services, and which base year is used.
By tracking unit shipment logic and ASP bands by configuration, and then refreshing key adoption assumptions through Mordor Intelligence interview checks, the model avoids counting software, service revenue, or add-on CD modules that can inflate the instrument-only total. Some estimates also appear to mix broader optical spectroscopy categories into the same bucket, or they use a longer forecast window with a more aggressive replacement cycle, which can raise the current-year number even when demand signals look steady.
Benchmark comparison
| Source | Market Size | Gaps in Research Methodology |
|---|---|---|
| Mordor Intelligence | USD 39.35 M (2026) | |
| Industry Database A | USD 254.80 M (2025) | This estimate is much higher and appears to use a broader equipment scope and value definition that can pull in adjacent spectroscopy revenue lines, plus a different base year and longer horizon that changes replacement and adoption assumptions. |
| Trade Publisher B | USD 37.10 M (2024) | This figure is closer in scale but is anchored to an earlier year and uses a lower growth profile, which can come from conservative pricing progression and a narrower view of higher performance CD system demand in biopharma and advanced research labs. |
The spread in the table is mainly explained by scope boundaries and how pricing and adoption are carried forward year to year. When the included revenue lines are kept instrument-specific and the assumptions are tied back to observable demand signals, the final number stays balanced and easier to defend in planning discussions.
Key Questions Answered in the Report
What is the current size of the Circular Dichroism Spectrometers market?
The market is valued at USD 39.35 million in 2026 and is set to reach USD 56.3 million by 2031, registering a 7.44% CAGR.
Which product category leads the Circular Dichroism Spectrometers market?
Benchtop instruments held 44.78% share in 2025 due to their balance of performance and affordability for routine protein characterization.
Why is Asia-Pacific the fastest-growing region for Circular Dichroism Spectrometers?
Rapid biopharmaceutical expansion in China, India, and Japan, coupled with tightening regulatory standards, drives an 8.41% regional CAGR through 2031.
How do biosimilar programs influence demand for CD spectrometers?
Regulatory guidance requires higher-order structural comparability, making CD an essential assay and accelerating instrument purchases among biosimilar developers.
What technological trend most impacts future instrument design?
Integration of quantum-cascade-laser vibrational CD and microspectroscopy promises faster scans and sub-cellular resolution, opening new application domains.
Are high capital costs a barrier to adoption?
Yes. Upfront prices exceeding USD 250,000 and ongoing operational expenses can delay procurement, especially in emerging markets, although shared facilities and leasing soften the impact.